Evaluation of waist-to-height ratio as a predictor of insulin
resistance in non-diabetic obese individuals.
A cross-sectional study
Giovana Jamar
I, Flávio Rossi de Almeida
II, Antonio Gagliardi
III, Marianna Ribeiro Sobral
IV, Chao Tsai Ping
V, Evandro Sperandio
VI,
Marcelo Romiti
III, Rodolfo Arantes
III, Victor Zuniga Dourado
VIIUniversidade Federal de São Paulo (Unifesp), Santos, São Paulo (SP), Brazil
ABSTRACT
BACKGROUND: Insulin resistance (IR) and progressive pancreatic β-cell dysfunction have been identi-ied as the two fundamental features in the pathogenesis of obesity and non-insulin-dependent diabetes mellitus. We aimed to investigate correlations between anthropometric indices of obesity and IR in non-diabetic obese individuals, and the cutof value from receiver operating characteristic (ROC) curve analysis.
DESIGN AND SETTING: Cross-sectional study conducted in a private clinic.
METHODS: We included obese individuals (body mass index, BMI ≥ 30 kg/m2) with no diabetes mellitus
(fasting glucose levels ≤ 126 mg/dl). The participants were evaluated for the presence of cardiovascu-lar risk factors and through anthropometric measurements and biochemical tests. Furthermore, IR was assessed indirectly using the homeostatic model assessment (HOMA)-IR and HOMA-β indexes. The area under the curve (AUC) of the variables was compared. The sensitivity, speciicity and cutof of each variable for diagnosing IR were calculated.
RESULTS: The most promising anthropometric parameters for indicating IR in non-diabetic obese indi-viduals were waist-to-height ratio (WHtR), waist circumference (WC) and BMI. WHtR proved to be an in-dependent predictor of IR, with risk increased by 0.53% in HOMA-IR, 5.3% in HOMA-β and 1.14% in insulin. For HOMA-IR, WHtR had the highest AUC value (0.98), followed by WC (0.93) and BMI (0.81). For HOMA-β, WHtR also had the highest AUC value (0.83), followed by WC (0.75) and BMI (0.73). The optimal WHtR cutof was 0.65 for HOMA-IR and 0.67 for HOMA-β.
CONCLUSION: Among anthropometric obesity indicators, WHtR was most closely associated with occur-rences of IR and predicted the onset of diabetes in obese individuals.
IMSc. Doctoral Student, Department of
Biosciences, Universidade Federal de São Paulo (Unifesp), Santos, São Paulo (SP), Brazil.
IIPT, MSc. Doctoral Student, Department of Human
Movement Sciences, Universidade Federal de São Paulo (Unifesp), Santos, São Paulo (SP), Brazil.
orcid.org/0000-0003-4348-2241
IIIMD, PhD. Researcher, Department of
Cardiovascular Medicine, Angiocorpore Instituto de Medicina Cardiovascular, Santos, São Paulo (SP), Brazil.
IVBM. Master’s Student, Postgraduate Program on
Food, Nutrition and Health, Federal University of São Paulo (Unifesp), Santos, São Paulo (SP), Brazil.
VPhysiotherapist, Universidade Federal de São
Paulo (Unifesp), Santos, São Paulo (SP), Brazil.
VIPT, PhD. Associate Professor, Laboratory
of Epidemiology and Human Movement, Universidade Federal de São Paulo (Unifesp), Santos, São Paulo (SP), Brazil. orcid.org/0000-0002-8580-458X
VIIPT, PhD. Associate Professor, Department of
Human Movement Sciences, and Managing Professor, Laboratory of Epidemiology and Human Movement, Universidade Federal de São Paulo (Unifesp), Santos, São Paulo (SP), Brazil.
KEY WORDS: Anthropometry. Obesity. Diabetes mellitus.
INTRODUCTION
Insulin resistance (IR) is considered to be one of the main risk factors for cardiovascular disease (CVD). It is associated with several metabolic abnormalities such as impaired glucose tolerance, non-insulin-dependent diabetes mellitus (NIDDM), hypertension and dyslipidemia.1,2 Maintenance of normal blood glucose comes mainly from the ability of β-pancreatic cells to secrete insulin and the sensitivity of the target tissues to respond to normal levels of insulin in the bloodstream.3
he homeostasis model assessment (HOMA) is a widely validated clinical and epidemiologi-cal tool for estimating IR and β-cell function. It is derived from a mathematiepidemiologi-cal assessment of the balance between hepatic glucose output and insulin secretion from fasting levels of glucose and insulin.4 HOMA-IR and HOMA-β have been adopted as an alternative to the gold standard method, i.e. the hyperinsulinemic-euglycemic clamp technique. Although use of HOMA indices requires an invasive access,5 it is inexpensive and easy to apply.6
Anthropometry is considered to be a non-invasive tool for early diagnosis of the onset of NIDDM. In addition, it provides an alternative evaluation of IR at lower cost that is accessible for application in epidemiological studies and primary care within health services.8 However, there is no consensus regarding which anthropometric measurement is most indicative of IR in non-dia-betic obese subjects, or regarding the cutof values.
OBJECTIVE
We aimed to investigate the correlations between anthropomet-ric indices of obesity and IR in non-diabetic obese individuals, and to identify the best cutof values of these indices for predict-ing IR, through uspredict-ing receiver operatpredict-ing characteristic (ROC) curve analyses.
METHODS
Participants
his study used a cross-sectional design. he participants were selected as a convenience sample of consecutive patients admit-ted between 2013 and 2015, when they presenadmit-ted the following inclusion criteria: BMI ≥ 30 kg/m2 and no diabetes mellitus (DM) (reported or fasting blood glucose ≤ 126 mg/dl).12,13 We enrolled 136 obese individuals, comprising 72 men and 64 women, at the Obesity Clinic of the Angiocorpore Institute of Cardiovascular Medicine, located in the city of Santos, São Paulo, Brazil. hey had been referred for the examinations because of a variety of medical indications. his study formed part of a larger study assessing the determinants of exercise intolerance among obese individuals. All the participants agreed to participate, and none of them presented abnormalities during the examinations that would exclude them.
he Ethics Committee for Research on Human Beings of the Federal University of São Paulo (Universidade Federal de São Paulo, UNIFESP) approved this study under the number 1.079.239. Furthermore, an informed consent statement was signed by all of these volunteers.
Anthropometric obesity indices
Body weight and height were measured by using a weighing scale with stadiometer that measured to precisions of the near-est 0.1 kg and 1 cm (Toledo, São Paulo, Brazil). he individu-als were weighed without shoes. he neck (NC), waist (WC) and hip (HC) circumferences were measured in cm using an inelastic tape (Sanny) with precision of 1 mm. We measured NC at the midpoint of the neck; WC at the midpoint between the last rib and the iliac crest; and HC at the point of greatest gluteal protuberance.14,15 From these anthropometric measure-ments, we obtained indices relating to cardiometabolic health:
waist-to-hip ratio (WHR), waist/height ratio (WHtR), body mass index (BMI = weightkg/heightm²) and body shape index (BSI = WC/BMI2/3 x height½).16
Blood test
Blood samples were collected for laboratory-based biochemi-cal measurements ater the participants had fasted for 12 hours. We quantiied C-reactive protein (CRP, ng/ml), total cholesterol (mg/dl), HDL cholesterol (mg/dl), LDL cholesterol (mg/dl), insulin (IU/dl) and glucose (mg/dl). Glucose values were con-verted from mg/dl to mmol/l using the conversion factor 0.555.13
IR assessment
We used the homeostasis model assessments HOMA-IR and HOMA-β to indirectly determine IR, based on glucose and insu-lin values proposed by Matthews et al.3 IR was deined as situa-tions with HOMA-IR ≥ 2.7,17-21 and dysfunction of β-cells as situ-ations with HOMA-β > 175.4,22
Cardiovascular risk assessment
We assessed self-reported cardiovascular risk factors in accor-dance with the recommendations of the American College of Sports Medicine (ACSM). he participants were asked to report any previous diagnosis of the main cardiovascular risk factors such as arterial hypertension, dyslipidemia and diabetes, along with their age, situation of physical inactivity and smoking sta-tus. We considered that the participants were physically inactive if they reported doing less than 150 minutes per week of moder-ate-to-vigorous physical activity.23
Statistical analysis
We assessed correlations between anthropometric indices and HOMA-IR values, HOMA-β values and insulin concentration using Pearson correlation coeicients. hree models of stepwise multiple linear regressions were then itted, with HOMA-IR, HOMA-β and insulin as the main outcomes. he main predictors that we chose were the anthropometric indices that signiicantly correlated with outcomes ater univariate analysis. We checked for multicollinearity in the models by means of variation inla-tion factor (VIF) values < 4. he models were also adjusted for age, sex and cardiovascular risk factors.
point for diagnosing IR. We calculated the sensitivity, speciicity, positive and negative likelihood ratios and Youden index in rela-tion to these values.
All tests were evaluated at a two-tailed alpha level of 0.05. All statistical analyses were performed using the Statistical Package for the Social Sciences (SPSS), version 23 (SPSS Inc., Chicago, USA), and the MedCalc package, version 17 (MedCalc Sotware bvba, Belgium).
RESULTS
Baseline characteristics of the participants
he men and women involved in the present study were on aver-age middle-aver-aged. We found signiicantly higher values for weight, height, WC, WHR, NC and BSI among the men, while HC and BMI were signiicantly higher among the women. he partici-pants were mostly physically inactive. We observed a greater pro-portion of dyslipidemia among the men and higher fasting glu-cose among the women (Table 1).
When stratiied according to nutritional status, we found progressively impaired values for fasting insulin, HOMA-IR and HOMA-β with increasing severity of obesity, while CRP presented
a signiicant diference only at obesity level I and total cholesterol at obesity level III (Table 2).
Correlation and multiple regression analysis
We found strong correlations of WHtR, WC and BMI with HOMA-IR, HOMA-β and fasting insulin. On the other hand, WHR, NC and BSI showed weak correlations (Table 3). A step-wise multiple linear regression analysis was performed with HOMA-IR, HOMA-β and insulin as dependent variables. Ater adjustment for age, sex and obesity indices, WHtR proved to be an independent predictor of IR in this study (Table 4).
ROC curves
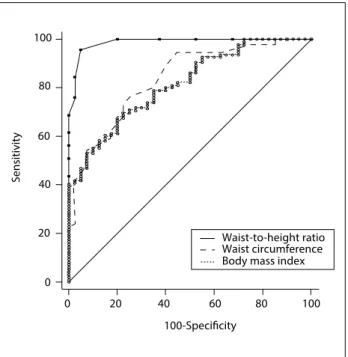
The abilities of WHtR, WC and BMI to detect IR were com-pared using ROC curves. For HOMA-IR, we found an AUC of 0.98 for WHtR, 0.83 for WC and 0.81 for BMI, such that the AUC was significantly greater for WHtR than for WC (difference between areas = 0.150; P < 0.001) and BMI (dif-ference between areas = 0.171; P < 0.001). We found that there was no significant difference in AUC between WC and BMI (difference between areas = 0.021; P = 0.629)
(Figure 1). Regarding HOMA-β, the AUC of 0.83 for WHtR
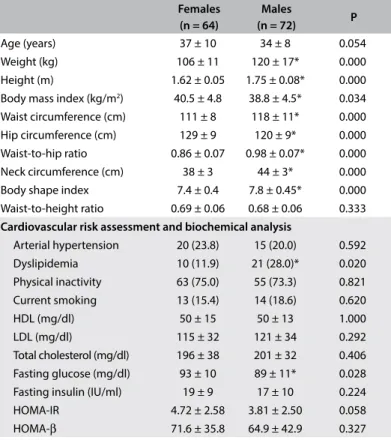
Table 1. General characteristics of the study sample according to sex. Mean ± standard deviation (SD).
Females (n = 64)
Males
(n = 72) P
Age (years) 37 ± 10 34 ± 8 0.054 Weight (kg) 106 ± 11 120 ± 17* 0.000 Height (m) 1.62 ± 0.05 1.75 ± 0.08* 0.000 Body mass index (kg/m2) 40.5 ± 4.8 38.8 ± 4.5* 0.034
Waist circumference (cm) 111 ± 8 118 ± 11* 0.000 Hip circumference (cm) 129 ± 9 120 ± 9* 0.000 Waist-to-hip ratio 0.86 ± 0.07 0.98 ± 0.07* 0.000 Neck circumference (cm) 38 ± 3 44 ± 3* 0.000 Body shape index 7.4 ± 0.4 7.8 ± 0.45* 0.000 Waist-to-height ratio 0.69 ± 0.06 0.68 ± 0.06 0.333
Cardiovascular risk assessment and biochemical analysis
Arterial hypertension 20 (23.8) 15 (20.0) 0.592 Dyslipidemia 10 (11.9) 21 (28.0)* 0.020 Physical inactivity 63 (75.0) 55 (73.3) 0.821 Current smoking 13 (15.4) 14 (18.6) 0.620 HDL (mg/dl) 50 ± 15 50 ± 13 1.000 LDL (mg/dl) 115 ± 32 121 ± 34 0.292 Total cholesterol (mg/dl) 196 ± 38 201 ± 32 0.406 Fasting glucose (mg/dl) 93 ± 10 89 ± 11* 0.028 Fasting insulin (IU/ml) 19 ± 9 17 ± 10 0.224 HOMA-IR 4.72 ± 2.58 3.81 ± 2.50 0.058 HOMA-β 71.6 ± 35.8 64.9 ± 42.9 0.327
HDL = high-density lipoprotein; LDL = low-density lipoprotein; HOMA-IR = homeostasis model assessment - insulin resistance; HOMA-β = homeostasis model assessment - beta-cell function.
*P < 0.05 = females versus males.
Table 2. Description of anthropometric measurements and biochemical analysis between obesity levels. Mean ± standard deviation (SD).
Obesity I (n = 20)
Obesity II (n = 63)
Obesity III (n = 53) Anthropometric parameters
Weight (kg) 101 ± 10.5 108 ± 12.0 124 ± 15.6d
Height (cm) 172 ± 0.0 169 ± 0.0 166 ± 0.0b
Waist circumference (cm) 107 ± 6 113 ± 8 121 ± 10d
Hip circumference (cm) 115 ± 4.6 121 ± 7.2 133 ± 8.8ad
Neck circumference (cm) 40 ± 3.1 41 ± 4.2 41 ± 4.8 Waist-to-hip ratio 0.93 ± 0.07 0.93 ± 0.89 0.90 ± 0.10 Waist-to-height ratio 0.62 ± 0.03 0.67 ± 0.05 0.73 ± 0.06ad
Body mass index (kg/m2) 33.8 ± 0.8 37.6 ± 1.3 44.9 ± 3.6ad
Body shape index 7.8 ± 0.4 7.7 ± 0.5 7.4 ± 0.5bc
Biochemical analysis
C-reactive protein (ng/ml) 2.15 ± 2.86 0.93 ± 1.15 0.92 ± 0.98e
Total cholesterol (mg/dl) 198 ± 35 191 ± 32 208 ± 38c
HDL (mg/dl) 53 ± 16 48 ± 13 51 ± 14 LDL (mg/dl) 124 ± 25 116 ± 27 119 ± 43 Fasting glucose (mg/dl) 88 ± 9 91 ± 11 93 ± 11 Fasting insulin (IU/ml) 9.6 ± 4.0 15.0 ± 6.2 25.6 ± 11.6d
HOMA-IR 2.1 ± 1.0 3.4 ± 1.6 6.0 ± 2.8d
HOMA-β 35.5 ± 15 55.7 ± 23 95.3 ± 45d HDL = high-density lipoprotein; LDL = low-density lipoprotein; HOMA-IR = homeostasis model assessment - insulin resistance; HOMA- β = homeostasis model assessment - beta-cell function.
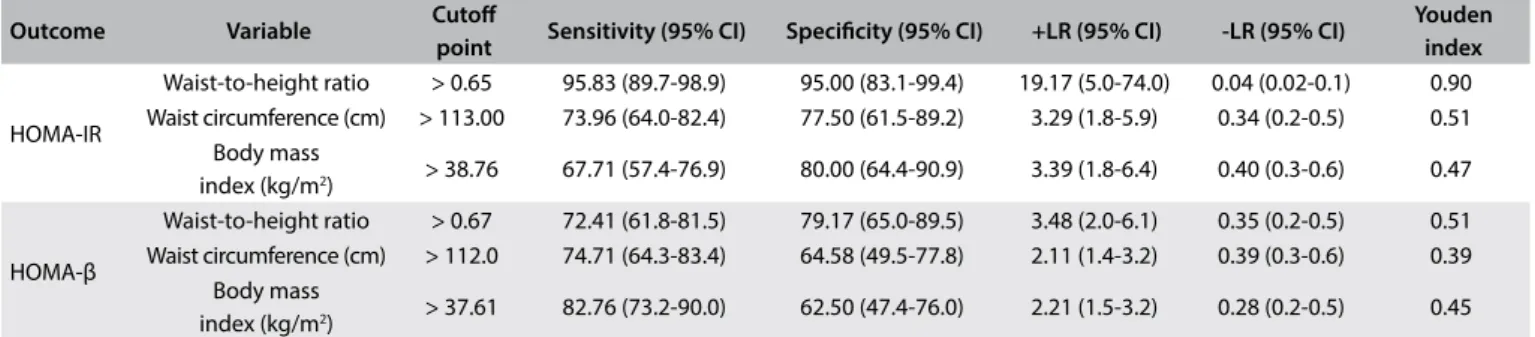
was significantly greater than the AUC for WC (0.75, differ-ence between areas = 0.082; P = 0.013) and BMI (0.73, dif-ference between areas = 0.099; P = 0.009), with no signifi-cant difference between WC and BMI (difference between areas = 0.017; P = 0.727) (Figure 2). The best cutoff points for HOMA-IR were 0.65, 113 cm and 38.76 kg/m2 and for HOMA-β were 0.67, 112 cm and 37.61 kg/m2, respectively for WHtR, WC and BMI (Table 5).
DISCUSSION
In the present study, we observed that not all the anthropometric parameters studied were signiicantly associated with HOMA-IR
and HOMA-β. he most promising anthropometric parameters for indicating IR in non-diabetic obese adults were WHtR, WC and BMI. Our results suggest that there are advantages to using WHtR. In our analysis, we observed that the risk of IR was raised by 0.53% in HOMA-IR, 5.3% in HOMA-β and 1.14% in insulin for each additional 1% increase in WHtR (= 0.01). hus, WHtR was a predictor for the degree of IR and predisposition towards dia-betes in our sample of obese individuals. Recently, Vikam et al.10 observed increased odds ratios for hyperinsulinemia and meta-bolic syndrome among individuals with WHtR > 0.5.
Use of WHtR for detecting abdominal obesity and its associ-ated risks to health was first proposed in the 1990s.24 The growing
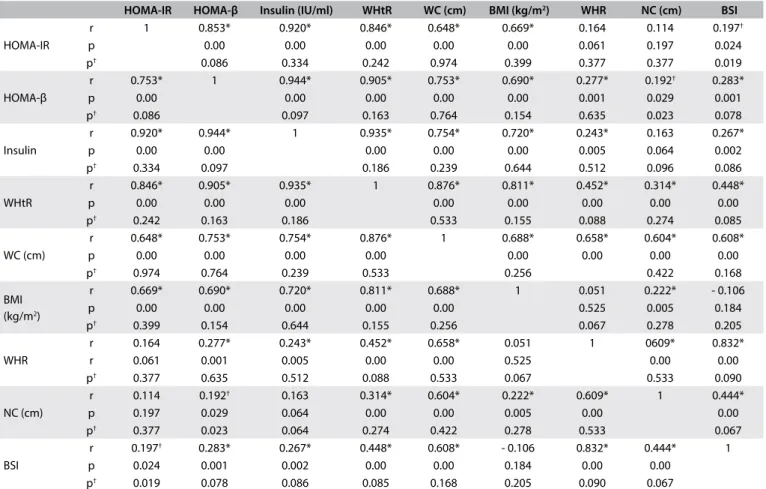
Table 3. Matrix of correlations between obesity indices and values for homeostasis model assessment - insulin resistance (HOMA-IR) and for HOMA - beta-cell function (HOMA-β) in the study sample
HOMA-IR HOMA-β Insulin (IU/ml) WHtR WC (cm) BMI (kg/m2) WHR NC (cm) BSI
HOMA-IR
r 1 0.853* 0.920* 0.846* 0.648* 0.669* 0.164 0.114 0.197†
p 0.00 0.00 0.00 0.00 0.00 0.061 0.197 0.024 p† 0.086 0.334 0.242 0.974 0.399 0.377 0.377 0.019
HOMA-β
r 0.753* 1 0.944* 0.905* 0.753* 0.690* 0.277* 0.192† 0.283*
p 0.00 0.00 0.00 0.00 0.00 0.001 0.029 0.001 p† 0.086 0.097 0.163 0.764 0.154 0.635 0.023 0.078
Insulin
r 0.920* 0.944* 1 0.935* 0.754* 0.720* 0.243* 0.163 0.267* p 0.00 0.00 0.00 0.00 0.00 0.005 0.064 0.002 p† 0.334 0.097 0.186 0.239 0.644 0.512 0.096 0.086
WHtR
r 0.846* 0.905* 0.935* 1 0.876* 0.811* 0.452* 0.314* 0.448* p 0.00 0.00 0.00 0.00 0.00 0.00 0.00 0.00 p† 0.242 0.163 0.186 0.533 0.155 0.088 0.274 0.085
WC (cm)
r 0.648* 0.753* 0.754* 0.876* 1 0.688* 0.658* 0.604* 0.608* p 0.00 0.00 0.00 0.00 0.00 0.00 0.00 0.00 p† 0.974 0.764 0.239 0.533 0.256 0.422 0.168
BMI (kg/m2)
r 0.669* 0.690* 0.720* 0.811* 0.688* 1 0.051 0.222* - 0.106 p 0.00 0.00 0.00 0.00 0.00 0.525 0.005 0.184 p† 0.399 0.154 0.644 0.155 0.256 0.067 0.278 0.205
WHR
r 0.164 0.277* 0.243* 0.452* 0.658* 0.051 1 0609* 0.832* r 0.061 0.001 0.005 0.00 0.00 0.525 0.00 0.00 p† 0.377 0.635 0.512 0.088 0.533 0.067 0.533 0.090
NC (cm)
r 0.114 0.192† 0.163 0.314* 0.604* 0.222* 0.609* 1 0.444*
p 0.197 0.029 0.064 0.00 0.00 0.005 0.00 0.00 p† 0.377 0.023 0.064 0.274 0.422 0.278 0.533 0.067
BSI
r 0.197† 0.283* 0.267* 0.448* 0.608* - 0.106 0.832* 0.444* 1
p 0.024 0.001 0.002 0.00 0.00 0.184 0.00 0.00 p† 0.019 0.078 0.086 0.085 0.168 0.205 0.090 0.067
r = Pearson coeicient; WHtR = waist-to-height ratio; WC = waist circumference; BMI = body mass index; WHR = waist-to-hip ratio; NC = neck circumference; BSI = body shape index. *Signiicant correlations for all subjects; †Signiicant correlations for females versus males.
Table 4. Multiple regression analysis on obesity indices that predict insulin resistance
Dependent variable Predictors β 95% CI R2 P
HOMA-IR waist-to-height ratio 0.53* 0.47-0.59 0.71 < 0.01 HOMA-β waist-to-height ratio 5.30* 4.93-5.67 0.82 < 0.01 Insulin (IU/ml) waist-to-height ratio 1.14* 1.04-1.25 0.73 < 0.01
body of literature showed that this abdominal obesity indicator could predict the cardiometabolic risk even better than BMI and WC.25 A recent meta-analysis on studies evaluating different indices of adiposity showed that WHtR was a better predictor for hyperinsulinemia, diabetes, arterial hypertension, dyslip-idemia, metabolic syndrome and other cardiovascular health problems than were BMI or WC, in both men and women.26 In addition, our AUC values for this anthropometric obesity indicator were higher than in previous prediction studies with WHtR,11,27,28 thus emphasizing the accuracy of AUC measure-ments for identifying IR in obese populations. According to Behboudi-Gandevani et al.,11 WHtR may be proposed as a sen-sitive, inexpensive, noninvasive, simple-to-assess and easy-to-calculate tool for screening for IR.
Taking into account that ethnicity and gender may influence body composition, studies on Brazilian and Indian overweight women also showed that the WHtR was the most important predictive measurement for IR and diabetes.27,29 However, stud-ies on men of different ethnicity indicated that BMI was the best predictor for IR.28,30,31 It should be noted that BMI is char-acterized as an indicator of general adiposity because of its inability to assess the distribution of body fat, thus presenting a weaker relationship with visceral fat.27 In a recent meta-anal-ysis, Savva et al.32 compared the association of BMI and WHtR with the cardiometabolic risk factor of diabetes in Asian and non-Asian populations. The data from cross-sectional studies indicated that WHtR is superior to BMI for detecting diabe-tes in both Asian and non-Asian populations. There are still few studies of this design on Brazilian populations, especially in relation to obese individuals.32
The risk of developing obesity-related comorbidities is pro-portional to the degree of obesity and, more specifically, the accumulation of visceral fat.33 However, the presence of meta-bolic disorders varies considerably among obese individuals,34 since it is known that there is one subgroup of obese individuals that seems to be protected against or is more resistant to devel-oping cardiometabolic complications.35 Nevertheless, regarding phenotypes for metabolic status and diabetes, healthy obese and metabolically unhealthy normal-weight individuals appear to have an equivalent risk.36
In the general population, a WHtR cutof < 0.5 is recommended, which can be presented as a simple public health message that indi-viduals should seek to maintain their WC as less than half of their height. We showed that the higher this ratio is, the higher the risk of indirect IR is, and we proposed a cutof > 0.65 to identify IR in non-diabetic obese individuals. his indicates that there is a need for a speciic evaluation on this population, for early detection of IR that could ultimately reduce the incidence or severity of dia-betes and cardiovascular diseases.
Figure 1. Receiver operating characteristic (ROC) curve for anthropometric parameters that predict insulin resistance according to the homeostatic model assessment-insulin resistance (HOMA-IR). The areas under the ROC curves and the 95%
conidence intervals (95% CI) were 0.98 (0.95-0.99) for waist-to-height ratio (WHtR); 0.93 (0.76-0.89) for waist circumference (WC); and 0.81 (0.74-0.87) for body mass index (BMI).
S
ensitivit
y
100-Specificity
Waist-to-height ratio Waist circumference Body mass index 100
100 80
80 60
60 40
40 20
20 0
0
Figure 2. Receiver operating characteristic (ROC) curve for anthropometric parameters that predict insulin resistance according to the homeostatic model assessment (HOMA)-β. The areas under the ROC curves and the 95% conidence intervals (95% CI) were 0.83 (0.76-0.89) for waist-to-height ratio (WHtR); 0.75 (0.67-0.82) for waist circumference (WC); and 0.73 (0.65-0.81) for body mass index (BMI).
S
ensitivit
y
100-Specificity
Waist-to-height ratio Waist circumference Body mass index 100
100 80
80 60
60 40
40 20
20 0
Table 5. Optimal cutof point values and their related sensitivity, speciicity, positive and negative likelihood ratios and Youden index for obesity indices, regarding discrimination of insulin resistance
Outcome Variable Cutof
point Sensitivity (95% CI) Speciicity (95% CI) +LR (95% CI) -LR (95% CI)
Youden index
HOMA-IR
Waist-to-height ratio > 0.65 95.83 (89.7-98.9) 95.00 (83.1-99.4) 19.17 (5.0-74.0) 0.04 (0.02-0.1) 0.90 Waist circumference (cm) > 113.00 73.96 (64.0-82.4) 77.50 (61.5-89.2) 3.29 (1.8-5.9) 0.34 (0.2-0.5) 0.51
Body mass
index (kg/m2) > 38.76 67.71 (57.4-76.9) 80.00 (64.4-90.9) 3.39 (1.8-6.4) 0.40 (0.3-0.6) 0.47
HOMA-β
Waist-to-height ratio > 0.67 72.41 (61.8-81.5) 79.17 (65.0-89.5) 3.48 (2.0-6.1) 0.35 (0.2-0.5) 0.51 Waist circumference (cm) > 112.0 74.71 (64.3-83.4) 64.58 (49.5-77.8) 2.11 (1.4-3.2) 0.39 (0.3-0.6) 0.39
Body mass
index (kg/m2) > 37.61 82.76 (73.2-90.0) 62.50 (47.4-76.0) 2.21 (1.5-3.2) 0.28 (0.2-0.5) 0.45 HOMA-IR = homeostasis model assessment - insulin resistance; HOMA-β = homeostasis model assessment - beta-cell function; +LR = positive likelihood ratio; -LR = negative likelihood ratio.
In summary, we found that WHtR may be useful in clinical practice due to its advantageous simplicity. Also, it is easy to calcu-late, does not require any special equipment other than an inelastic tape, and only requires some rater training.
he present study has limitations that should be considered. Our sample was not enough to extract the cutof points according to sex. Since not all obese individuals have metabolic alterations, our strategy was to ascertain which anthropometric measurements were better correlated with IR, and whether non-diabetic obese individuals would present a cutof point diferent from general population for predicting the onset of diabetes, thereby suggest-ing diferent reference values for a more accurate assessment in this speciic group. Perhaps inclusion of a eutrophic group would have contributed towards reinforcing our important indings. Future research should aim to screen Brazilian obese populations, in order to provide support for our remarks.
CONCLUSION
We can conclude that the WHtR is a strong predictor of IR, as assessed using HOMA, among non-diabetic obese adults. Our results suggest that WHtR can form a simple and pow-erful tool for screening for IR among these patients, since we found convincing AUC and sensitivity and specificity values for this index in detecting clinically high values of HOMA-IR and HOMA-β.
REFERENCES
1. Goldine AB, Conlin PR, Halperin F, et al. A randomised trial of salsalate for insulin resistance and cardiovascular risk factors in persons with abnormal glucose tolerance. Diabetologia. 2013;56(4):714-23. 2. Carneiro IBP, Sampaio HAC, Carioca AAF, Pinto FJM, Damasceno NRT.
Antigos e novos indicadores antropométricos como preditores de resistência à insulina em adolescentes [Old and new anthropometric indices as insulin resistance predictors in adolescentes]. Arq Bras Endocrinol Metabol. 2014;58(8):838-43.
3. Matthews DR. Insulin resistance and beta-cell function--a clinical perspective. Diabetes Obes Metab. 2001;3 Suppl 1:S28-33.
4. Song Y, Manson JE, Tinker L, et al. Insulin sensitivity and insulin secretion determined by homeostasis model assessment and risk of diabetes in a multiethnic cohort of women: the Women’s Health Initiative Observational Study. Diabetes Care. 2007;30(7):1747-52.
5. Wallace TM, Levy JC, Matthews DR. Use and abuse of HOMA modeling. Diabetes Care. 2004;27(6):1487-95.
6. Matthews DR, Hosker JP, Rudenski AS, et al. Homeostasis model assessment: insulin resistance and beta-cell function from fasting plasma glucose and insulin concentrations in man. Diabetologia. 1985;28(7):412-9. 7. de Koning L, Merchant AT, Pogue J, Anand SS. Waist circumference and waist-to-hip ratio as predictors of cardiovascular events: meta-regression analysis of prospective studies. Eur Heart J. 2007;28(7):850-6. 8. Vázquez-Vela ME, Torres N, Tovar AR. White adipose tissue as endocrine
organ and its role in obesity. Arch Med Res. 2008;39(8):715-28. 9. Lim SM, Choi DP, Rhee Y, Kim HC. Association between Obesity Indices
and Insulin Resistance among Healthy Korean Adolescents: The JS High School Study. PLoS One. 2015;10(5):e0125238.
10. Vikram NK, Latii AN, Misra A, et al. Waist-to-Height Ratio Compared to Standard Obesity Measures as Predictor of Cardiometabolic Risk Factors in Asian Indians in North India. Metab Syndr Relat Disord. 2016;14(10):492-499. 11. Behboudi-Gandevani S, Ramezani Tehrani F, Cheraghi L, Azizi F. Could “a
body shape index” and “waist to height ratio” predict insulin resistance and metabolic syndrome in polycystic ovary syndrome? Eur J Obstet Gynecol Reprod Biol. 2016;205:110-4.
12. Vasques AC, Geloneze B, Rosado L, et al. Indicadores antropométricos de resistência à insulina [Anthropometric indicators of insulin resistance]. Arq Bras Cardiol. 2010;95(1):e14-e23.
13. American Diabetes Association. Diagnosis and classiication of diabetes mellitus. Diabetes Care. 2014;37 Suppl 1:S81-90.
14. Lohman TG, Roche AF, Martorell R. Anthropometric standardization reference manual. Champaign: Human Kinetics Books; 1988. 15. Ben-Noun L, Sohar E, Laor A. Neck circumference as a simple screening measure
16. Krakauer NY, Krakauer JC. A new body shape index predicts mortality hazard independently of body mass index. PLoS One. 2012;7(7):e39504.
17. Esteghamati A, Ashraf H, Esteghamati AR, et al. Optimal threshold of homeostasis model assessment for insulin resistance in an Iranian population: the implication of metabolic syndrome to detect insulin resistance. Diabetes Res Clin Pract. 2009;84(3):279-87.
18. Bravata DM, Wells CK, Concato J, et al. Two measures of insulin sensitivity provided similar information in a U.S. population. J Clin Epidemiol. 2004;57(11):1214-7.
19. Lee JM, Okumura MJ, Davis MM, Herman WH, Gurney JG. Prevalence and determinants of insulin resistance among U.S. adolescents: a population-based study. Diabetes Care. 2006;29(11):2427-32.
20. Geloneze B, Tambascia MA. Avaliação laboratorial e diagnóstico da resistência insulínica [Laboratorial evaluation and diagnosis of insulin resistance]. Arq Bras Endocrinol Metabol. 2006;50(2):208-15. 21. Geloneze B, Repetto EM, Geloneze SR, Tambascia MA, Ermetice MN.
The threshold value for insulin resistance (HOMA-IR) in an admixtured population IR in the Brazilian Metabolic Syndrome Study. Diabetes Res Clin Pract. 2006;72(2):219-20.
22. Oliveira EP, Souza MLA, Lima MDA. Índice HOMA (homeostasis model assessment) na prática clínica: uma revisão [HOMA (homeostasis model assessment) index in clinical practice: a review]. J Bras Patol Med Lab. 2005;41(4):237-43.
23. Thompson WR, Gordon NF, Pescatello LS. ACSM’s Guidelines for Exercise Testing and Prescription. 8th edition. Philadelphia: Lippincott Williams
& Wilkins; 2010.
24. Ashwell M, Lejeune S, McPherson K. Ratio of waist circumference to height may be better indicator of need for weight management. BMJ. 1996;312(7027):377.
25. Nazare JA, Smith JD, Borel AL, et al. Ethnic inluences on the relations between abdominal subcutaneous and visceral adiposity, liver fat, and cardiometabolic risk proile: the International Study of Prediction of Intra-Abdominal Adiposity and Its Relationship With Cardiometabolic Risk/Intra-Abdominal Adiposity. Am J Clin Nutr. 2012;96(4):714-26. 26. Ashwell M, Gunn P, Gibson S. Waist-to-height ratio is a better
screening tool than waist circumference and BMI for adult cardiometabolic risk factors: systematic review and meta-analysis. Obes Rev. 2012;13(3):275-86.
27. Matos LN, Giorelli Gde V, Dias CB. Correlation of anthropometric indicators for identifying insulin sensitivity and resistance. Sao Paulo Med J. 2011;129(1):30-5.
28. Nadeem A, Naveed AK, Hussain MM, Raza SI. Cut-off values of anthropometric indices to determine insulin resistance in Pakistani adults. J Pak Med Assoc. 2013;63(10):1220-5.
29. Hadaegh F, Shaiee G, Azizi F. Anthropometric predictors of incident type 2 diabetes mellitus in Iranian women. Ann Saudi Med. 2009;29(3):194-200.
30. Wang F, Wu S, Song Y, et al. Waist circumference, body mass index and waist to hip ratio for prediction of the metabolic syndrome in Chinese. Nutr Metab Cardiovasc Dis. 2009;19(8):542-7.
31. Hadaegh F, Zabetian A, Harati H, Azizi F. Waist/height ratio as a better predictor of type 2 diabetes compared to body mass index in Tehranian adult men--a 3.6-year prospective study. Exp Clin Endocrinol Diabetes. 2006;114(06):310-5.
32. Savva SC, Lamnisos D, Kafatos AG. Predicting cardiometabolic risk: waist-to-height ratio or BMI. A meta-analysis. Diabetes Metab Syndr Obes. 2013;6:403-19.
33. Després JP, Cartier A, Côté M, Arsenault BJ. The concept of cardiometabolic risk: Bridging the ields of diabetology and cardiology. Ann Med. 2008;40(7):514-23.
34. Primeau V, Coderre L, Karelis AD, et al. Characterizing the proile of obese patients who are metabolically healthy. Int J Obes (Lond). 2011;35(7):971-81.
35. Stefan N, Häring HU, Hu FB, Schulze MB. Metabolically healthy obesity: epidemiology, mechanisms, and clinical implications. Lancet Diabetes Endocrinol. 2013;1(2):152-62.
36. Gaiţă D, Moşteoru S. Metabolically healthy versus unhealthy obesity and risk for diabetes mellitus and cardiovascular diseases. Cardiovascular Endocrinology. 2017;6(1):23-6. Available from: http://journals. lww.com/cardiovascularendocrinology/Abstract/2017/03000/ Metabolically_healthy_versus_unhealthy_obesity_and.6.aspx. Accessed in 2017 (Jul 13).
Sources of funding: Fundação de Amparo à Pesquisa do Estado de São Paulo (2011/07282-6)
Conlict of interest: None
Date of irst submission: December 29, 2016
Last received: April 7, 2017
Accepted: April 28, 2017
Address for correspondence:
Flávio Rossi de Almeida
Departamento de Ciências do Movimento Humano, Universidade Federal de São Paulo (UNIFESP)
Rua Silva Jardim, 136
Santos — São Paulo (SP) — Brasil CEP 11015-020