Cutof values for appendicular skeletal muscle mass and
strength in relation to fear of falling among Brazilian
older adults: cross-sectional study
Ricardo Aurélio Carvalho Sampaio
I, Priscila Yukari Sewo Sampaio
II, Luz Albany Arcila Castaño
III, João Francisco Barbieri
IV,
Hélio José Coelho Júnior
V, Hidenori Arai
VI, Marco Carlos Uchida
VII, Gustavo Luis Gutierrez
VIIISchool of Physical Education, Universidade Estadual de Campinas (UNICAMP), Campinas (SP), Brazil
ABSTRACT
CONTEXT AND OBJECTIVE: Sarcopenia is an emerging public health issue in Brazil. Because of its high prevalence and the lack of national data, the objective here was to identify cutof points for appendicular skeletal muscle (ASM) and handgrip strength in relation to fear of falling among Brazilian older adults. DESIGN AND SETTING: Cross-sectional study; in the community.
METHODS: Participants underwent morphological and functional evaluations; and were asked about pre-vious falls and fear of falling. Diferent adjustments to ASM and handgrip strength were used. Slow walking speed was deined as < 0.8 m/s or 1.0 m/s. Gender and age groups were compared using t tests, analysis of variance (ANOVA), chi-square test or Fisher’s exact test. Receiver operating characteristic curves were used to identify cutofs for ASM and handgrip strength in relation to fear of falling.
RESULTS: 578 older adults participated in this study. Function levels decreased with increasing age, and body composition difered between the sexes. In relation to fear of falling, the cutofs for ASM adjusted for body mass index (BMI) were < 0.85 for men and < 0.53 for women; the cutofs for absolute handgrip strength and relative handgrip strength (adjusted for BMI) were 30.0 kgf and 21.7 kgf, and 1.07 and 0.66, for men and women, respectively.
CONCLUSION: The values presented can be used as references in clinical practice and research. We recom-mend use of ASM adjusted forBMI and choosing between absolute and relative handgrip strength for men and women, according to study needs.
IPhD. Physical Educator,Applied Kinesiology
Laboratory, School of Physical Education, Universidade Estadual de Campinas (UNICAMP), Campinas (SP), Brazil.
IIPhD. Occupational Therapist and Assistant
Professor, Department of Occupational Therapy, Universidade Federal de Sergipe (UFS), Lagarto (SE), Brazil.
IIIPhysical Educator, Department of Sports
Science and Recreation, Universidad Tecnologica de Pereira, Pereira, Risaralda, Colombia. IVPhysical Educator and Master’s Stu dent, School
of Physical Education, Universidade Estadual de Campinas (UNICAMP), Campinas (SP), Brazil. VMSc. Physical Educator and Doctoral Student, Applied Kinesiology Laboratory, School of Physical Education, Universidade Estadual de Campinas (UNICAMP), Campinas (SP), Brazil. VIMD, PhD. Deputy Director, Kokuritsu Choju Iryo
Kenkyu Center Kenkyujo (NCGG), Obu, Aichi Prefecture, Japan.
VIIPhD. Associate Professor and Head of Applied
Kinesiology Laboratory, School of Physical Education, Universidade Estadual de Campinas (UNICAMP), Campinas (SP), Brazil.
VIIIPhD. Professor, School of Physical Education,
Universidade Estadual de Campinas (UNICAMP), Campinas (SP), Brazil.
KEY WORDS:
Aging. Sarcopenia. Muscle, skeletal. Hand strength. Walking speed.
INTRODUCTION
Sarcopenia, deined as progressive loss of muscle mass and strength/functionality with aging, is an emerging public health issue in Brazil.1 Loss of muscle mass and function may result in loss of physical capabilities (e.g. endurance, strength and muscle power), poor quality of life, unfavorable metabolic efects, falls and fear of falling, frailty and mortality among older adults. Sarcopenia is frequently associated with multiple morbid conditions, smoking habit, low body mass index (BMI), malnutrition and physical inactivity.2
Several consensuses and recommendations have been proposed by diferent institutions in attempts to standardize the conceptual approaches used to diagnose sarcopenia.2-5 Among these, experts agree that three key factors should be addressed: body composition (muscle mass), func-tionality (e.g. walking speed) and muscle strength (e.g. handgrip strength).
It has been estimated that ater the age of 50, muscle mass decreases consistently at a rate of approximately 1% per year, walking speed at a rate of 2.0-2.2% and handgrip strength at a rate of 1.9-5.0%, as a result of the transition process of decreasing lean body mass and increasing fat accumulation.6,7 Cutofs and reference values have also been presented in consensuses and rec-ommendations. In addition to the international characteristics of the studies from which these values were compiled, most of these studies were conducted in developed countries and/or in countries that difer genetically, ethnically and culturally from Brazil. Moreover, even if the mis-cegenation of the Brazilian population has been taken into consideration, there are diiculties and limitations in making inferences from these values in relation to Brazilian older adults.
of sarcopenia among older Brazilians has now reached 17%,1 yet there is a lack of national preliminary data. herefore, in this light, the aim of this study was to identify cutof values for appendicular skeletal muscle (ASM), and handgrip strength in relation to fear of falling among Brazilian older adults.
OBJECTIVE
he aim of this study was primarily to identify evidence-based cutof values for ASM and handgrip strength in relation to fear of falling; and secondarily, to ascertain the morphological and functional characteristics of Brazilian older adults according to gender and age groups.
METHODS
Design and ethics
his study had a cross-sectional design (frequency study) and data were collected during 2015 and 2016.
he present study was approved by the Ethics Committee of the University of Campinas, under protocol #39437514.0.0000.5404. All participants signed an informed consent statement in which they agreed to participate in the study, and this was signed before data collection.
Subjects
Subjects were recruited from four community centers for older adults in southeastern and southern Brazil during the study period, and were invited to participate voluntarily in a con-venience sample. In these centers, they undertook social and physical activities provided by physical educators. Although subjects were recruited mainly in community centers, individu-als who were not participating in regular activities (e.g, neigh-bors, relatives and others living in the community) were also invited to participate. his ensured variability of this sample. It is important to mention that neither center was responsible for rehabilitation or for any kind of medical treatment.
he inclusion criteria were that the subjects should be: a) community-dwelling individuals; b) 60 years of age or older; and c) able to answer questions and perform functional and body composition tests. he exclusion criteria comprised situ-ations of: a) uncontrolled cardiovascular or pulmonary disease, conditions associated with a risk of falling (i.e. Parkinson’s dis-ease or stroke), physical and cognitive impairment (according to reported chronic diseases, e.g. presence of conditions that might entail a requirement for assistance in basic activities of daily liv-ing) and items present in the functional assessment staging of Alzheimer’s disease (veriied onsite); b) use of a metal prosthe-sis and/or pacemaker (i.e. interference with the bioelectrical impedance analysis).
Assessments
he assessments were divided into two steps: a) indirect assess-ments based on questionnaires; and b) direct assessassess-ments based on morphofunctional evaluations (i.e. anthropometric charac-teristics and physical function). Before the evaluations, all tests were explained in detail to all participants by an experienced researcher. Verbal encouragement was provided to ensure that the participants reached the best performance possible.
Indirect assessments
Chronic degenerative diseases, age, fear of falling and falls
A questionnaire was used to obtain data regarding the presence of chronic diseases, age, fear of falling and occurrences of falls during the year prior to this investigation. he questionnaire was based on simple questions that were answered by means of binary constructs (i.e. yes or no), so as to avoid possible misun-derstanding between the researchers and the subjects. First, an extensive list of the most prevalent chronic diseases (e.g. hyper-tension, diabetes or osteoporosis) among older adults was pre-sented to the participants. hey then stated whether they had any previous clinical diagnosis of the chronic condition (in the form of a yes/no response). hese data are not shown and were used solely for exclusion purposes.
In relation to fear of falling, the following question was asked: “Are you afraid of falling?”. he following question was asked about occurrences of falls: “Have you experienced a fall in the past year?’’. It is important to mention that only the question about occurrences of falls was retrospective: all the other questions and evaluations were in relation to the period within which the study was conducted.
Direct assessments
Anthropometric measurements
Physical function
Walking speed was evaluated over a 10-meter distance that was clearly marked out on the ground. An additional initial distance of 2 m was also marked out, thus making an overall marked-out distance of 12 m in length. he participants were asked to walk the entire distance at their usual pace. he time required to com-plete the inner 10-m distance was assessed.10 Walking speed was calculated as a continuous value.
Cutofs of 0.8 m/s and 1.0 m/s cutofs were applied. he value of 0.8 m/s has been suggested in other studies as representative of slow walking. However, considering the range in walking speed that is seen in such studies, and the characteristics of the sam-ple that we studied, 1 m/s was also used.2,3
he timed up-and-go (TUG) testhas been widely described. he time taken for the subject to stand up from a seated position on a chair, walk three meters ahead in a straight line, go round a cone and return to the chair and sit down is measured.11
Handgrip strength was measured using a Jamar digital dyna-mometer (Jamar Plus+; Sammons Preston, Rolyon, Bolingbrook, IL, USA). While seated, the subject held the dynamometer with elbow lexed at 90° without it touching his/her body. Ater prepara-tion, the subject was instructed to pull the lever as much as possible. Each hand was tested once and the best value was used in the analy-sis. he subjects were also instructed to avoid the Valsalva maneuver or blocked breath while performing the test. Handle position two was set as standard for all subjects, as previously recommended.12
Statistical analyses
All analyses were carried out using the SPSS sotware, version 21.0 (IBM Inc., Chicago, IL, USA) and the MedCalc statistical sotware version 17.2 (MedCalc Sotware, Ostend, Belgium). Values were presented descriptively, as the mean ± standard deviation (SD) for continuous variables and frequency (%) for categorical values.
To compare the older adults’ characteristics according to gender, unpaired t tests and chi-square tests were used for continuous and categorical variables, respectively. In analyses according to age, the subjects were divided into ive groups (60 to 64, 65 to 69, 70 to 74, 75 to 79 and 80 plus years old). For continuous variables, analysis of variance (ANOVA) was used; when statistical diferences were found, Tukey’s post-hoc test was applied. For categorical variables, the chi-square test or Fisher’s exact test was used.
In addition, receiver operating characteristic (ROC) curve analyses were used to ascertain cutof values for ASM and handgrip strength in relation to fear of falling. For this, diferent adjustments of ASM and handgrip strength were used; the curves were then com-pared to investigate statistical diferences among them. he ROC curve compares the true-positive rate (sensitivity) versus the false-positive rate (1 - speciicity) across a range of values, regarding the ability to predict a dichotomous outcome. High sensitivity
corresponds to high negative predictive value, while high speci-icity corresponds to high positive predictive value. Sensitivity and speciicity were used to identify the cutof values for ASM and hand-grip strength in this study.13
he area under the curve (AUC) measures test performance and describes the probability that a test will correctly identify indi-viduals who did or did not have a condition and who were ran-domly selected from the cohort. Generally, the closer the AUC is to 1, the better the overall diagnostic performance of the test will be, and the closer to 0.5 that it is, the poorer the test will be.14,15
Sensitivity, speciicity, positive predictive value (PPV), nega-tive predicnega-tive value (NPV) and likelihood ratios (posinega-tive [LR+] and negative [LR-]) for ASM and handgrip strength in relation to fear of falling were computed. Predictive values describe the probability that a person has a condition once the results of his or her tests are known. LR+ and LR- indicate what the odds are that a disease will increase or decrease when a test is positive or negative, respectively.
Fear of falling was selected as the primary outcome for this study because of its association with psychological and physical issues such as falls, loss of conidence, restriction of activities and social withdrawal, which may lead to dependence and disabil-ity.16,17 Other variables were considered as outcomes, such as falls and walking speed; however, due to the small number of subjects with positive results or missing data, no further analyses were con-ducted. In all analyses, statistical signiicance was set at P < 0.05.
RESULTS
In total, 578 older adults (122 males and 456 females) partici-pated in this study. hese individuals presented diversity of race, ethnicity and geographic area of origin, and a range of health and functional states. heir characteristics are shown descriptively in
Table 1. he mean age was 70.0 ± 6.7 years for males and 69.4 ± 6.6 for females. Women had lower strength and were more over-weight than men. Moreover, more women experienced a fall event during the year prior to this investigation (women 25.3% and men 14.4%) and reported fear of falling (women 65.7% and men 43.7%). Regarding physical function, women had slow walking speed than men (Table 1).
Table 1. Participants’ characteristics
Variables Older adults (n = 578) P
Male (n = 122) Female (n = 456)
Age (years) 70.5 ± 6.7 69.4 ± 6.6 0.11
Handgrip strength (kgf ) 37.4 ± 8.1 24.2 ± 4.8 < 0.001
Relative handgrip strength (adjusted for body mass index) 1.4 ± 0.3 0.8 ± 0.2 < 0.001
Body mass index (kg/m2) 26.8 ± 3.5 28.3 ± 4.9 < 0.001
Fat percentage (%) 26.2 ± 6.1 41.1 ± 6.8 < 0.001
Total skeletal muscle mass (kg) 51.4 ± 6.7 36.2 ± 3.3 < 0.001
Skeletal muscle mass
(adjusted for body mass index) 1.94 ± 0.2 1.31 ± 0.1 < 0.001
Skeletal muscle mass (kg/m2) (adjusted for height squared) 18.4 ± 1.4 15.3 ± 0.8 < 0.001 Skeletal muscle mass
(adjusted for weight) 0.7 ± 0.05 0.5 ± 0.06 < 0.001
Total appendicular skeletal muscle (kg) 25.2 ± 4.0 16.4 ± 1.8 < 0.001
Appendicular skeletal muscle
(adjusted for body mass index) 0.95 ± 0.1 0.59 ± 0.08 < 0.001
Appendicular skeletal muscle (kg/m2) (adjusted for height squared) 9.04 ± 1.0 6.9 ± 0.6 < 0.001 Appendicular skeletal muscle (adjusted for weight) 0.34 ± 0.03 0.25 ± 0.02 < 0.001
Falls during the year prior to study 17 (14.4) 113 (25.3) 0.01
Fear of falling 52 (43.7) 291 (65.7) < 0.001
Waist circumference (cm) 97.5 ± 9.6 95.2 ± 11 0.03
Hip circumference (cm) 100.6 ± 6.3 103.5 ± 9.8 < 0.001
Timed Up and Go (s) 7.6 ± 2.6 8 ± 2.4 0.14
Usual walking speed (m/s) 1.3 ± 0.3 1.2 ± 0.2 0.03
Slow walking speed (using cutof < 0.8 m/s) 6 (5.0) 17 (3.8) 0.56
Slow walking speed (using cutof < 1.0 m/s) 18 (14.9) 62 (13.8) 0.77
Values are mean ± standard deviation or n (%).
Table 2. Characteristics of older men (n = 122) according to age
Variables 60~64 (n = 25) 65~69 (n = 35) 70~74 (n = 27) 75~79 (n = 24) 80+ (n = 11) P
Falls during the year prior to study 3 (12.5) 5 (14.7) 3 (11.1) 3 (13.0) 3 (30.0) 0.69
Fear of falling 8 (32.0) 13 (38.2) 8 (30.8) 15 (65.2) 8 (72.7) 0.02
Waist circumference (cm) 99.9 ± 8.3 95.4 ± 8.1 99.6 ± 9.7 97.6 ± 11.3 93.4 ± 11.3 0.16 Hip circumference (cm) 102.3 ± 6 100.2 ± 4.6 100.8 ± 6.3 101.0 ± 7.4 96.4 ± 8.8 0.16 Handgrip strength (kgf ) 40.4 ± 8.3 39.3 ± 6.5 37.7 ± 8.7 35.6 ± 6.8 28.6 ± 6.9ǂ < 0.001 Relative handgrip strength
(adjusted for body mass index) 1.4 ± 0.2 1.4 ± 0.3 1.4 ± 0.4 1.3 ± 0.2 1.2 ± 0.2 0.13 Usual walking speed (m/s) 1.4 ± 0.2 1.4 ± 0.2 1.3 ± 0.3 1.2 ± 0.3† 1.0 ± 0.3ǂ† < 0.001 Slow walking speed (using cutof < 0.8 m/s) -- -- 1 (3.7) 3 (12.5) 2 (18.2) 0.01 Slow walking speed (using cutof < 1.0 m/s) 1 (4) 1 (2.9) 5 (18.5) 5 (20.8) 6 (54.5) < 0.001 Timed Up and Go (s) 7 ± 1.8 6.6 ± 1.6 7.5 ± 2.10 8.8 ± 3.9† 10 ± 2.4ǂ† < 0.001 Fat percentage (%) 27.5 ± 5.3 25.2 ± 5.9 26.7 ± 6.3 27.1 ± 5.3 22.3 ± 8.9 0.16 Body mass index (kg/m2) 27.8 ± 3.3 26.5 ± 3.2 27.1 ± 3.5 26.9 ± 3.8 23.4 ± 3.1ǂ 0.03
Total skeletal muscle mass (kg) 54.4 ± 6.8 52.4 ± 4.4 50.4 ± 6.5 50.8 ± 7.8 44.0 ± 5.7ǂ 0.001
Skeletal muscle mass
(adjusted for body mass index) 1.9 ± 0.2 1.9 ± 0.2 1.9 ± 0.2 1.9 ± 0.2 1.8 ± 0.2 0.51 Skeletal muscle mass (kg/m2)
(adjusted for height squared) 18.9 ± 1.2 18.5 ± 1.5 18.4 ± 1.1 18.4 ± 1.5 17.1 ± 1.7
ǂ 0.03
Skeletal muscle mass (adjusted for weight) 0.6 ± 0.05 0.7 ± 0.05 0.7 ± 0.05 0.6 ± 0.05 0.7 ± 0.08 0.22 Total appendicular skeletal muscle (kg) 26.3 ± 3.9 25.7 ± 2.8 26.6 ± 4.1 25.3 ± 5.0 21.6 ± 3.7ǂ 0.03
Appendicular skeletal muscle
(adjusted for body mass index) 0.9 ± 0.1 0.9 ± 0.1 0.9 ± 0.1 0.9 ± 0.1 0.9 ± 0.1 0.70 Appendicular skeletal muscle (kg/m2)
the TUG tests, function also decreased as age increased; a simi-lar trend was observed regarding BMI, but not regarding fat per-centage (Table 2).
It was evident that older women had slower walking speed and TUG, and lower muscle strength than younger women, as shown by both absolute and relative handgrip strength. Fat per-centage, BMI and skeletal muscle (total and adjusted accord-ing to BMI, height squared and weight) also decreased with increasing age. Regarding ASM, only the total value and the value adjusted according to height squared failed to show sta-tistical diferences (Table 3).
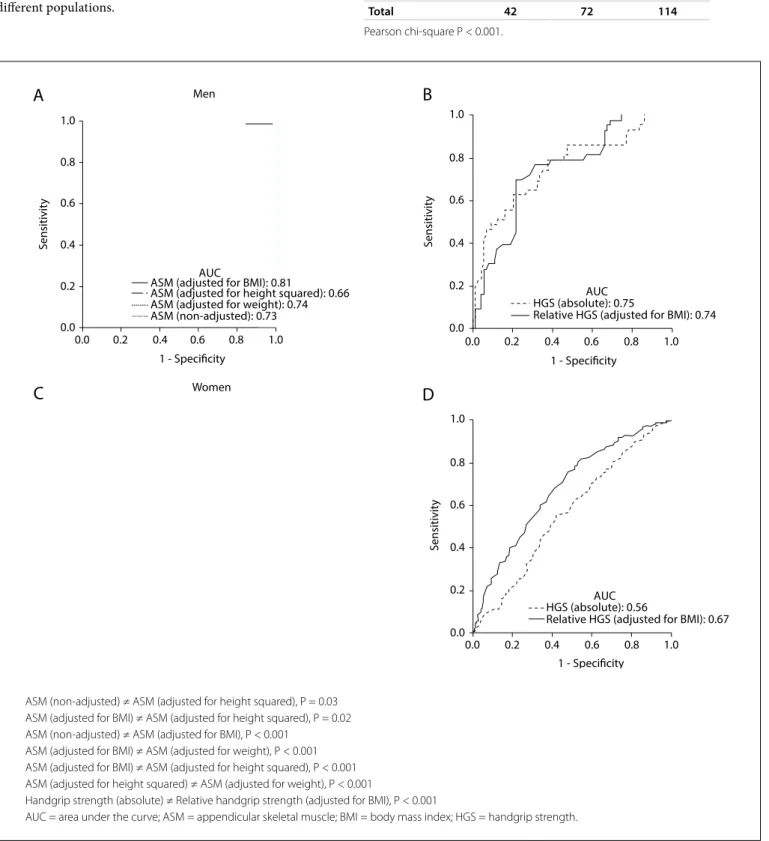
he ROC curves and comparisons among them are presented in Figure 1. Regarding ASM, the adjustment according to BMI showed the best AUC in relation to fear of falling. Cutof values were identiied both for men and for women. For men, as shown in Table 4, the cutof was 0.85 (AUC = 0.81; 95% conidence inter-val, CI = 0.73-0.89; P < 0.001). Table 5 shows the accuracy data for ASM for men and Table 6 for women. For women (Table 7), the cutof was 0.53 (AUC = 0.76; 95% CI = 0.71-0.81; P < 0.001).
Concerning handgrip strength, absolute values showed slight better AUC than did relative values among the men, while rela-tive handgrip strength showed better AUC among the women. herefore, we present cutof values for both absolute and relative
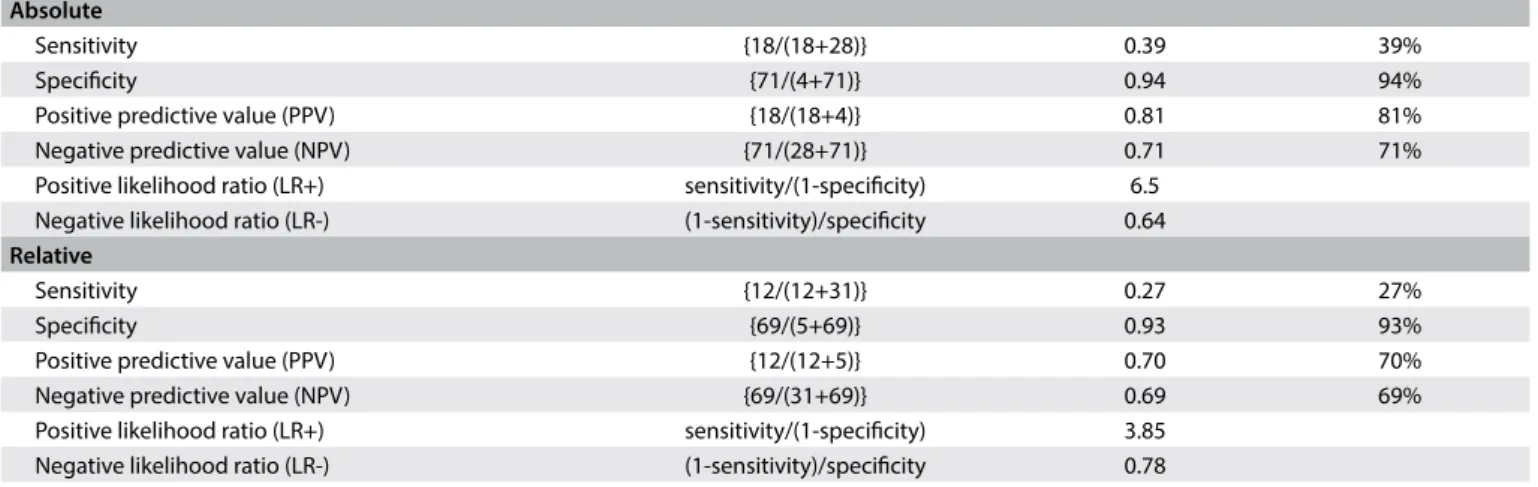
values: for men, as shown in Table 8, the cutof for absolute handgrip strength was 30.0 kgf (AUC = 0.75; 95% CI = 0.66-0.84; P < 0.001).
Table 9 shows the accuracy values for HGS for men, such as sen-sitivity, and Table 10 shows these values for women. he cut-of for women was 21.7 kgf (AUC = 0.56; 95% CI = 0.51-0.62; P = 0.02), as shown in Table 11. he cutofs for relative handgrip strength were 1.07 (AUC = 0.74; 95% CI = 0.65-0.83; P < 0.001).
DISCUSSION
his study presented reference values for strength, physical func-tion tests, body composifunc-tion, anthropometric measurements, falls and fear of falling according to age from a community-based cohort of older men and women aged 60 years and over. Moreover, cutof values for ASM and handgrip strength, which are useful for ascertaining the existence of sarcopenia in older adults, were also presented in relation to fear of falling.
As extensively reported in the literature, diferences according to gender concerning ASM, strength and body composition were observed, as well as decline in physical function with increasing age among older adults. he tests used in this study have clinical relevance, and reference values of this nature are scarce in the Brazilian literature, which increases the external validity of this study. Even though some of these values were similar to those
Table 3. Characteristics of older women (n = 455) according to age
Variables 60~64 (n = 127) 65~69 (n = 123) 70~74 (n = 102) 75~79 (n = 68) 80+ (n = 35) P
Falls during the year prior to study 25 (20.2) 30 (25.0) 27 (27.0) 21 (31.3) 9 (26.5) 0.52
Fear of falling 75 (60.5) 73 (60.8) 69 (69.7) 49 (73.1) 24 (75) 0.06
Waist circumference (cm) 95.7 ± 10.9 94.9 ± 10.1 97.2 ± 12.1 92.7 ± 10.8 93.3 ± 10.2 0.07 Hip circumference (cm) 104.7 ± 9 102.7 ± 8.9 105.2 ± 11.7 101.7 ± 9.9 100.7 ± 7.3 0.03 Handgrip strength (kgf ) 25.5 ± 5 25.1 ± 4.5 24.5 ± 4.4 21.5 ± 3.8ǂ†‖ 20.9 ± 4.7ǂ†‖ < 0.001
Relative handgrip strength
(adjusted for body mass index) 0.8 ± 0.2 0.9 ± 0.2 0.8 ± 0.2 0.8 ± 0.1
† 0.8 ± 0.2 0.01
Usual walking speed (m/s) 1.3 ± 0.2 1.3 ± 0.2 1.2 ± 0.2ǂ 1.2 ± 0.3ǂ† 1 ± 0.3ǂ†‖‡ < 0.001 Slow walking speed (using cutof < 0.8 m/s) -- 3 (2.5) 1 (1.0) 7 (10.4) 6 (17.6) < 0.001 Slow walking speed (using cutof < 1.0 m/s) 8 (6.5) 11 (9.2) 13 (12.7) 15 (22.4) 15 (44.1) < 0.001 Timed Up and Go (s) 7.0 ± 1.4 7.5 ± 1.9 8.2 ± 2.1ǂ 9.0 ± 2.9ǂ† 11.0 ± 3.8ǂ†‖‡ < 0.001 Fat percentage (%) 42.0 ± 6.1 40.9 ± 6.5 42.6 ± 6.7 39.4 ± 6.9‖ 37.3 ± 8.2ǂ†‖ < 0.001
Body mass index (kg/m2) 29.2 ± 5.5 28.1 ± 4.2 29.1 ± 4.9 27.0 ± 4.3ǂ‖ 25.9 ± 4.1ǂ‖ < 0.001
Total skeletal muscle mass (kg) 36.9 ± 3.2 36.5 ± 3.2 35.9 ± 3.3 35.2 ± 3.4ǂ 34.9 ± 3.7ǂ 0.001 Skeletal muscle mass
(adjusted for body mass index) 1.3 ± 0.2 1.3 ± 0.1 1.2 ± 0.1 1.3 ± 0.1 1.3 ± 0.2
‖ 0.008
Skeletal muscle mass (kg/m2)
(adjusted for height squared) 15.4 ± 0.8 15.3 ± 0.8 15.4 ± 0.7 15.1 ± 0.6 14.9 ± 0.8
ǂ‖ 0.009
Skeletal muscle mass (adjusted for weight) 0.5 ± 0.05 0.5 ± 0.06 0.5 ± 0.05 0.5 ± 0.06ǂ‖ 0.5 ± 0.07ǂ†‡ < 0.001 Total appendicular skeletal muscle (kg) 16.4 ± 1.7 16.6 ± 1.8 16.4 ± 1.8 16.1 ± 2.0 16.3 ± 2.1 0.62 Appendicular skeletal muscle
(adjusted for body mass index) 0.5 ± 0.07 0.5 ± 0.07 0.5 ± 0.07 0.6 ± 0.08
ǂ 0.6 ± 0.09ǂ‖ < 0.001
Appendicular skeletal muscle (kg/m2)
(adjusted for height squared) 6.8 ± 0.6 6.9 ± 0.6 7.1 ± 0.6 6.9 ± 0.6 7.0 ± 0.7 0.15 Appendicular skeletal muscle
(adjusted for weight) 0.2 ± 0.02 0.2 ± 0.02 0.2 ± 0.02 0.2 ± 0.03
ǂ‖ 0.2 ± 0.03ǂ†‖ < 0.001
found in other populations, local values are preferable when available, given that regional characteristics can alter results and comparisons. hese data may be useful for clinicians who need reference values to make comparisons with observed per-formance within clinical practice and research, and to compare diferent populations.
Table 4. Appendicular skeletal muscle (ASM) adjusted for body mass index (BMI), in relation to fear of falling among men
Fear of falling
Total
Present Absent
ASM (BMI) < 0.85 14 5 19
ASM (BMI) > 0.85 28 67 95
Total 42 72 114
Pearson chi-square P < 0.001.
ASM (non-adjusted) ≠ ASM (adjusted for height squared), P = 0.03 ASM (adjusted for BMI) ≠ ASM (adjusted for height squared), P = 0.02 ASM (non-adjusted) ≠ ASM (adjusted for BMI), P < 0.001
ASM (adjusted for BMI) ≠ ASM (adjusted for weight), P < 0.001 ASM (adjusted for BMI) ≠ ASM (adjusted for height squared), P < 0.001 ASM (adjusted for height squared) ≠ ASM (adjusted for weight), P < 0.001
Handgrip strength (absolute) ≠ Relative handgrip strength (adjusted for BMI), P < 0.001
AUC = area under the curve; ASM = appendicular skeletal muscle; BMI = body mass index; HGS = handgrip strength.
Figure 1. Receiver operating characteristic curves for appendicular skeletal muscle with diferent adjustments and for handgrip strength (absolute value and adjusted for body mass index). Fear of falling was used as the outcome variable. Data on men (A-B) and women (C-D) are presented. Statistical diferences among or between curves are presented, as applicable.
A
MenS
ensitivit
y
1 - Specificity 1.0
1.0 0.8
0.8 0.6
0.6 0.4
0.4 0.2
0.2 0.0
0.0
AUC
ASM (adjusted for BMI): 0.81
ASM (adjusted for height squared): 0.66 ASM (adjusted for weight): 0.74 ASM (non-adjusted): 0.73
B
S
ensitivit
y
1.0
0.8
0.6
0.4
0.2
0.0
1 - Specificity
1.0 0.8 0.6 0.4 0.2 0.0
AUC HGS (absolute): 0.75
Relative HGS (adjusted for BMI): 0.74
C
WomenD
S
ensitivit
y
1.0
0.8
0.6
0.4
0.2
0.0
1 - Specificity
1.0 0.8 0.6 0.4 0.2 0.0
AUC HGS (absolute): 0.56
Table 5. Accuracy of appendicular skeletal muscle (ASM) for prediction of fear of falling among men
Sensitivity {14/(14+28)} 0.33 33%
Speciicity {67/(5+67)} 0.93 93%
Positive predictive value (PPV) {14/(14+5)} 0.73 73% Negative predictive value (NPV) {67/(28+67)} 0.70 70%
Positive likelihood ratio (LR+) sensitivity/ (1-speciicity) 4.71
Negative likelihood ratio (LR-) (1-sensitivity)/ speciicity 0.72
Table 6. Accuracy of relative appendicular skeletal muscle (ASM) for prediction of fear of falling among women
Sensitivity {84/(84+194)} 0.30 30% Speciicity {140/(12+140)} 0.92 92% Positive predictive value (PPV) {84/(84+12)} 0.87 87%
Negative predictive value (NPV) {140/
(194+140)} 0.41 41%
Positive likelihood ratio (LR+) sensitivity/ (1-speciicity) 3.75
Negative likelihood ratio (LR-) (1-sensitivity)/ speciicity 0.76
Table 7. Appendicular skeletal muscle adjusted (ASM) for body mass index (BMI), in relation to fear of falling among women
Fear of falling
Total
Present Absent
ASM (BMI) < 0.53 84 12 96
ASM (BMI) > 0.53 194 140 334
Total 278 152 430
Pearson chi-square P < 0.001.
Table 8. Absolute* and relative† handgrip strength (HGS) in relation to
fear of falling among men
Fear of falling
Total
Present Absent
Absolute HGS < 30 kgf 18 4 22
Absolute HGS > 30 kgf 28 71 99
Total 46 75 121
Relative HGS (BMI) < 1.07 12 5 17
HGS (BMI) > 1.07 31 69 100
Total 43 74 117
*Pearson chi-square P < 0.001; †Pearson chi-square P = 0.002.
Table 9. Accuracy of absolute and relative handgrip strength (HGS) for prediction of fear of falling among men Absolute
Sensitivity {18/(18+28)} 0.39 39%
Speciicity {71/(4+71)} 0.94 94%
Positive predictive value (PPV) {18/(18+4)} 0.81 81%
Negative predictive value (NPV) {71/(28+71)} 0.71 71%
Positive likelihood ratio (LR+) sensitivity/(1-speciicity) 6.5 Negative likelihood ratio (LR-) (1-sensitivity)/speciicity 0.64
Relative
Sensitivity {12/(12+31)} 0.27 27%
Speciicity {69/(5+69)} 0.93 93%
Positive predictive value (PPV) {12/(12+5)} 0.70 70%
Negative predictive value (NPV) {69/(31+69)} 0.69 69%
Positive likelihood ratio (LR+) sensitivity/(1-speciicity) 3.85 Negative likelihood ratio (LR-) (1-sensitivity)/speciicity 0.78
Table 10. Accuracy of absolute and relative handgrip strength (HGS) for prediction of fear of falling among women Absolute
Sensitivity {87/(87+204)} 0.29 29%
Speciicity {115/(42+115)} 0.73 73%
Positive predictive value (PPV) {87/(87+42)} 0.67 67%
Negative predictive value (NPV) {115/(204+115)} 0.36 36%
Positive likelihood ratio (LR+) sensitivity/(1-speciicity) 1.07 Negative likelihood ratio (LR-) (1-sensitivity)/speciicity 0.97
Relative
Sensitivity {65/(65+218)} 0.22 22%
Speciicity {141/(14+141)} 0.90 90%
Positive predictive value (PPV) {65/(65+14)} 0.82 82%
Negative predictive value (NPV) {141/(218+141)} 0.39 39%
he evidence from this study highlights the imminent haz-ard that surrounds the oldest age group (80 years and over). hese individuals showed the highest fear of falling, which may have impacted on their physical performance, which was the worst among the groups. It is diicult to predict when this cas-cade efect will begin, but it is crucial to implement interventions addressing physical and psychosocial issues, in order to face up to these conditions and thus promote health.
he values for handgrip strength that we found here were simi-lar to those shown by Yoshimura et al.18 However, the subjects in their study performed better regarding walking speed. Importantly, in their study, the subjects were categorized into decades of age and walking speed was measured along a 6-m path.
he Asian Working Group for Sarcopenia (AWGS) recom-mended using the lowest 20th percentile of handgrip strength of the study population as the cutof value for low strength, due to the lack of outcome-based cutof values. hus, they suggested values of < 26 kgf for men and < 18 kgf for women.2 Similarly, the European Working Group on Sarcopenia in Older People (EWGSOP) sug-gested < 30 kgf for men and < 20 kgf for women as cutof val-ues.3 In our study, we found cutofs of 30 kgf for Brazilian men and 21.7 kgf for Brazilian women, for absolute handgrip strength values. Although we were unable to contribute cutof values for walking speed among Brazilian older adults at this time, both of these previous studies (AWGS and EWGSOP) recommended use of < 0.8 m/s as the cutof for slow walking performance.2,3
Concerns have been raised regarding the inluence of body mass on the relationships between performance, strength and muscle mass. hese were raised especially by the Foundation for the National Institutes of Health (FNIH Sarcopenia Project), a large sample study that used multiple existing data sources to identify criteria for clinically relevant weakness and low lean mass.5,19,20 herefore, we performed several analyses to clarify the need to adjust handgrip strength and muscle mass for body mass. hrough this, we found cutofs for relative handgrip strength adjusted for BMI of 1.07 for men and 0.66 for women. he deinitions for weakness suggested from the FNIH Sarcopenia Project were ratios < 1.0 for
men and < 0.56 for women.20 he necessity for this adjustment will be further discussed below.
Regarding the TUG, Bohannon (2006) conducted a descrip-tive meta-analysis and found mean values according to age (60 to 69, 70 to 79 and 80 to 99 years) of 8.1 seconds (95% CI = 7.1-9.0), 9.2 seconds (95% CI = 8.2-10.2) and 11.3 seconds (95% CI = 10.0-12.7), respectively.11 Individuals whose performance was outside the limits of these conidence intervals could be considered to have worse-than-average performance. hese values were within the range that we found in our study. Furthermore, considering healthy Japanese individuals aged 60 years and over, Kamide et al. found that the weighted mean for TUG with maximum efort was 6.60 seconds (95% CI = 6.18-7.02) and that at the usual pace it was 8.86 seconds (95% CI = 7.99-9.72).21 his was certainly faster than has been found in other populations.
he data of our study showed through speciic tests that physi-cal performance declined for both genders as age increased, but that the changes in skeletal muscle depended on the adjustment applied. he ASM cutof values (adjusted for BMI) that were identiied among older adults according to gender were 0.85 for men and 0.53 for women. Interestingly, the values proposed by the FNIH Sarcopenia Project were 0.789 and 0.512, for men and women, respectively.5 We also found that adjustments for BMI were the best approach in relation to both genders. herefore, we suggest that these cutofs should be used to screen older adults of both sexes for higher risk of disability, in relation to fear of falling. hese values provide a more realistic approach towards Brazilian older individuals.
Because of the adjustments to the data that we implemented, our results are not directly comparable with other proposed deini-tions for low ASM or sarcopenia. Initially, both the EWGSOP and AWGS groups suggested the approach of using –2 SD of ASM in young individuals as a cutof point for muscle mass.2,3 However, low muscle mass alone is not consistently associated with adverse health outcomes,5 which thus poses the challenge of implementing new approaches. Hence, the methodology adopted in our study limited our ability to make comparisons, but it stimulates other research-ers to provide more suitable and comparable data.
Considering the role of body mass, it difered according to gender. In men, the AUC was slightly smaller for relative than for absolute handgrip strength. However, in women, relative handgrip strength showed better results. Interestingly, Alley et al. reported a similar inding.19 In our study, this was seen despite our small sample size in the men’s group and with a diferent outcome-based variable. It remains unclear why this occurred. BMI would be more important for women than for men.
To our knowledge, this was the irst study to provide refer-ence data and cutof values adjusted according to body mass, for Brazilian older adults. We expect that these data will be useful both for clinicians within their practice and for researchers, who Table 11. Absolute* and relative† handgrip strength (HGS) in
relation to fear of falling among women Fear of falling
Total
Present Absent
Absolute HGS < 21.7 kgf 87 42 129
Absolute HGS > 21.7 kgf 204 115 319
Total 291 157 448
Relative HGS (BMI) < 0.66 kgf 65 14 79
Relative HGS (BMI) > 0.66 kgf 218 141 359
Total 283 155 438
will now be able to use Brazilian data regarding physical function and muscle mass in older adults.
We provided several adjustments to the data, but for consis-tency, we encourage researchers to use ASM adjusted for BMI and, according to convenience, to choose between absolute and relative handgrip strength adjusted for BMI, for both men and women, or even diferent types of indicators for each gender. For walking speed, a cutof value < 0.8 m/s, as previously suggested,2,3,5 can be applied within both research and clinical practice to identify mobility impairment. Values for physical function tests and other variables can be used as references, according to age categories, as we presented in this study.
he limitations of this study included: (i) its cross-sectional design, which did not allow determination of a cause-efect rela-tionship between the variables; (ii) the small number of older male subjects; (iii) the retrospective nature of the data on occurrences of falls, which may have been biased; and (iv) the use of fear of fall-ing, and no other disability condition or mortality, as the outcome. Longitudinal analyses are preferable over cross-sectional designs and are appropriate for establishing clinical diagnostic cutof val-ues.5 Moreover, even though mortality or other disability outcomes seem more representative for sarcopenia, fear of falling was highly associated with sarcopenia among older adults,22 as previously veri-ied, thus justifying its use as an outcome. We suggest that future studies should recruit larger numbers of male subjects and use diferent sampling ields and alternative methods for investigat-ing body composition, such as dual-energy x-ray absorptiometry. In addition, longitudinal studies using disability or mortality as an outcome are necessary in order to determine optimal cutofs for ASM, handgrip strength and walking speed.
In summary, we identiied age-related decline in physical func-tion and changes in body composifunc-tion and anthropometric measure-ments. Moreover, cutof values for handgrip strength (absolute: men < 30 kgf; women < 21.7 kgf; and relative: men < 1.07; women < 0.66) and for ASM (ASM adjusted for BMI: men < 0.85; women < 0.53), in relation to fear of falling among Brazilian older adults were also provided. Further analyses also suggested that adjustment for BMI may inluence how the data can be interpreted. he cutof value for walking speed was established as < 0.8 m/s, as previously recom-mended. In future studies, we intend to evaluate the capacity of these cutof values to identify individuals who are in a vulnerable condi-tion, especially regarding low quality of life and frailty.
CONCLUSION
he values for physical function tests and other variables, pre-sented according to age groups, highlight the hazards that sur-round the most elderly individuals. hese data are useful references both for clinicians within practice and for researchers. Moreover, ASM adjusted for BMI was the best approach, while adjustment of
handgrip strength varied according to gender. We recommend use of ASM adjusted for BMI and to choose either absolute handgrip strength or relative handgrip strength (adjusted for BMI), for both men and women, according to study needs.
REFERENCES
1. Diz JB, Leopoldino AA, Moreira BS, et al. Prevalence of sarcopenia in older Brazilian: A systematic review and meta-analysis. Geriatr Gerontol Int. 2017;17(1):5-16.
2. Chen LK, Liu LK, Woo J, et al. Sarcopenia in Asia: consensus report of the Asian Working Group for Sarcopenia. J Am Med Dir Assoc. 2014;15(2):95-101.
3. Cruz-Jentoft AJ, Baeyens JP, Bauer JM, et al. Sarcopenia: European consensus on deinition and diagnosis: Report of the European Working Group on Sarcopenia in Older People. Age Ageing. 2010;39(4):412-23. 4. Morley JE, Abbatecola AM, Argiles JM, et al. Sarcopenia with
limited mobility: an international consensus. J Am Med Dir Assoc. 2011;12(6):403-9.
5. Studenski SA, Peters KW, Alley DE, et al. The FNIH sarcopenia project: rationale, study description, conference recommendations, and inal estimates. J Gerontol A Biol Sci Med Sci. 2014;69(5):547-58.
6. Goodpaster BH, Park SW, Harris TB, et al. The loss of skeletal muscle strength, mass, and quality in older adults: the health, aging and body composition study. J Gerontol A Biol Sci Med Sci. 2006;61(10):1059-64. 7. Auyeung TW, Lee SW, Leung J, Kwok T, Woo J. Age-associated decline of muscle mass, grip strength and gait speed: a 4-year longitudinal study of 3018 community-dwelling older Chinese. Geriatr Gerontol Int. 2014;14 Suppl 1:76-84.
8. Morley JE, Cao L. Rapid screening for sarcopenia. J Cachexia Sarcopenia Muscle. 2015;6(4):312-4.
9. Pietrobelli A, Rubiano F, St-Onge MP, Heymsield SB. New bioimpedance analysis system: improved phenotyping with whole-body analysis. Eur J Clin Nutr. 2004;58(11):1479-84.
10. Sampaio RAC, Sampaio PYS, Uchida MC, et al. Walking speed and balance performance are associated with Short-Form 8 bodily pain domain in Brazilian older female. Journal of Clinical Gerontology and Geriatrics. 2015;6(3):89-94. Available from: http://ac.els-cdn. com/S2210833515000386/1-s2.0-S2210833515000386-main.pdf?_ tid=e5de31d4-6802-11e7-8081-00000aacb35e&acdnat=1499974911_ af90c39c22b1984ad6c23dc113377d72. Accessed in 2017 (Jul 13). 11. Bohannon RW. Reference values for the timed up and go test: a
descriptive meta-analysis. J Geriatr Phys Ther. 2006;29(2):64-8. 12. Trampisch US, Franke J, Jedamzik N, Hinrichs T, Platen P. Optimal
Jamar dynamometer handle position to assess maximal isometric hand grip strength in epidemiological studies. J Hand Surg Am. 2012;37(11):2368-73.
14. Akobeng AK. Understanding diagnostic tests 1: sensitivity, speciicity and predictive values. Acta Paediatr. 2007;96(3):338-41.
15. Akobeng AK. Understanding diagnostic tests 3: Receiver operating characteristic curves. Acta Paediatr. 2007;96(5):644-7.
16. Denkinger MD, Lukas A, Nikolaus T, Hauer K. Factors associated with fear of falling and associated activity restriction in community-dwelling older adults: a systematic review. Am J Geriatr Psychiatry. 2015;23(1):73-86. 17. Trombetti A, Reid KF, Hars M, et al. Age-associated declines in muscle
mass, strength, power, and physical performance: impact on fear of falling and quality of life. Osteoporos Int. 2016;27(2):463-71. 18. Yoshimura N, Oka H, Muraki S, et al. Reference values for hand grip
strength, muscle mass, walking time, and one-leg standing as indices for locomotive syndrome and associated disability: the second survey of the ROAD study. J Orthop Sci. 2011;16(6):768-77.
19. Alley DE, Shardell MD, Peters KW, et al. Grip strength cutpoints for the identiication of clinically relevant weakness. J Gerontol A Biol Sci Med Sci. 2014;69(5):559-66.
20. Cawthon PM, Peters KW, Shardell MD, et al. Cutpoints for low appendicular lean mass that identify older adults with clinically signiicant weakness. J Gerontol A Biol Sci Med Sci. 2014;69(5):567-75. 21. Kamide N, Takahashi K, Shiba Y. Reference values for the Timed Up and Go test in healthy Japanese elderly people: determination using the methodology of meta-analysis. Geriatr Gerontol Int. 2011;11(4):445-51. 22. Yamada M, Nishiguchi S, Fukutani N, et al. Prevalence of sarcopenia
in community-dwelling Japanese older adults. J Am Med Dir Assoc. 2013;14(12):911-5.
Conlict of interest: None
Sources of funding: Sampaio, RAC had a scholarship from Coordenação
de Aperfeiçoamento de Pessoal de Nível Superior (CAPES), process #01P04373/2015
Date of irst submission: February 14, 2017
Last received: April 23, 2017
Accepted: May 3, 2017
Address for correspondence:
Ricardo Aurélio Carvalho Sampaio
Laboratório de Cinesiologia Aplicada, Faculdade de Educação Física, Universidade Estadual de Campinas (UNICAMP)