ABSTRACT:Objective: To describe the prevalence of guidance on healthy habits received from health professionals by elderly and its relation to socioeconomic demographic, behavioral and health indicators, and the type of services. Methods: Cross sectional population based study including individuals aged 60 years or more in the urban area of Pelotas, Rio Grande do Sul, Brazil. Seven guidance on healthy habits were evaluated: weight control, reduction in salt, sugar and fat intake, physical activity practice, not smoking and not drinking alcohol. Results: Among the 1,451 elderly interviewed, 1,281 (88.3%) consulted in the last year. The orientations more refereed were to fat (61.7%) and salt (61.5%) intake reduction and physical activity (58.2%). Elderly who consulted three times or more and in services inanced by the Uniied Health System received more guidance. Those elderly from the socioeconomic classes A/B were more likely to receive guidance for weight control (RP = 1.27; 95%CI 1.06 – 1.70) and physical activity (RP = 1.34; 95%CI 1.06 – 1.69). Conclusion: The orientation from health professionals were uncommon and, in some cases, unfocused.
Keywords: Orientation. Health promotion. Life style. Healthy behavior. Aged. Epidemiology.
Healthy habits: what kind of guidance
the elderly population is receiving
from health professionals?
Hábitos saudáveis: que tipo de orientação a população
idosa está recebendo dos proissionais de saúde?
Thaynã Ramos FloresI, Bruno Pereira NunesI, Maria Cecília Formoso AssunçãoI, Andréa Dâmaso BertoldiI
IGraduate Program in Epidemiology, Universidade Federal de Pelotas – Pelotas (RS), Brazil.
Corresponding author: Thaynã Ramos Flores. Rua Marechal Deodoro, 1160, 3º piso, Centro, CEP: 96020‑220, Caixa Postal 464,
Pelotas (RS), Brasil. E‑mail: [email protected]
Conlict of interests: nothing to declare – Financial support: Academic Excellence Program (Programa de Excelência Acadêmica – PROEX) if Higher Education Personnel Improvement Coordination (Coordenação de Aperfeiçoamento de Pessoal de Nível Superior – CAPES), under the process number PROEX – 1107/2013/Process No. 23038.003968/2013‑99.
INTRODUCTION
The demographic change, which afected the worldwide population, is characterized by a populational aging phenomenon1,2. In Brazil, this process occurred at the same time as the epidemiological transition, adding a major challenge to the health system3, with the need of a greater emphasis and investment in actions of health promotion and prevention1.
The National Policy on Health Promotion (Política Nacional de Promoção da Saúde: PNPS) aims at actions of prevention of diseases and the promotion of health as a fundamental component of the services, mentioning the guidelines across the life cycle2,4. In high-income countries, studies showed an improvement in life habits after the recommendations made by a health professional5-7. Brazil has signiicant social inequalities in health, where indi-viduals with lower economic and education classiication tend to use less health services8, receiving less orientation9,10.
According to the data from the National health Survey of 2013, approximately 90% of the individuals aged 18 years old or older with medical diagnosis of hypertension or diabe-tes mellitus reported receiving guidance on healthy habits. However, this information was not investigated for the population that did not have these noncommunicable chronic dis-eases (NCDs)11.
The guidelines on healthy habits may be related to several means, including the commu-nication ones3. However, actions of promotion and prevention are the role of professionals and must be carried out in all contact of users with the health service2,12,13. Receiving guid-ance on healthy habits by health professionals may be evaluated through observation of medical consultations14, in interviews performed in the health service with the individuals15 and, also, in the report from individuals in household surveys5,6,16,17. This last one has some advantages in relation to the previous ones, in that it prevents the answer of the individuals
to be inluenced by being in the health services—complimentary bias—and it is estimated more precisely if the guidance is understood, in that the comprehension is essential for the actual accomplishment of the recommendations18. Population-based studies on this theme are scarce in Brazil, especially with the elderly population. Most studies investigate the receiv-ing of orientation on healthy habits in populations with some chronic health problem9,14.
Thus, this study has the objective of describing the orientation on healthy habits received from health professionals among elderly and their relation to socioeconomic, demographic, behavioral, and health indicators, and the kind of health services.
METHODS
Cross-sectional study, population based, was carried out with individuals aged 60 years old or older in the urban zone of the municipality of Pelotas, Rio Grande do Sul, in the year 2014. In the last census, conducted by the Brazilian Institute of Geography and Statistics (Instituto Brasileiro de Geograia e Estatística: IBGE)19 in 2010, it was possible to observe that the munic-ipality has 46,099 elderly in the urban areas. The selection of the sample was carried out in two stages, the irst one being the selection of census sections in the city according to IBGE and the second, the systematic selection of the households within each sector. To estimate the prevalences of the outcomes, at least 979 elderly would be necessary. To estimate the associations being studied, 1,493 elderly were needed considering the following parameters: conidence interval of 95% (95%CI); statistical power of 80%; minimum prevalence ratio of 1.2; increases of 10% for losses and refusals, 15% for confounders, and 1.5 for design efect.
All individuals aged 60 years old or older were invited to take part in the research. For the elderly with some problem that would make it impossible to answer to the ques-tionnaire, the answers by the responsible people for them were considered. Institutionalized elderly were not included. Further details on the methodological strategy of “Research Consortium,” used in this study may be found in other publications20. The inal question-naire was answered by the elderly from the sectors that were not drawn, to ensure the clarity of the questions. The interviewers selected were properly trained and standard-ized. The interviews were carried out by netbookswhere the data were registered, and the anthropometric measures were made at the same time. Losses and refusals were con-sidered after three or more attempts in diferent days and shifts. The quality control of the interviews was carried out by the students with Master’s degree in 10% of the sample with a shortened questionnaire.
The outcomes of this study were operationalized through the following question: “Since last year’s <MONTH> until now, has any health professional guided you to...” being replaced by the following guidelines: controlling weight, reducing salt intake, reducing the intake of sugar and sweets, reducing the intake of fats, practicing physical activities, not smoking, and not drinking alcohol1,3,12. These questions were preceded by a ilter question: “Since last
The demographic and socioeconomic variables used were: gender (male and female), age range (60 to 69, 70 to 79 to 80 years old or older), color of the skin observed by the interviewer (white, brown, black, yellow, and red), marital status (married, single, widowed, and divorced), education (none, incomplete elementary school, complete elementary school, high school, and college degree), and economical status (A: the highest and B, C, D, and E)21. The self-reported morbidities (yes/no) — hypertension and diabetes mellitus — the use of continuous medication (yes, no), smoking (never smoked, former smoker, and current smoker), consumption of alcohol within the last 30 days (yes, no), insufficiently active (yes, no), and excess of weight (yes, no) were also used. For the classification of insufficiently active elderly (practice of physical activity <150 minutes/week), the International Physical Activity Questionnaire22 was being used as an overall estimate, considering the physical activity when moving and in lei-sure. Also, there was the measuring of weight and height of the elderly. Because of the common presence of column curvature, height was estimated through the measure of height between knees and heels23, through specific equations for white and black elderly24. For the elderly of other skin colors (4.7% of the sample), the equation for white elderly was used, being possible to obtain an estimate on the real height of all elderly using a child anthropometer by Indaiá®, with a scale of 100 cm, graduated in millimeters. For the measuring of weight, electronic scales by Tanita®, model UM-080, were used with a maximum capacity of 150 kg and the precision of 100 g. The cutoff point for Body Mass Index defined for excess of weight25 was >27 kg/m2.
Also, the following variables regarding the consultations to health services were used: number of consultations (1, 2, and 3, or more), site of the last consultation (Basic Health Unit [Unidade Básica de Saúde: UBS], emergency room, medical oice, outpatient in colleges and hospitals/primary care/polyclinics, unions/companies, and others), and inancing of the last consultation (private, health insurance or Uniied Health System [Sistema Único de Saúde: SUS]). The recall period used was 1 year.
The data were analyzed by the STATA 12.1 software. Initially, description of the outcomes obtaining the prevalences and the respective 95%CI was made. To obtain the prevalences of the outcomes according to the independent variables, the χ2 test of heterogeneity and the χ2 test of linear trend for the ordinal categorical variables were used. We used the Poisson26 regression to obtain the prevalence ratio and their respective 95% CI and p-values in the gross and adjusted analysis between the outcomes and the economic classiication (Associação Brasileira de Empresas de Pesquisa: ABEP). The adjustment included gender, age, color of the skin, marital status, and education. It was considered that the economic clas-siication and education were not collinear (correlation = 0.61). Associations with p-value lower than 0.05 were considered statistically signiicant. All the analyses were carried out using the svy command considering the sample design of the study.
RESULTS
A total of 1,844 elderly eligible for the study were identified. Losses totaled 9.7% (n = 179) and refusals 11.6% (n = 214) totaling 1,451 elderly interviewed. Losses and refusals had lower age mean (69.5 years) than the final sample (70.7 years), p = 0.01. The higher design effect between the outcomes in the study was 1.3 for “instruction to reduce sugar consumption.”
The prevalence of consultation with health professionals, within the last year, was 88.3% (n = 1,281) of the sample used in the present analysis. This sample is similar to the original one (n = 1,451) in relation to the demographic, socioeconomic, behavioral, and health char-acteristics. As for the guidance received, in the context of health services, the most often reported ones were reduction of fat consumption (61.7%; 95% CI 59.0–64.3), reduction of salt consumption (61.5%; 95% CI 58.8–64.2), and for the practice of physical activity (58.2%; 95% CI 55.5–60.9), followed by instruction for the reduction of sugar consumption (49.9%; 95% CI 47.2–52.7), weight control (38.9%; 95% CI 36.3–41.6), not smoking (19.3%; 95% CI 17.1–21.4), and not drinking alcohol (13.4%; 95%CI 11.6–15.3) (Figure 1).
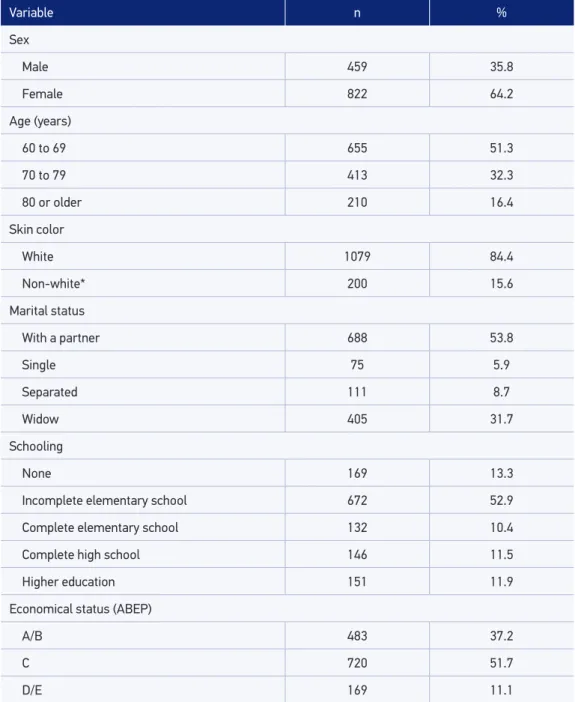
Among the elderly who consulted with health professionals within the last year, most of them were females (64.2%), aged between 60 and 69 years (51.3%), white (84.4%), mar-ried (53.8%), with incomplete elementary school (52.9%), and belonging to economical classiication C (51.7%) (Table 1). Mostly, the orientation on healthy habits was received among women and among elderly aged 60 to 69 years. As for the color of the skin, only the instruction for reduction of salt intake had a statistical diference, with higher prevalence among nonwhite people. No orientation varied according to the marital status. The higher the education and the economic classiication, the greater the prevalence of guidance for weight control and practice of physical education.
Not drinking alcohol Not smoking Practicing physical activities Recuding fats intake Recuding sugar intake Reducing salt intake Controling weight
13.4% 19.3%
58.2% 61.7% 49.9%
61.5% 38.9%
Variable n %
Sex
Male 459 35.8
Female 822 64.2
Age (years)
60 to 69 655 51.3
70 to 79 413 32.3
80 or older 210 16.4
Skin color
White 1079 84.4
Non-white* 200 15.6
Marital status
With a partner 688 53.8
Single 75 5.9
Separated 111 8.7
Widow 405 31.7
Schooling
None 169 13.3
Incomplete elementary school 672 52.9
Complete elementary school 132 10.4
Complete high school 146 11.5
Higher education 151 11.9
Economical status (ABEP)
A/B 483 37.2
C 720 51.7
D/E 169 11.1
Table 1. Description of the sample of elderly people who attended the health services in the past year according to demographic and socioeconomic characteristics. Pelotas, RS, 2014 (n = 1,281).
*Black, brown, yellow and red; ABEP: Associação Brasileira de Empresas de Pesquisa.
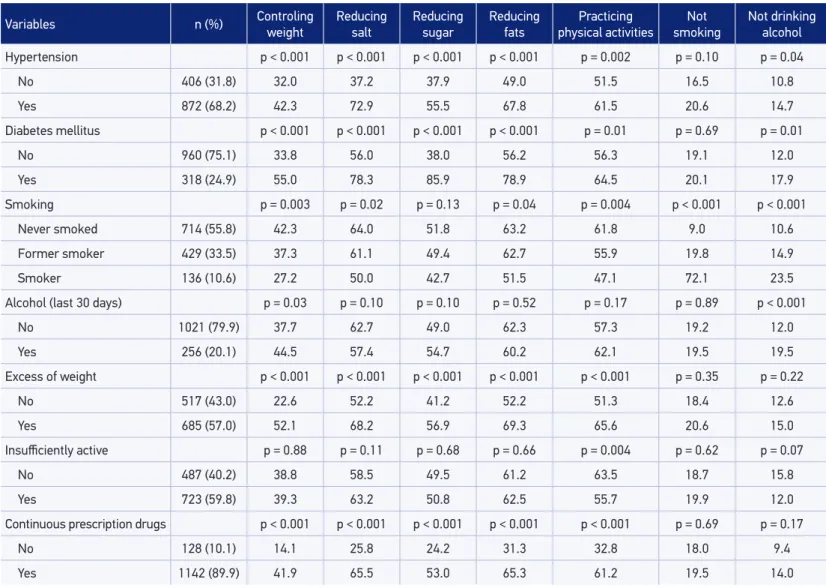
prescription drugs. Hypertensive, diabetic elderly, who never smoked, who had excess of weight, and who continuously used prescription drugs reported receiving more orientation on healthy habits. Among those who had alcoholic drinks within the last 30 days, the greater prevalences of recommendations were for weight control and not drinking alcohol (Table 2).
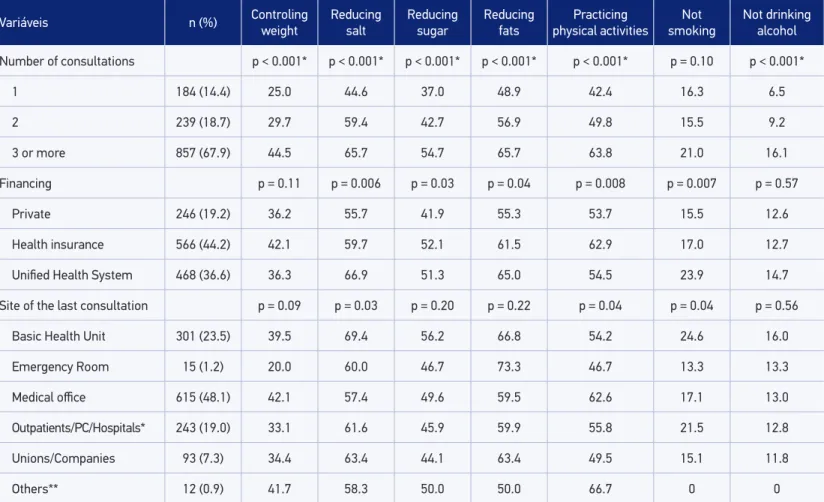
Most of the elderly were consulted more than three times in the year previous to the interview (67.9%), with greater proportion of the consultations being inanced by the health insurances (44.2%) and held in the medical oices (48.1%). The greatest prev-alences of receiving guidance were observed among the elderly who consulted more than three times and in services inanced by SUS. In relation to the site of the last consul-tation, elderly who were consulted in UBS received more instructions for reduction of salt intake and for not smoking. It was observed that the orientation for physical practice was more prevalent among the elderly taken care of by the health insurances and in the medical oices (Table 3).
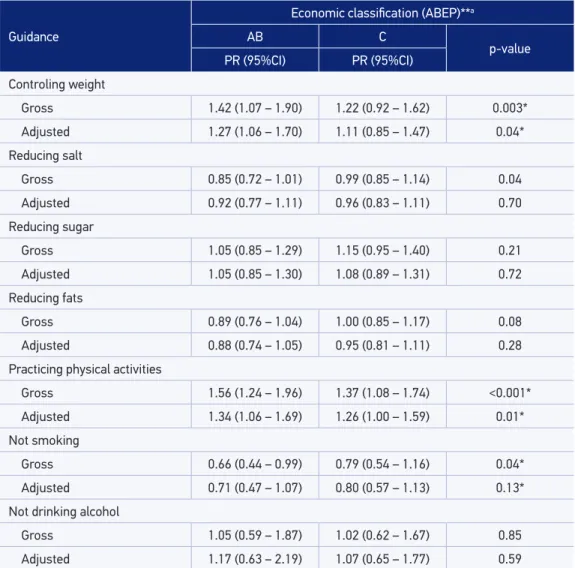
In the gross model, a statistically signiicant association between the economic classii-cation and the orientation for weight control, reduction of salt intake, practice of physical activities, and not to smoke was found. After the adjustment, elderly with economic classi-ication A/B had 27% higher probability of receiving guidance for weight control and 34% higher probability of receiving guidance for the practice of physical activities in comparison to the ones with economic classiication D/E (the poorest ones) (Table 4).
DISCUSSION
The prevalence of orientation received for health habits, performed by health profes-sionals, were lower than 62%. When extrapolating this ratio for the target population, who went through consultations within the last year, about 16,282 elderly in the urban area of the municipality did not receive actions on health promotion and prevention of diseases.
Even considering the most vulnerable groups, the recommendations reached less than 80% of the elderly, with the exception of the instruction for reduction of sugar consumption among diabetic individuals. The prevalence of orientation among hyper-tensive and diabetic patients was lower than most guidances observed in studies carried out in the United States and Canada5,6 and in a nationwide study recently carried out in Brazil11. However, the prevalence of guidance for physical activity practice was higher in a study carried out in areas covered by UBS in Northeastern and Southern Brazil includ-ing adults and elderly16.
The actions for disease prevention and promotion of health, assigned to professionals, must support the adoption of a healthy lifestyle2,12, being a way of integrating the individu-als in the management of their own health15. The ofer of those guidance may bring more quality to the services and reduce diseases related to the lack of health promotion7,12,27.
Variables n (%) Controling weight Reducing salt Reducing sugar Reducing fats physical activitiesPracticing smokingNot Not drinking alcohol
Hypertension p < 0.001 p < 0.001 p < 0.001 p < 0.001 p = 0.002 p = 0.10 p = 0.04
No 406 (31.8) 32.0 37.2 37.9 49.0 51.5 16.5 10.8
Yes 872 (68.2) 42.3 72.9 55.5 67.8 61.5 20.6 14.7
Diabetes mellitus p < 0.001 p < 0.001 p < 0.001 p < 0.001 p = 0.01 p = 0.69 p = 0.01
No 960 (75.1) 33.8 56.0 38.0 56.2 56.3 19.1 12.0
Yes 318 (24.9) 55.0 78.3 85.9 78.9 64.5 20.1 17.9
Smoking p = 0.003 p = 0.02 p = 0.13 p = 0.04 p = 0.004 p < 0.001 p < 0.001
Never smoked 714 (55.8) 42.3 64.0 51.8 63.2 61.8 9.0 10.6
Former smoker 429 (33.5) 37.3 61.1 49.4 62.7 55.9 19.8 14.9
Smoker 136 (10.6) 27.2 50.0 42.7 51.5 47.1 72.1 23.5
Alcohol (last 30 days) p = 0.03 p = 0.10 p = 0.10 p = 0.52 p = 0.17 p = 0.89 p < 0.001
No 1021 (79.9) 37.7 62.7 49.0 62.3 57.3 19.2 12.0
Yes 256 (20.1) 44.5 57.4 54.7 60.2 62.1 19.5 19.5
Excess of weight p < 0.001 p < 0.001 p < 0.001 p < 0.001 p < 0.001 p = 0.35 p = 0.22
No 517 (43.0) 22.6 52.2 41.2 52.2 51.3 18.4 12.6
Yes 685 (57.0) 52.1 68.2 56.9 69.3 65.6 20.6 15.0
Insuiciently active p = 0.88 p = 0.11 p = 0.68 p = 0.66 p = 0.004 p = 0.62 p = 0.07
No 487 (40.2) 38.8 58.5 49.5 61.2 63.5 18.7 15.8
Yes 723 (59.8) 39.3 63.2 50.8 62.5 55.7 19.9 12.0
Continuous prescription drugs p < 0.001 p < 0.001 p < 0.001 p < 0.001 p < 0.001 p = 0.69 p = 0.17
No 128 (10.1) 14.1 25.8 24.2 31.3 32.8 18.0 9.4
Yes 1142 (89.9) 41.9 65.5 53.0 65.3 61.2 19.5 14.0
Table 2. Prevalence of guidance received on healthy habits according to behavioral and health variables. Pelotas, RS, 2014 (n = 1,281).
Variáveis n (%) Controling weight
Reducing salt
Reducing sugar
Reducing fats
Practicing physical activities
Not
smoking Not drinking alcohol
Number of consultations p < 0.001* p < 0.001* p < 0.001* p < 0.001* p < 0.001* p = 0.10 p < 0.001*
1 184 (14.4) 25.0 44.6 37.0 48.9 42.4 16.3 6.5
2 239 (18.7) 29.7 59.4 42.7 56.9 49.8 15.5 9.2
3 or more 857 (67.9) 44.5 65.7 54.7 65.7 63.8 21.0 16.1
Financing p = 0.11 p = 0.006 p = 0.03 p = 0.04 p = 0.008 p = 0.007 p = 0.57
Private 246 (19.2) 36.2 55.7 41.9 55.3 53.7 15.5 12.6
Health insurance 566 (44.2) 42.1 59.7 52.1 61.5 62.9 17.0 12.7
Uniied Health System 468 (36.6) 36.3 66.9 51.3 65.0 54.5 23.9 14.7
Site of the last consultation p = 0.09 p = 0.03 p = 0.20 p = 0.22 p = 0.04 p = 0.04 p = 0.56
Basic Health Unit 301 (23.5) 39.5 69.4 56.2 66.8 54.2 24.6 16.0
Emergency Room 15 (1.2) 20.0 60.0 46.7 73.3 46.7 13.3 13.3
Medical oice 615 (48.1) 42.1 57.4 49.6 59.5 62.6 17.1 13.0
Outpatients/PC/Hospitals* 243 (19.0) 33.1 61.6 45.9 59.9 55.8 21.5 12.8
Unions/Companies 93 (7.3) 34.4 63.4 44.1 63.4 49.5 15.1 11.8
Others** 12 (0.9) 41.7 58.3 50.0 50.0 66.7 0 0
Table 3. Prevalence of guidance received on healthy habits, according to the characteristics of the health service. Pelotas, RS, 2014 (n = 1,281).
Guidance
Economic classiication (ABEP)**a
AB C
p-value
PR (95%CI) PR (95%CI)
Controling weight
Gross 1.42 (1.07 – 1.90) 1.22 (0.92 – 1.62) 0.003*
Adjusted 1.27 (1.06 – 1.70) 1.11 (0.85 – 1.47) 0.04*
Reducing salt
Gross 0.85 (0.72 – 1.01) 0.99 (0.85 – 1.14) 0.04
Adjusted 0.92 (0.77 – 1.11) 0.96 (0.83 – 1.11) 0.70
Reducing sugar
Gross 1.05 (0.85 – 1.29) 1.15 (0.95 – 1.40) 0.21
Adjusted 1.05 (0.85 – 1.30) 1.08 (0.89 – 1.31) 0.72 Reducing fats
Gross 0.89 (0.76 – 1.04) 1.00 (0.85 – 1.17) 0.08
Adjusted 0.88 (0.74 – 1.05) 0.95 (0.81 – 1.11) 0.28
Practicing physical activities
Gross 1.56 (1.24 – 1.96) 1.37 (1.08 – 1.74) <0.001*
Adjusted 1.34 (1.06 – 1.69) 1.26 (1.00 – 1.59) 0.01*
Not smoking
Gross 0.66 (0.44 – 0.99) 0.79 (0.54 – 1.16) 0.04*
Adjusted 0.71 (0.47 – 1.07) 0.80 (0.57 – 1.13) 0.13* Not drinking alcohol
Gross 1.05 (0.59 – 1.87) 1.02 (0.62 – 1.67) 0.85
Adjusted 1.17 (0.63 – 2.19) 1.07 (0.65 – 1.77) 0.59
Table 4. Gross and adjusted analysis between receiving guidance and economic classiication. Pelotas, RS, 2014 (n = 1,281).
ABEP: Associação Brasileira de Empresas de Pesquisa; PR: prevalence ratio; 95% CI: conidence interval of 95%;
p-value: Wald test for heterogeneity; *p-value: Wald test for linear trend; **classiication by ABEP: AB (the richest); analysis adjusted by gender, age, coloro f the skin, marital status and education; category of reference: D/E.
and fat consumption. The Ministry of Health recommends that the recommendations on healthy habits must be made in all contact with the users3,12,13.
From the results observed, it is not possible to ensure the quality of the guidance received, which is essential for an educational counseling so that the individual understands and adopts the health professional recommendation16, and not just the transmission of information. In this process of health education, there are many factors involved, which were not evalu-ated in this study, such as the training of the professionals, which may act positively in the insertion of action aimed at promoting and educating about health12,27. Another aspect to be mentioned is the time of the consultations, which may be one of the problems that afects the quality of the service, and a reduced number of professionals and a high demand for them, may decrease the supply of information29.
In relation to the demographic characteristics, it was observed that women received more orientation, which may be justiied by the higher frequency of consultations in health services by females10. Also, there were veriied lower prevalences of orientations for elderly over 80 years of age, similar to what was observed by Hinrichs et al.30. This inding may be justiied by the belief, on the part of the professionals, that the adoption of a healthy life-style is too late in this age range1.
Elderly with some NCDs are the ones who more often use health services for monitor-ing of their conditions and reduction of injuries by those diseases31. Among the elderly with excess of weight, hypertension, diabetes, and who continuously used prescription drugs, it was observed that they were the ones who received more guidance on healthy habits. This inding was similar to the one found in a study carried out among Brazilian adults and elderly16. However, we highlight the lost opportunities for prevention of health among the ones who did not have chronic diseases. Counseling must be ofered regardless the pres-ence of chronic diseases17,32. It is important to highlight that despite the need for medical treatment for NCDs, changes in lifestyle must be encouraged and it should be a part of therapy13. Although the prevalences on orientation of healthy habits have been more often observed among elderly with chronic conditions, they may still be under what was expected, considering that this population uses health services more often and thus is more exposed to receiving these orientations31,32. This is similar to what was shown in another study, with adults, showing that this impasse is not speciic to the elderly population17, but rather, an aspect to be improved in health services.
A lower amount of orientation for physical activity practice was observed among the elderly classiied as insuiciently active, similar to what was observed by Siqueira et al.16. The lack of recommendation may reduce the engagement of the individuals toward healthy habits, precisely those in most need of such counseling, emphasizing that professionals must constantly encourage individual into adopting a healthy lifestyle5,6,18,29.
Also, the PNPS recommends that the population must be strongly encouraged against the adoption and departure of these behaviors2, once these measures try to avoid the onset of NCDs or reduce their consequences1.
The guidance on healthy habits must be equally distributed in the population2,7,27. Nevertheless, there were veriied inequalities in relation to the economic classiications in receiving the guidance for weight control and for physical activity practice. The richest elderly have received more of those guidances. The plausibility for this inding is complex, and may be attributed to individual characteristics, that is, elderly with lower acquisitive power con-sult less in health services (data not shown). However, the characteristics of professionals and health services may explain more thoroughly these indings27. Health professionals may conclude that poor people go through greater diiculties to adopt these behaviors, failing to carry out the orientations.
Some limitations of the study must be mentioned. First, the reverse causality may cause diiculty in the interpretation of some associations such as, guidance on weight control and nutritional status. However, the study does not aim at making causal inferences. Also, there is the possibility of a recall bias, once the guidance on healthy habits might not be noted as an important event. Although most part of the literature uses a period of 12 months, studies on validation of recall periods may be carried out for a better understanding of the theme. And, inally, the losses and refusals were diferent from the sample in relation to age, causing a bias in the prevalence being studied. However, there is no suspicion of bias in the associations evaluated, once the age was included in the adjusted analysis.
Still, it is noteworthy that the outcome for orientation about weight control may not be the best way to be used in populational inquiries, as it might reach out to individuals with excess of weight. The nutritional status of the elderly was unknown before the interviews, thus, with the questionnaires it was possible to observe that this would be the best way to verify the outcome. Another possibility is the classiication mistake regarding the source of information of guidance. The recommendations investigated are of a general nature, and may be related to many means, such as the media.
On the positive side, we may highlight the populational representativeness of the study. Studies evaluating this theme are still scarce in the country, especially among the elderly9,14-16. Besides, the indings may help health managers of the municipality and similar locations to emphasize the promotion and prevention actions on health among elderly, that is, the study approached the receiving of guidance both according to the individual attributes and characteristics of the health service in the municipality.
CONCLUSION
specially in relation to the services inanced by SUS, where greater dispensing of instructions was observed, which may be signaled from the indings of this study. Thus, greater invest-ments should be conducted in relation to the educational actions on prevention of diseases and promotion of health. Guidance is a low-cost and low-efort measure and so the profes-sionals should be engaged in these strategies of guiding the elderly population on healthy habits in all the contacts they have with the service, regardless of the socioeconomic aspect or the presence of chronic diseases.
1. World Health Organization. Envelhecimento ativo: uma política de saúde. Brasília: Organização Pan-Americana da Saúde; 2005.
2. Brasil. Ministério da Saúde. Política Nacional de Promoção da Saúde. Brasília: Ministério da Saúde; 2010.
3. Brasil. Secretaria de Atenção à Saúde. Departamento de Atenção Básica. Envelhecimento e saúde da pessoa idosa. Brasília: Ministério da Saúde; 2006. Série A. Normas e Manuais Técnicos. Cadernos de Atenção Básica, nº 19.
4. Rodrigues EM, Soares FPTP, Boog MCF. Resgate do conceito de aconselhamento no contexto do atendimento nutricional. Rev Nutr 2005; 18(1): 119-28.
5. Agborsangaya CB, Gee ME, Johnson ST, Dunbar P, Langlois MF, Leiter LA, et al. Determinants of lifestyle behavior in type 2 diabetes: results of the 2011 cross-sectional survey on living with chronic diseases in Canada. BMC Public Health 2013; 13: 451.
6. Walker RL, Gee ME, Bancej C, Nolan RP, Kaczorowski J, Jofres M, et al. Health behaviour advice from health professionals to Canadian adults with hypertension: results from a national survey. Can J Cardiol 2011; 27(4): 446-54.
7. Fleming P, Godwin M. Lifestyle interventions in primary care: systematic review of randomized controlled trials. Can Fam Physician 2008; 54(12): 1706-13.
8. Paim J, Travassos C, Almeida C, Bahia L, Macinko J. The Brazilian health system: history, advances, and challenges. Lancet 2011; 377(9779): 1778-97.
9. Sturmer G, Dias-da-Costa JS, Olinto MTA, Menezes AMB, Gigante DP, Macedo S. O manejo não medicamentoso da hipertensão arterial sistêmica no Sul do Brasil. Cad Saúde Pública 2006; 22(8): 1727-37.
10. Costa JSD, Reis MC, Silveira Filho CV, Linhares RS, Piccinini F. Prevalência de consultas médicas e fatores associados, Pelotas (RS), 1999-2000. Rev Saúde Pública 2008; 42(6): 1074-84.
11. Instituto Brasileiro de Geograia e Estatística. Pesquisa Nacional de Saúde, 2013: percepção do estado de saúde, estilos de vida e doenças crônicas. Brasil, Grandes Regiões e Unidades de Federação. Rio de Janeiro: IBGE; 2014.
12. Brasil. Ministério da Saúde. Secretaria de Atenção à Saúde. Departamento de Atenção Básica. Guia alimentar para a população brasileira: promovendo a alimentação saudável. Ministério da Saúde, 2008. Série A. Normas e Manuais Técnicos.
13. Brasil. Ministério da Saúde. Secretaria de Atenção à Saúde. Departamento de Atenção Básica. Estratégias para o cuidado da pessoa com doença crônica. Brasília: Ministério da Saúde; 2014. Cadernos de Atenção Básica, nº 35.
14. Capilheira M, Santos IS. Doenças crônicas não transmissíveis: desempenho no cuidado médico em atenção primária à saúde no sul do Brasil. Cad Saúde Pública 2011; 27(6): 1143-53.
15. Andrade KA, Toledo MTT, Lopes MS, Carmo GES, Lopes ACS. Aconselhamento sobre modos saudáveis de vida na Atenção Primária e práticas alimentares dos usuários. Rev Esc Enferm USP 2012; 46(5): 1117-24.
16. Siqueira FV, Nahas MV, Facchini LA, Silveira DS, Piccini RX, Tomasi E, et al. Aconselhamento para a prática de atividade física como estratégia de educação à saúde. Cad Saúde Pública 2009; 25(1): 203-13.
17. Silva SM, Facchini LA, Tomasi E, Piccini R, Thumé E, Silveira DS, et al. Recebimento de orientação sobre consumo de sal, açúcar e gorduras em adultos: um estudo de base nacional. Rev Bras Epidemiol 2013; 16(4): 995-1004.
18. Jackson SE, Wardle J, Johnson F, Finer N, Beeken RJ. The impact of a health professional recommendation on weight loss attempts in overweight and obese British adults: a cross-sectional analysis. BMJ Open 2013; 3(11): e003693.
19. Instituto Brasileiro de Geograia e Estatística. Censo Brasileiro 2010. Rio de Janeiro: IBGE; 2011.
20. Barros AJD, Menezes AMB, Santos IS, et al. O Mestrado do Programa de Pós-graduação em Epidemiologia da UFPel baseado em consórcio de pesquisa: uma experiência inovadora. Rev Bras Epidemiol 2008; 11(Suppl 1): 133-44.
21. Associação Brasileira de Empresas de Pesquisa. Critério de classiicação econômica do Brasil. São Paulo: ABEP; 2014.
22. Craig CL, Marshall AL, Sjöstrom M, Bauman AE, Booth ML, Ainsworth BE, et al. International physical activity questionnaire: 12-country reliability and validity. Med Sci Sports Exerc 2003; 35(8): 1381-95.
23. Kamimura MA, Baxmann A, Sampaio LR, Cuppari L. Avaliação nutricional. In: Cuppari L. Guia de nutrição: nutrição clínica no adulto. Barueri: Manole; 2005. p. 89-115.
24. Chumlea WC, Guo S. Equations for predicting stature in white and black elderly individuals. J Gerontol 1992; 47(6): M197-203.
25. Lipschitz DA. Screening for nutritional status in the elderly. Prim Care 1994; 21(1): 55-67.
26. Barros AJ, Hirakata VN. Alternatives for logistic regression in cross-sectional studies: an empirical comparison of models that directly estimate the prevalence ratio. BMC Med Res Methodol 2003; 3: 21.
27. Johansson H, Stenlund H, Lundström L, Weinehall L. Reorientation to more health promotion in health
services: a study of barriers and possibilities from the perspective of health professionals. J Multidiscip Healthc 2010; 3: 213-24.
28. Starfield B. Atenção primária: equilíbrio entre necessidades de saúde, serviços e tecnologia. Brasília: Ministério da Saúde; 2002.
29. Florindo AA, Mielke GI, Gomes GAO, Ramos LR, Bracco MM, Parra DC, et al. Physical activity counseling in primary health care in Brazil: a national study on prevalence and associated factors. BMC Public Health 2013; 13: 794.
30. Hinrichs T, Moschny A, Klaassen-Mielke R, Trampisch U, Thiem U, Platen P. General practitioner advice on physical activity: analyses in a cohort of older primary health care patients (getABI). BMC Fam Pract 2011; 12: 26.
31. Lima-Costa MF, Loyola Filho AI, Matos DL. Tendências nas condições de saúde e uso de serviços de saúde entre idosos brasileiros: um estudo baseado na Pesquisa Nacional por Amostra de Domicílios (1998, 2003). Cad Saude Pública 2007; 23(10): 2467-78.
32. Lopes ACS, Toledo MTT, Câmara AMCS, Menzel HJK, Santos LC. Condições de saúde e aconselhamento sobre alimentação e atividade física na Atenção Primária à Saúde de Belo Horizonte-MG. Epidemiol Serv Saúde 2014; 23(3): 305-16.
Received on: 03/23/2015