Rita Maria da SilvaI
Márcia Dalastra LaurentiII
Almério de Castro GomesIII
Yeda Lopes NogueiraIV
I Seção de Parasitologia. Divisão de Laboratórios Regionais. Instituto Adolfo Lutz. Rio Claro, SP, Brasil
II Departamento de Patologia. Faculdade de Medicina. Universidade São Paulo (USP). São Paulo, SP, Brasil
III Departamento de Epidemiologia. Faculdade de Saúde Pública. USP. São Paulo, SP, Brasil IV Seção de Sorologia. Divisão de Biologia
Médica. Instituto Adolfo Lutz. São Paulo, SP, Brasil
Correspondence:
Rita Maria da Silva
Instituto Adolfo Lutz – Rio Claro Rua Dez, 152 – Consolação 13500-090 Rio Claro, SP, Brasil E-mail: ritsilva@terra.com.br
Received: 4/22/2008 Revised: 10/1/2008 Approved: 2/4/2009
TG-ROC analysis of
immunofluorescence assays in
canine visceral leishmaniasis
diagnosis
ABSTRACT
OBJECTIVE: To analyze the accuracy of the diagnosis of two protocols of indirect immunoluorescence assays for canine visceral leishmaniasis. METHODS: Dogs from the seroepidemiological survey conducted in an endemic area of the cities of Araçatuba and Andradina, in Northwestern São Paulo state, in 2003, and in a non-endemic area of the metropolitan region of São Paulo, were used to assess two protocols of indirect immunoluorescence assay (IFA) for leishmaniasis: one using a Leishmania major heterologous antigen (IFA-BM) and another using a Leishmania chagasi homologous antigen (IFA-CH). Two-graph receiver operating characteristic (TG-ROC) analysis was used to estimate accuracy. TG-ROC analysis compared 1:20 dilution readings of the homologous antigen (IFA-CH), considered as reference test, with IFA-BM dilutions (heterologous antigen).
RESULTS: The 1:20 dilution used in the IFA-CH test showed the best contingency coeficient (0.755) and the highest strength of association between the two variables studied (chi-square=124.3). Thus, it was considered the test reference dilution in comparisons with different IFA-BM test dilutions. The best IFA-BM results were obtained from 1:40 dilutions with the best contingency coeficient (0.680) and highest strength of association (chi-square=80.8). With the change in the cut-off point, recommended for the IFA-BM 1:40 dilution in this analysis, the speciicity parameter value rose from 57.5% to 97.7%, even though the 1:80 dilution showed the best sensitivity estimate (80.2%), with the new cut-off point.
CONCLUSIONS: TG-ROC analysis can provide important information about diagnostic tests, in addition to offering suggestions on cut-off points that can improve test sensitivity and speciicity estimates and assessing these tests in terms of the best cost-beneit ratio.
DESCRIPTORS: Leishmaniasis, Visceral, diagnosis. Dogs. Fluorescent Antibody Technique. Diagnostic Techniques and Procedures. Sensitivity
2 TG-ROC analysis in CVL diagnosis Silva RM et al
American visceral leishmaniasis (AVL) affects 88 countries, with 90% of cases occurring in India, Ban-gladesh, Nepal, Sudan and Brazil.a
In Brazil, AVL is considered endemic in 19 states, es -pecially in the Northeast region, where a higher num-ber of cases are reported and transmission patterns have changed.
At irst, this disease was considered predominantly rural and peri-urban. Nowadays, it has been recorded in major urban centers such as Rio de Janeiro, Belo Horizonte, Araçatuba, Southeastern Brazil, and Co-rumbá, Central-West Brazil.10,b,c
In the state of São Paulo, the irst report of the human disease’s autochthony was made in the metropolitan area of São Paulo, in 1978.10 However, at that time, it was not possible to identify the reservoir and vec-tor in the links of transmission chain. In 1998, in the city of Araçatuba, the presence of Leishmania sp. was detected in direct parasitological examination of dogs with clinical suspicion of canine visceral leishma -niasis (CVL), subsequently identiied as Leishmania chagasi. These facts, in addition to the presence of the vector insect, Lutzomyia longipalpis, notiied in 1997,
conirmed the autochthony of CVL in dogs living in the urban area of Araçatuba. In 1999, in this same city, the irst autochthonous human case was reported.b In general, oficial CVL surveillance and control pro-grams recommend canine serological surveys should be made, aiming to know the disease’s epidemiologi-cal situation in areas with active transmission or with potential transmission, with the concomitant identii -cation of serologically positive dogs for subsequent destruction.b,c Studies emphasize the importance of test sensitivity and speciicity parameters to assess the impact of destroying dogs, when compared to the serological methodology employed.3 Studies assess-ing the results obtained from epidemiological surveys performed in Belo Horizonte,1,2 using a kit obtained from the Leishmania major antigen, suggest that the use of indirect immunoluorescence assay (IFA) could compromise the effectiveness of the CVL Control Program. This is because IFA does not detect infected animals, due to false negative results, while it identi-ies non-infected dogs (false positive) with the result -ing recommendation for destruction, accord-ing to the disease’s Control Program.
INTRODUCTION
a World Health Organization. Tropical disease research: progress 2003-2004. Seventeenth Programme Report of the UNICEF/UNDP/World Bank/WHO Special Programme for Research & Training in Tropical Diseases. TDR 2005. Geneva; 2005. (Programme Report, 17). Disponível em: http://www.who.int/tdrold/publications/publications/pr17.htm
b Camargo-Neves VLF, Glasser CM, Cruz LL, Almeida RG. Manual de Vigilância e Controle de Leishmaniose Visceral Americana do Estado de São Paulo. São Paulo: Ministério da Saúde. Secretaria de Estado da Saúde; 2006.
c Ministério da Saúde. Departamento de Vigilância Epidemiológica. Secretaria de Vigilância em Saúde. Manual de Vigilância e Controle de Leishmaniose Visceral; 2006.
The present study aimed to analyze the accuracy of two protocols of indirect immunoluorescence assays for canine visceral leishmaniasis.
METHODS
Tests were performed in two sample groups.
Group A was comprised of 94 serum samples of male and female dogs of different ages and breeds, of which 74 came from a seroepidemiological survey conducted in the cities of Araçatuba and Andradina, an endemic area in Northwestern São Paulo state.
A total of 20 seronegative dog samples from the city of São Paulo were added, an area considered to be without transmission at the time of collection (2003).
All dogs were assessed in terms of their clinical status, in addition to their having been serologically assessed for CVL diagnosis using IFA and direct parasitologi -cal examination. In this way, group A dogs were con -sidered the reference population, of which 50 showed positive diagnosis, clinically classiied as: symp -tomatic (30 dogs), oligosymp-tomatic (18 dogs) and asymptomatic (two dogs). There were 24 dogs with negative diagnosis that belonged to the endemic area and 20 that belonged to the non-endemic area. Group B was comprised of 160 paired samples of se-rum and blood, collected on ilter paper, from dogs belonging to the same cities and participating in the AVL serological surveys. A total of two IFAs were compared: one using promastigote Leishmania ma-jor forms (heterologous antigen), (IFA-BM, Bioman-guinhos, Fiocruz – Oswaldo Cruz Foundation
Im-munobiological Technology Institute), and the other using promastigote Leishmania chagasi forms (ho-mologous antigen) (IFA-CH, Laboratório de Patolo-gia de Doenças Infecciosas, Faculdade de Medicina da USP – São Paulo University School of Medicine
a The readings of the immunoflorescence reaction on the microscope (x 400) can be seen in the online version of Revista de Saúde Pública, available from www.scielo.br/rsp
b Schoojans F. MedCalc statistic for biomedical research: software manual. Mariakerke: Medcalc Statistical Software; 1998. 2+, 3+ and 4+, resulting in a score. This score was
converted into percentages, so that the quantitative variable became continuous, thus enabling the use of the Two-Graph Receiver Operating Characteristics (TG-ROC) technique.7 The readinga made with IFA-CH, which served as parameter for comparison: as a general rule, the microscope visual ield was divided into four quadrants, each illed with luorescent para-sites equivalent to 25% luorescence or 1+. Frequency distribution analyses for each serum dilution versus clinical forms, calculating chi-square and contingency coeficients extracted from contingency tables, were made for each set of results obtained from IFA-BM and IFA-CH readings. MedCalc statistical packageb was used for this analysis.
Cut-off point estimates, in addition to sensitivity and speciicity parameters, positive and negative predic-tive values and effecpredic-tiveness were obtained using graphic analysis, created by the CMDT statistical package8’s TG-ROC technique.7
RESULTS
The readings of the IFA-CH and IFA-BMa indicate the immunoluorescence reaction with the IFA-CH ho -mologous antigen is more speciic than that with the IFA-BM heterologous antigen, which shows a non-speciic background reaction that usually prevents a correct reading.
Results found on Tables 1 and 2, referring to group A samples, show the distributions of readings of the clinical diagnosis variable versus the serum dilution variable in the different categories, in both assays (IFA-CH and IFA-BM).
Of all the samples analyzed from 94 group A serums, 95.4% (42/44) were non-reactive with IFA-CH, in 1:20, 1:40 and 1:80 dilutions, and 90.9% (40/44) in 1:160 dilution (Table 1), when results from both as -says were compared. Yet, for IFA-BM, non-reactive results were: 36.3% (16/44) in 1:20 dilution, 50.0% (22/44) in 1:40 dilution, 56.8% (25/44) in 1:80 dilu-tion, and 52.2% (23/41) in 1:160 dilution (Table 2). In addition, there was no speciic correlation between the different stages of disease and distinct reaction read-ing luorescence levels, once all clinical forms were distributed into all reading ranges, varying from < 25% (weakly positive) to 3+ (75%).
The IFA-CH 1:20 dilution (Table 1) showed the best contingency coeficient (0.755) and the high -est strength of association between the two variables studied (chi-square = 124.3). In addition, it was
con-sidered the assay’s reference dilution and used for the comparative study with different IFA-BM dilutions. For this assay, the best results were obtained with the 1:40 dilution, which showed the best contingency co-eficient (0.680) and the highest strength of associa -tion (chi-square=80.8) (Table 2).
TG-ROC graphic analysis on Figure 1 shows the sen -sitivity and speciicity parameter values, represented on the y axis, whereas the x axis shows the values of readings in plus signs, which were converted into per -centages (values of cut-off points). TG-ROC graphic analysis compares the homologous antigen (IFA-CH) 1:20 dilution readings, considered as reference assay, with the readings of each heterologous antigen (IFA-BM) dilution (1:20, 1:40, 1:80 and 1:160) (Figure 1).
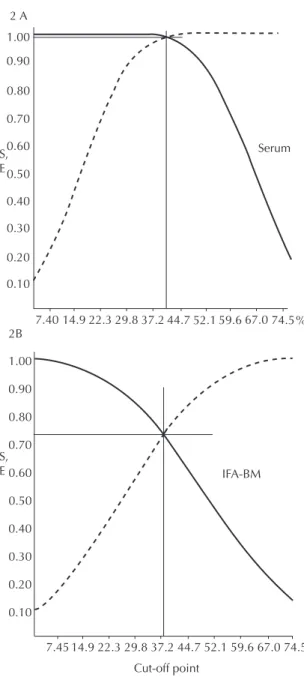
Figure 2 was constructed by applying the new cut-off point value of the 1:40 dilution (Figure 1B), estab -lished by the analysis of group A TG-ROC, to group B’s canine population. All the 160 paired samples of serum and blood, collected on ilter paper, had already been assessed in 1:40 dilution, once this dilution is recommended on the IFA-BM kit label. However, at this dilution, luorescence-reactive results that showed 1+ or 25% luorescence were not seen as positive, once the cut-off point considered was equal to 26.70%, thus >25%. Figure 2A shows that the estimates of sensi -tivity and speciicity parameters were 98% and the new cut-off point was 39.5%. The same cut-off point procedure was performed with the same dogs, whose blood was collected on ilter paper, with sensitivity and speciicity values of 73% and new cut-off point value of 37.2% (Figure 2B).
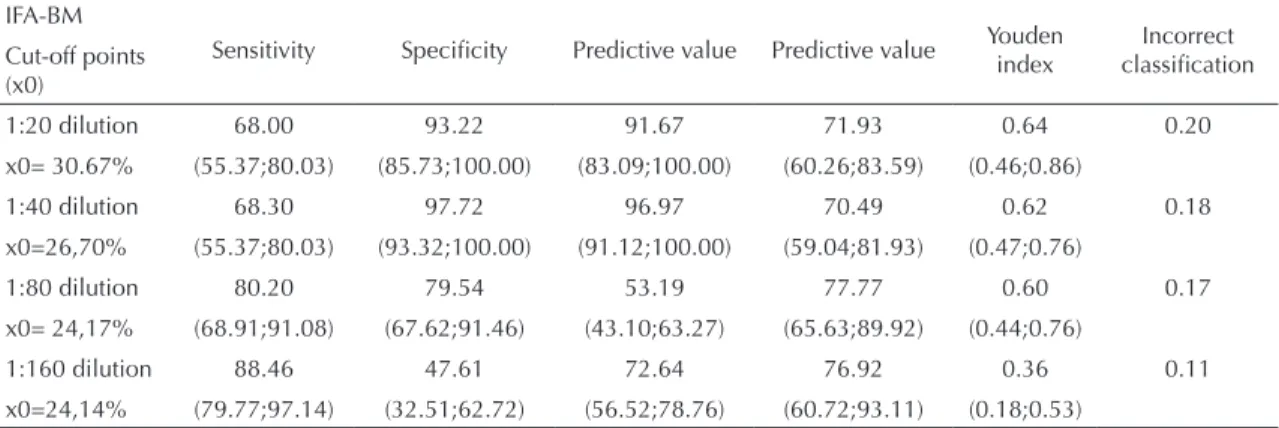
Table 3 shows the new estimates of sensitivity and speciicity values, positive and negative predictive values, effectiveness and IFA-BM incorrect classii -cation, based on the cut-off point provided by the TG-ROC analysis and using the IFA-CH 1:20 dilution as reference. The new cut-off points shown on Figure 1 resulted from new values for sensitivity and speciic -ity parameters.
DISCUSSION
The TG-ROC graphic analysis7 enables the cut-off point value, associated with the combination of sen-sitivity and speciicity parameters, to be found. In this way, the diagnostic assay accuracy allows the dis-tinction between ill individuals and non-ill (healthy) individuals.
4 TG-ROC analysis in CVL diagnosis Silva RM et al
diagnostic assays: one speciic, using homologous antigens (IFA-CH), and the other using a heterolo-gous antigen (IFA-BM). The best distinction between seronegative dogs (healthy) and seropositive dogs (probably ill) occurred with the IFA-CH 1:20 dilution, which showed the best contingency coeficient and chi-square (Table 1), whereas the 1:40 dilution was the one that best separated these two sub-populations for IFA-BM (Table 2).
In this way, the new cut-off point suggested at IFA-BM 1:20 and 1:40 dilutions (Figure 1), above 25% (1+), disregards 1+ results as positive, resulting in a negative character. In this case, with group A popula -tion, there is a signiicant difference between assays when their results are analyzed comparatively, with -out the cut-off point adjustment. This can be explained by the characteristics of cases near the cut-off point, which usually have low antibody titers and represents the range where cross-reactivity is usually observed. Studies that assessed the immunoenzymatic assay (ELISA), using different antigen extracts and includ -ing dogs from the CVL-endemic area, found the exis-tence of cross-reactions with other parasitic diseases (Chagas’ disease, diroilariasis and babesiosis), with both L. chagasi homologous antigen and L. amazon-ensis heterologous antigen. However, when recom -binant rk-39 and rk-26 antigens were used, no cross-reactivity was observed.15 Another study5 showed the occurrence of cross-reactions when three serological methods for CVL were compared: IFA, ELISA, and direct agglutination test (DAT). After analyzing 234 dog samples in the endemic area of Minas Gerais, IFA and ELISA speciicity indices were low, 52% and 64% respectively, showing cross-reactions with dog serums infected with T. cruzi, L. braziliensis and E. canis, whereas DAT speciicity was high, 95%,
show-ing only one animal with E. canis, seropositive for
CVL. Likewise, in other studies performed in Corse -ga, in the Mediterranean Sea, authors found 100% speciicity for DAT.5,13 In contrast, there were yet other studies, using serum samples from dogs infected with
Babesia sp. and from a dog with ehrlichiosis, that did now show cross-reactivity when samples were sub -mitted to IFA for CVL.16
The best estimate for the speciicity parameter value was found in the 1:40 dilution (Sp=97.7%), even though the 1:80 dilution shows the best sensitivity pa-rameter estimate (Se=80.2%) (Table 3). These results show the possibility of choosing dilution cut-offs and making more adequate decisions for the cut-off point. As an example, the 1:40 dilution with a cut-off point higher than 26.7% shows the best speciicity estimates and positive predictive value, preventing truly nega-tive dogs from being destroyed. On the other hand, when the 1:80 dilution is selected, with better sensi -tivity index (80.2%) and lower speciicity (79.5%),
% 1.00 0.90 0.80 0.70 0.60 0.50 0.40 0.30 0.20 0.10 1A
7.60 15.2 22.8 30.4036.045.6053.2 60.8 68.4 D2 1:20 D1 1:40 D2 1:80 D1 1:60 1.00 0.90 0.80 0.70 0.60 0.50 0.40 0.30 0.20 0.10 1B 1.00 0.90 0.80 0.70 0.60 0.50 0.40 0.30 0.20 0.10 1C 1.00 0.90 0.80 0.70 0.60 0.50 0.40 0.30 0.20 0.10 1D % 0.00 7.55 15.3 22.930.538.245.9 53.2 61.2
% 0.00 7.80 15.6 23.431.240.043.8 54.6 62.4
% 0.00 7.65 15.3 22.930.038.245.9 53.5 61.2
68.8 70.2 68.8 Cut-off point S, E S, E S, E S, E
Figure 1. Sensitivity ( ) and specificity ( ) TG-ROC
analysis after new cut-off point in IFA-CH and IFA-BM (group B samples). Andradina, Araçatuba and São Paulo, Southeas-tern Brazil, 2003.
5
of fluorescence and clinical diagnosis. Andradina, Araçatuba and São Paulo, Southeastern Brazil, 2003.
% of fluorescence
Clinical diagnosis
1:20 dilution 1:40 dilution
1:80 dilution 1:160 dilution
0 <25 25 37 50 62 75 total 0 <25 25 37 50 62 75 total 0 <25 25 37 50 62 75 total 0 <25 25 37 50 62 75 total
Healthy 42 1 0 0 1 0 0 44 42 1 0 1 0 0 0 44 42 1 1 0 0 0 0 44 40 2 2 0 0 0 0 44
% 44,7 1,1 - - 1,1 - - 46,9 44,7 1,1 - 1,1 - - - 46,9 45,6 1,1 1,1 - - - - 47,8 42,5 2,1 2,1 - - - - 46,7
Symptomatic 0 3 9 3 12 2 1 30 0 5 9 3 12 0 1 30 2 8 7 5 5 0 2 29 4 13 2 4 6 1 0 30
% - 3,2 9,6 3,2 12,8 2,1 1,1 33,0 - 5,3 9,6 3,2 12,8 - 1,1 32,0 2,1 8,6 7,5 5,4 5,4 - 2,1 31,1 4,2 13,8 2,1 4,2 6,4 1,1 - 31,9
Oligosymptomatic 0 3 4 2 8 1 0 18 1 4 2 4 6 1 0 18 2 6 4 2 3 1 0 18 5 2 6 3 2 0 0 18
% - 3,2 4,2 2,1 8,5 1,1 - 19,1 1,1 4,2 2,1 4,2 6,4 1,1 - 19,1 2,1 6,4 4,3 2,1 3,2 1,1 - 19,2 5,3 2,1 6,4 3,2 2,1 - - 19,1
Asymptomatic 0 0 0 0 0 2 0 2 0 0 0 0 1 1 0 2 0 0 0 0 2 0 0 2 0 0 1 0 1 0 0 2
% - - - 2,1 - 2,1 - - - - 1,1 1,1 - 2,2 - - - - 2,1 - - 2,1 - - 1,1 - 1,1 - - 2,2
Total 42 7 13 5 21 5 1 94 43 10 11 8 19 2 1 94 46 15 12 7 10 1 2 93 49 17 11 7 9 1 0 94
% 44,7 7,5 13,8 5,3 22,3 5,3 1,1 100,0 45,8 10,6 11,7 8,5 20,3 2,2 1,1 100,0 49,4 16,1 12,9 7,5 10,7 1,1 2,1 100,0 52,0 18,1 11,7 7,5 9,6 1,1 - 100,0
p<0,0001 p<0,0001 p<0,0001 p<0,0001
Chi-square = 124,3 Chi-square = 114.7 Chi-square = 92.4 Chi-square = 72.7
6 TG-ROC analysis in CVL diagnosis Silva RM et al
the positive predictive value also decreases (53.2%), increasing the possibility of healthy dogs being de-stroyed. Regardless, the decision to be made implies knowledge about the costs and beneits the selected cut-off point may offer.
Table 3 shows values for incorrect classiication of about 20%, 18% and 17%, in 1:20, 1:40 and 1:80
dilu-tions, respectively, indicating that this parameter must also be assessed in combination with sensitivity and speciicity. Comparison of results obtained in each of the IFA-BM dilutions with the IFA-CH (reference assay) 1:20 dilution shows that many serums did not show agreement, probably due to antigenic differences in the two antigens and the decrease in antibody avid -ity, or yet due to a question of equivalence zone of the antigen-antibody reaction between serums analyzed. Thus, a decrease in sensitivity in the 1:20 and 1:40 dilutions was observed, compared to 1:80 and 1:160 dilutions, which show the incorrect classiication pa -rameter of 11%. The choice of the 1:40 dilution with a cut-off point above 25% would be better, because, although the estimate of sensitivity is 68.3%, the con-idence interval is within the 1:80 dilution concon-idence interval, which shows a speciicity of 80.2%. In addi -tion, in the 1:40 dilu-tion, the speciicity parameter es -timate is the one that shows the highest value, 98.0%, and the incorrect classiication varies very little be-tween the two dilutions (0.18 and 0.17).
In the literature, some authors consider that the best IFA dilution cut-off is 1:80.12,14,15 In the case of the IFA-BM, used in visceral leishmaniasis surveillance and control programs, the 1:40 dilution is usually rec -ommended as dilution cut-off, although considering the 1+ reading as positive. Thus, the estimated sensi -tivity and speciicity value of 57.50% results in a dif-ference in speciicity of almost 40% and, after reclas-siication, speciicity was 97.50%.
Studies have observed high levels of sensitivity and speciicity in serological tests used in canine surveys. Review studies1 on CVL diagnosis with IFA show sensitivity values varying between 90% and 100% and speciicity of 80% for serum samples. Other au-thors12 indicated IFA sensitivity and speciicity values of 98.4% and 100%, respectively.11 Moreover, other studies compared serological sample results from 86 dogs with positive parasitological examination, in ive laboratories that made CVL serological diagnosis, us -ing IFA and ELISA. Sensitivity varied between 98.8% and 100% and speciicity between 94.7% and 100% for IFA, while sensitivity varied between 98.8% and 100% and speciicity between 96.5% and 100% for ELISA. Considering the similarity among the results of this study, there seems to be sampling bias, once test comparison is made using known serum panels, i.e. these studies do not use samples of populations from endemic and non-endemic areas, hindering the actual test assessment and causing an over-estimation of parameters.
However, actual sensitivity and speciicity parameter values, observed on Figure 2 and Table 3, are closer to the values expected for dog populations that show the disease status homogenously distributed, i.e. ill indi-viduals (symptomatic, oligosymptomatic and asymp
-Figure 2. Sensitivity ( ) and specificity ( ) TG-ROC
analysis after new cut-off point in IFA-CH and IFA-BM (group B samples). Andradina, Araçatuba and São Paulo, Southeas-tern Brazil, 2003.
Note: TG-ROC analysis was performed with a new standard of cut-off point found in the 1:40 dilution (cut-off point > 26.70%). 3A – Serum samples: cut-off point= 39.52% and values of Se=Sp= 98%. 3B – Blood samples collected on filter paper: Cut-off point= 37.20% and values of Se=Sp= 73%.
1.00
0.90
0.80
0.70
0.60
0.50
0.40
0.30
0.20
0.10
7.40 14.9 22.3 29.8 37.2 44.7 52.1 59.6 67.0 74.5% 2 A
S, E
Serum
1.00
0.90
0.80
0.70
0.60
0.50
0.40
0.30
0.20
0.10 2B
7.45 14.9 22.3 29.8 37.2 44.7 52.1 59.6 67.0 74.5 S,
E IFA-BM
7
clinical diagnosis. Andradina, Araçatuba and São Paulo, SP, Brazil, 2003.
% of fluorescence
Clinical diagnosis
1:20 dilution 1:40 dilution 1:80 dilution 1:160 dilution
0 <25 25 37 50 62 75 Total 0 <25 25 37 50 62 75 Total 0 <25 25 37 50 62 75 Total 0 <25 25 37 50 62 75 Total
Healthy 16 19 6 1 1 0 1 44 22 16 5 0 1 0 0 44 25 10 5 1 2 0 1 44 23 14 2 2 0 0 0 41
% 17,0 20,2 6,4 1,1 1,1 - 1,1 46,8 23,4 17,0 5,3 - 1,1 - - 46,8 26,5 10,1 5,3 1,1 2,1 - 1,1 46,8 25,3 15,4 2,2 2,2 - - - 45,1
Symptomatic 0 1 9 6 9 2 3 30 0 1 10 7 7 1 4 30 1 3 12 4 7 1 2 30 0 5 12 2 7 1 3 30
% - 1,1 9,6 6,4 9,6 2,1 3,2 32,0 - 1,1 10,6 7,5 7,5 1,1 4,2 32,0 1,6 3,2 12,8 4,2 7,5 1,1 2,1 32,0 - 5,5 13,2 2,2 7,2 1,1 3,3 33,0
Oligosymptomatic 0 0 4 3 6 2 3 18 0 1 4 4 6 1 2 18 0 4 6 2 5 1 0 18 0 2 6 4 4 1 1 18
% - - 4,2 3,2 6,4 2,1 3,2 19,1 - 1,1 4,2 4,2 6,4 1,1 2,1 19,1 - 4,2 6,4 2,1 5,3 1,1 - 19,1 - 2,2 6,6 4,4 4,4 1,1 1,1 19,8
Asymptomatic 0 0 0 0 1 0 1 2 0 0 0 2 0 0 0 2 0 0 0 2 0 0 0 2 0 0 1 1 0 0 0 2
% - - - - 1,1 - 1,1 2,2 - - - 2,1 - - - 2,1 - - - 2,1 - - - 2,1 - - 1,1 1,1 - - - 2,2
Total 16 20 19 10 17 4 8 94 22 18 19 13 14 2 6 94 26 17 23 9 14 2 3 94 23 21 22 9 11 2 4 91
% 17,1 21,3 20,2 10,6 18,1 4,2 8,5 100,0 23,4 19,1 20,2 13,8 14,9 2,1 6,4 100,0 27,6 18,1 24,5 9,5 13,9 2,2 3,2 100,0 25,3 23,1 24,1 9,9 12,7 2,2 4,4 100,0
p<0,0001 p<0,0001 p<0,0001 p<0,0001
Chi-square = 71.9 Chi-square = 80.8 Chi-square = 65.7 Chi-square = 66.8
8 TG-ROC analysis in CVL diagnosis Silva RM et al
tomatic ones) and healthy individuals, as observed in group A population. On the other hand, group B popu -lation was comprised of a majority of truly positive dogs, showing sampling bias and, as a result, distort-ing sensitivity and speciicity values. This fact usually occurs in studies performed with tests where non-ran-dom samples are used to assess diagnostic kits. Another relevant question concerning the use of IFA-BM in serological surveys is their use in samples col-lected on ilter paper. This assessment was made with group B serums (Figure 2). This group was comprised of paired samples of serum and ilter paper, although the majority of cases showed strongly positive results, that is, IFA readings above 2+ (50%). In this way, TG-ROC analysis showed very high sensitivity and speciicity estimate values (98%) for serum samples, whereas the referred values were 73% for blood samples on ilter paper, indicating a 25% difference between serum use and ilter paper. There are several studies comparing results of IFA performed in paired
samples of serum and eluates. Some studies2,4 report low values for the sensitivity parameter of IFA with eluate, when compared to the ELISA method with se -rum. On the other hand, different authors found high agreement of results of this assay in serum and eluate samples.15
These considerations are important when assessing di-agnostic tests, especially as regards the sample used in the comparison. To avoid such bias, studies on valida-tion of diagnostic tests9 suggest guidelines on all vari -ables that must be controlled to assess these tests. In conclusion, the present study shows how TG-ROC analysis can provide important information about di-agnostic tests, in addition to its offering suggestions on cut-off points that can improve the estimates of test speciicity and sensitivity parameters and assess them in terms of the best cost and beneit. Finally, it pro -vides more consistency when making decisions in the analyses of seroepidemiological survey results.
Table 3. IFA-BM results for dilutions with TG-ROC analysis cut-off points versus IFA-CH (group A samples) 1:20 dilution.
Andradina, Araçatuba and São Paulo, SP, Brazil, 2003.
IFA-BM
Sensitivity Specificity Predictive value Predictive value Youden index
Incorrect classification Cut-off points
(x0)
1:20 dilution 68.00 93.22 91.67 71.93 0.64 0.20
x0= 30.67% (55.37;80.03) (85.73;100.00) (83.09;100.00) (60.26;83.59) (0.46;0.86)
1:40 dilution 68.30 97.72 96.97 70.49 0.62 0.18
x0=26,70% (55.37;80.03) (93.32;100.00) (91.12;100.00) (59.04;81.93) (0.47;0.76)
1:80 dilution 80.20 79.54 53.19 77.77 0.60 0.17
x0= 24,17% (68.91;91.08) (67.62;91.46) (43.10;63.27) (65.63;89.92) (0.44;0.76)
1:160 dilution 88.46 47.61 72.64 76.92 0.36 0.11
1. Alves WA, Bevilacqua PD. Reflexões sobre a qualidade do diagnóstico da leishmaniose visceral canina em inquéritos epidemiológicos: o caso da epidemia de Belo Horizonte, Minas Gerais, Brasil, 1993-1997. Cad
Saude Publica. 2004;20(1):259-65. DOI:10.1590/
S0102-311X2004000100043
2. Ashford D, Badaro R, Eulalio C, Freire M, Miranda C, Zalis MG, et al. Studies on the control of visceral leishmaniasis: validation of the falcon assay screening test- enzyme-linked immunosorbent assay (FAST-ELISA) for field diagnosis of canine visceral leishmaniasis. Am
Soc Trop Med Hyg. 2003;48(1):1-8.
3. Braga MDM, Coelho ICB, Pompeu MMLP, Evans TG, MacAullife IT, Teixeira MJ, et al Controle do calazar canino: comparação dos resultados de um programa de eliminação rápida de cães sororreagentes por ensaio imuno-enzimático com outro de
eliminação tardia de cães sororreagentes por teste de imunofluorescência indireta de eluato de papel filtro. Rev Soc Bras Med Trop. 1998;31(4):419-24. DOI:10.1590/S0037-86821998000500001
4. Evans TG, Vasconcelos IA, Lima JW, Teixeira JM, Mc Auliffe IT, Lopes UG, et al. Canine visceral leishmaniasis in northeast Brazil: assessment of serodiagnosis methods. Am J Trop Med Hyg.
1990;42(2):118-23.
5. Ferreira EC, Lana M, Carneiro M, Reis AB, Paes DV, Silva ES, et al. Comparison of serological assays for the diagnosis of canine visceral leishmaniasis in animals presenting different clinical manifestations. Vet Parasitol. 2007;146(3-4):235-41.
6. Gontijo CMF, Melo MN. Leishmaniose visceral no Brasil: quadro atual, desafios e perspectivas. Rev Bras
Epidemiol. 2004; 7(3):338-49.
DOI:10.1590/S1415-90X2004000300011
7. Greiner M. Two-graph receiver operating
characteristics (TG-ROC): a Microsoft-EXCEL template for the selection of cut off values in diagnostic tests. J
Immunol Methods. 1995;185(1):145-6.
8. Greiner M. Two-graph receiver operating characteristics (TG-ROC): update version supports optimisation of cut-off vallues that minimise overall misclassification costs.
J Immunol Methods. 1996;191(1):93-4.
9. Greiner M, Gardner IA. Epidemiologic issues in the validation dianostic tests. Prev Vet Med. 2000;45(1-2):3-22.
10. Iversson LB, Camargo ME, Rocha e Silva EO, Chieffi PP, Barros JAC. Investigação epidemiológica de um caso de leishmaniose visceral autóctone da Grande São Paulo, Brasil. Rev Saude Publica. 1979;13:159-67. DOI:10.1590/S0034-89101979000200012
11. Machado JG, Moraes JRC, Costa RT, Nascimento E, Moreira EC. Comparação dos resultados dos métodos de imunofluorescência indireta e ELISA indireto no diagnóstico sorológico da leishmaniose visceral canina realizado pelos laboratórios de Belo Horizonte, MG, Brasil. Vet Zootec. 2007;14(1):47-51.
12. Mancianti F, Falcone ML, Gianelli C, Poli A. Comparison between an enzyme-linked immunosorbent assay using a detergent-soluble Leishmania infantum antigen and indirect immunofluorescence for diagnosis of canine leishmaniasis. Vet Parasitol. 1995;59(1):13-21.
13. Neogy AB, Vouldoukis I, Silva AO, Tselentis Y, Lascombe JC, Segalen T, et al. Serodiagnosis and screening of canine visceral leishmaniasis in na endemic area of Corsica: applicability of a direct agglutination test and immunoblot analysis. Am J Trop
Med Hyg. 1992;47(6):772-7.
14. Nogueira YL. Estimativa de validade de um novo método de isolamento de vírus rábico. Rev Saude
Publica. 2004;38(2):315-22.
DOI:10.1590/S0034-89102004000200023
15 . Rosário EY, Genaro O, França-Silva JC, Costa RT, Mayrink W, Reis AB, et al. Evaluation of enzyme-linked immunosorbent assay using crude Leishmania and recombinant antigens as a diagnostic marker for canine for visceral leishmaniasis. Mem Inst Oswaldo
Cruz. 2005;100(2):197-203.
DOI:10.1590/S0074-02762005000200015
16 . Vercammen F, Berkvens D, Le Ray D, Jacquet D, Vervoort T. Development of a slide ELISA for canine leishmaniasis and comparison with four serological tests. Vet Rec. 1997;141(13):328-30.
REFERENCES
This article underwent the peer review process adopted for any other manuscript submitted to this journal, with anonymity guaranteed for both authors and reviewers. Editors and reviewers declare that there are no conflicts of interest that could affect their judgment with respect to this article.