Differentiating Benign from Malignant Sinonasal
Lesions: Feasibility of Diffusion Weighted MRI
Khaled M. El-Gerby
1Mohammad Waheed El-Anwar
21Radiodiagnosis Department, Faculty of Medicine, Zagazig University, Zagazig, Egypt
2Department of Otorhinolaryngology Head and Neck Surgery, Faculty of Medicine, Zagazig University, Zagazig, Egypt
Int Arch Otorhinolaryngol 2017;21:358–365.
Address for correspondence Mohammad Waheed El-Anwar, MD, Otorhinolaryngology Head and Neck Surgery Department, Faculty of Medicine, Zagazig University, Zagazig 0020552309843, Egypt (e-mail: [email protected]; [email protected]).
Introduction
Conventional MRI and CT are the chosen imaging modalities when evaluating head and neck cancers, unfortunately, the appearance of nasal masses on routine CT and MRI are not pathognomonic. Some benign lesions extend into adjacent structures mimicking malignancies. Additionally, routine imaging of the nasal masses does not allow pathological grading or distinguish between the various pathological types of nasal neoplasms.1
Diffusion weighted image (DWI) is a noninvasive technique which analyzes the structures of biologic tissues at a micro-scopic level. Apparent diffusion coefficient (ADC) value,
ob-tained from DWI, has been utilized to detect the differences in the microstructures of tumor tissues and non-tumor tissues.2,3 The aim of this study was to evaluate the diagnostic role of diffusion weighted MRI and ADC values in differentiating be-tween malignant and benign sinonasal lesions and its correlation with histopathological results as the reference standard.
Patients and Methods
This study took place in the departments of Radiodiagnosis and Otorhinolaryngology Head and Neck Surgery on patients with malignant and benign sinonasal lesions in the period Keywords
►
MRI
►
nose
►
tumor
►
sinusitis
►
CT scan
►
magnetic resonance
imaging
Abstract
Introduction
Appearance of nasal masses on routine CT and MRI are not
pathogno-monic. We utilized the apparent diffusion coef
fi
cient (ADC) value obtained from
diffusion weighted image (DWI) to detect the differences in the microstructures of
tumor and non-tumor tissues.
Objective
The objective of our study was to evaluate the diagnostic role of DWI and
ADC values in differentiating between malignant and benign sinonasal lesions and its
correlation with histopathological results as the reference standard.
Methods
Patients with nasal and / or paranasal mass underwent CT, MRI, and DWI
before any surgical intervention. We used diagnostic sinonasal endoscopy and biopsy to
con
fi
rm the diagnosis after MRI.
Results
When we used ADC value of (1.2
10
–
3 mm2/s) as a cut-off value for
differentiating benign from malignant sinonasal lesions, we achieved 90% accuracy,
100% sensitivity, 88.4% speci
fi
city, 77.8% positive predictive value, and 100% negative
predictive value. At this cut-off, benign lesions show statistically signi
fi
cant higher ADC
value than malignant tumors.
Conclusion
DW MRI and ADC value calculation are promising quantitative methods
helping to differentiate between malignant and benign sinonasal lesions. Thus, they are
effective methods compared with other conventional methods with short imaging time
thus it is recommended to be incorporated into routine evaluations.
received August 14, 2016 accepted October 6, 2016 published online January 4, 2017
DOI https://doi.org/ 10.1055/s-0036-1597323. ISSN 1809-9777.
Copyright © 2017 by Thieme Revinter Publicações Ltda, Rio de Janeiro, Brazil
from October 2011 to January 2015. We obtained informed written consent from the patients. We excluded from the study revision cases, patients from whom biopsies were taken or treated with radio- or chemotherapy prior to MRI, and patients with absolute contraindication to MRI, such as patients with cardiac peacemaker or aneurysmal clips.
Patients with nasal and / or paranasal mass were exposed to full history taken, nasal examination, and diagnostic endoscopy. They underwent CT and MRI before any surgical intervention. CT scan was axial and coronal non-contrast with 2–3 mm sections performed before surgical intervention. Diagnostic sinonasal endoscopy and biopsy was used to confirm the diagnosis after MRI.
Radiological Assessment
We performed radiological assessment comprising conven-tional pre- and post-contrast MRI.
Instructions and Preparation of the Patients
We asked patients to remove any ferromagnetic materials they might have on them, then fully explained the method of examination to patients before imaging and obtaining their consent. MR examination was performed at 1.5 tesla with a super conducting MR imager (Philips Medical Systems, Best, the Netherlands).
Conventional MRI Technique Pre and Post Contrast We conducted the examination using standard circular head coils with small fields of view and thin sections while the patient was in supine position. We performed an initial scout T1-weighted sagittal view to act as a localizer of subsequent slices, and then used multiple pulse sequences to obtain axial images followed by coronal and sagittal images based on the location of the pathology.
We obtained T1-weighted images (WI) with a repetition time (TR) of 500–600 milliseconds and echo time (TE) of 10 milliseconds and obtained T2-weighted images with TR of 4500 milliseconds and TE of 100ms. The intersection gap was 1–2mm and field of view (FOV) was generally 2025cm with 256256 matrix for axial images.
MRI protocol consisted of axial, coronal, and sagittal T1-weighed, T2-weighted, and contrast enhanced T1-weighted images. We used IV Gadolinium diethylene triamine penta acetic acid (GD-DTPA) in a dose of 0.1–0.2 mmol/kg BW as a contrast in all patients.
Diffusion Weighted MRI (DW- MRI) Examination Technique
All patients underwent DW- MRI, which was obtained using multi-section single shot spin echo EPI sequences. Imaging parameters (TR/TE: 4285/108 milliseconds), FOV of 2025 cm, acquisition matrix of 256256, and section thickness of 5 mm, with an interstice gap of 1–2 mm.
We applied diffusion-probing gradients in all three or-thogonal directions (x, y, and z) with the same strength. We acquired images with a diffusion-weighted b-factor of 0.500 and 1000 seconds per mm2 to obtain a precise ADC map.
Apparent diffusion coefficient (ADC) maps were generated for all images with b-values of 500 and 1000 seconds per mm2. The device automatically formed ADC maps with circular regions of interest (ROI)10 mm in diameter placed in the center of the lesion.
Histopathological Analysis
All patients were subjected to surgical or endoscopic biopsy and all specimens were sent to histopathology assessment. According to the histopathological analysis of the sinonasal lesions, masses were divided into benign (including infl am-matory and benign tumors) and malignant.
Statistical Analysis
Statistical analysis was done using SPSS (“Statistical Package for Social Science”) program version 16. The mean values for ADC were calculated for the each group. We used a one-way ANOVA test to compare results of more than two groups and Student’st-test to compare results between two groups. P value<0.05 was considered significant. We determined the ADC cut-off value for differentiating malignant from benign sinonasal lesions using the Kappa test. With confirmed benign lesions, we compared conventional T2 WI MRI to DWI and with confirmed malignant lesions; we compared post contrast images with DWI. We evaluated diagnostic accuracy of diffusion-weighted MRI in terms of sensitivity, specificity, accuracy, positive predictive value (PPV), and negative predictive value (NPV).
Results
This study included 24 patients with sinonasal masses. They were 8 women (33.3%) and 16 men (66.7%).Their ages ranged from 10 to 68 years with a mean of 38.5 years.
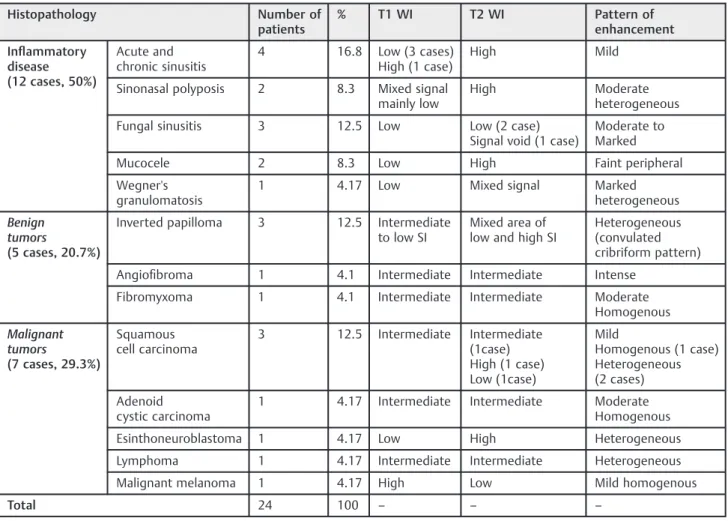
As for histopathology, the most common documented sinonasal diseases were inflammatory disease (12 cases, 50%) then inverted papilloma (3 cases, 12.5%), which repre-sented the most common benign tumors followed by squa-mous cell carcinoma (3 cases, 12.5%), which represented the most common malignant tumors (►Table 1).
According to MRI findings, most of inflammatory sino-nasal diseases displayed low SI in T1 WI and high SI in T2 WI (►Fig. 1), except fungal infection, which displayed low signal void SI in T2 WI (►Fig. 2), and Wegner's granulomatosis, which displayed mixed SI in T2 WI. All MRIs showed a significant pattern of enhancement with the exception of mucocele, which showed faint peripheral enhancement, an important feature that helps differentiate it from sinonasal neoplasm. Most of sinonasal neoplastic cases displayed in-termediate to low SI in T1WI and inin-termediate to high SI in T2 WI, except malignant melanoma, which displayed high SI in T1 WI and low SI in T2 WI. This may be due to hemorrhage and the paramagnetic effect of metals bound to melanin. All cases showed different patterns of enhancement (►Table 1).
Conventional MRI diagnosed 8 cases of malignant lesion, 5 of them proved to be malignant while the other three were benign according to histopathological examination. On the other hand, MRI diagnosed 16 cases of benign lesion, of which 14 were benign, while the other two cases were malignant on histopathology.
Therefore, sensitivity, specificity, and accuracy of conven-tional MRI in differentiating between benign and malignant sinonasal lesions were 71%, 82%, and 65%, respectively, while
positive predictive value (PPV) of conventional MRI was 62.5% and negative predictive value (NPV) was 87% (►Table 3).
Most of the benign sinonasal lesions (15/17) 88.2% ap-peared hypointense in (b¼500 & 1000) DW images and hyperintense in ADC maps; however, two benign lesions (one was Wegner’s granulomatosis and the other was inverted papilloma on histopathological examination) appeared hy-perintense in (b¼500 &1000) DW images and showed restricted diffusion on ADC map (►Fig. 3), whereas all Table 1 Histopathology of patients, MRI signal intensity, and pattern of enhancement of studied cases
Histopathology Number of
patients
% T1 WI T2 WI Pattern of
enhancement
Inflammatory disease (12 cases, 50%)
Acute and chronic sinusitis
4 16.8 Low (3 cases) High (1 case)
High Mild
Sinonasal polyposis 2 8.3 Mixed signal mainly low
High Moderate heterogeneous
Fungal sinusitis 3 12.5 Low Low (2 case) Signal void (1 case)
Moderate to Marked
Mucocele 2 8.3 Low High Faint peripheral
Wegner's granulomatosis
1 4.17 Low Mixed signal Marked heterogeneous
Benign tumors
(5 cases, 20.7%)
Inverted papilloma 3 12.5 Intermediate to low SI
Mixed area of low and high SI
Heterogeneous (convulated cribriform pattern)
Angiofibroma 1 4.1 Intermediate Intermediate Intense
Fibromyxoma 1 4.1 Intermediate Intermediate Moderate Homogenous
Malignant tumors
(7 cases, 29.3%)
Squamous cell carcinoma
3 12.5 Intermediate Intermediate (1case) High (1 case) Low (1case)
Mild
Homogenous (1 case) Heterogeneous (2 cases)
Adenoid cystic carcinoma
1 4.17 Intermediate Intermediate Moderate Homogenous
Esinthoneuroblastoma 1 4.17 Low High Heterogeneous
Lymphoma 1 4.17 Intermediate Intermediate Heterogeneous
Malignant melanoma 1 4.17 High Low Mild homogenous
Total 24 100 – – –
Abbreviation: WI, weighted image.
Table 2 MRI criteria suggestive of malignancy found in studied cases
MRI criteria Benign
(inflammatory and benign tumors) (N¼17)
Malignant (N¼7)
Unilateral sinus lesion 6 (35.5%) 7 (100%)
Bone involvement 4 (23.5%) 5 (71.4%)
Tumor necrosis 1 (5.8%) 4 (57.1%)
Soft tissue mass 2 (11.7%) 5 (71.4%)
Lymphadenopathy 3 (17.6%) 5 (71.4%)
Involvement of surrounding structures
4 (23.5) 5 (71.4%)
Table 3 Sensitivity, specificity, accuracy, positive predictive value (PPV), negative predictive value (NGV) of conventional MRI and diffusion MRI in differentiating between benign and malignant sinonasal lesions
Diffusion weighted
MRI at 1.2 ADC cut-off value
Conventional MRI
100% 71% Sensitivity
88.4% 82% Specificity
90% 65% Accuracy
77.8% 62.5% PPV
malignant sinonasal lesions (7/7) appeared hyperintense in (b¼500 &1000) DW images and hypointense in ADC maps. Malignant sinonasal lesions had lower mean ADC value than benign lesions (►Fig. 4), this difference was highly statisti-cally significant(p<0.0001) (►Table 4).
Diffusion Weighted MRI at ADC cut-off value of 1.2 had higher sensitivity, specificity, accuracy, PPV, and NPV than conventional MRI in differentiating between benign and malignant sinonasal lesions with high significant difference (p<0.0001) (►Table 3).
Fig. 1 Inflammatory sinusitis.(A, B)Coronal T1WI and Coronal T1W gadolinium-enhanced MR images reveal faint enhancement of the lesion that destroys the lateral wall of maxillary sinus extending into temporalis muscle with infra temporal extension, and roof of maxillary sinus extending into orbitalfloor obliterating high SI of orbital fat produce orbital cellulitis.(C)Axial DW image with b-value of 1000 second/mm2shows low signal intensity of the lesion denoting facilitated diffusion.(D)Axial ADC map image with b-value of 1000 second/mm2shows high signal intensity of the lesion denoting facilitated diffusion with ADC value is 2.210–3 mm2/ s. DWI & ADC value readings suggestive of benign lesion.
Table 4 Diffusion-weighted MRIfindings for the studied sinonasal lesions
Benign
(inflammatory and benign tumors) (N¼17)
Malignant (N¼7)
p
Signal intensity on images (b¼500 &1000)
Hyperintense 2 (11.8%) 7 (100%) –
Hypointense 15 (88.2%) 0
Signal intensity on ADC maps
Hyperintense 15 (88.2%) 0 –
Hypointense 2 (11.8%) 7 (100%)
Range 1.3110 3mm2/s to 2.7210 3mm2/s 0.8210 3mm2/s to 1.2710 3mm2/s)
Discussion
A broad spectrum of benign and malignant tumors and inflammatory lesions can affect the sinonasal region.4 Maxil-lary sinus squamous cell carcinoma (SCC) is the most common sinonasal malignancy. Small round blue cell tumors such as olfactory neuroblastoma, malignant melanoma, neuroendo-crine carcinoma, and lymphoma may be difficult distinguish from SCC and from benign and inflammatory lesions.5
The DWI is a noninvasive technique that is promising in differentiation between benign and malignant sinonasal masses and evaluating their functional activity based on the random translational motion of water protons, indirectly proportional to the diffusion barriers.2Structural changes in the tissues (benign or malignant) may result in different signals on DWI, which could be quantified by measuring the ADC values. The ADC value represents an objective parameter reflecting the tissue-specific diffusion capacity, which has already being used for tissue characterization and follow-up measurements.2
Generally, because malignant tumors have hyper cellular structure and enlarged nuclei, their water diffusion is re-stricted. Thus, low ADC values in malignant tissues could be attributed to the increase cellularity, restriction of intracellu-lar distance, and water diffusion restriction. Studies have reported that ADC values are related to the cellular density and mass secretion properties.6,7
Water constitutes 95% of sinonasal secretions, hence MRI SI of acutely inflamed mucosa are similar to water in their low SI in T1 WI and high SI in T2 WI, while chronic secretions vary influid and protein content, resulting in an increase of T1 WI signal from low to high and decrease in T2 WI signal from high to low.8MRI findings in fungal sinusitis depend on the high content of calcium, iron, and magnesium within fungal hyphae. Both iron and magnesium cause relevant shortening of T1 and T2 and therefore appear as hypointense signal void lesionsfilling sino-nasal cavity3with significant pattern of enhancement.11,12
This was in agreement with our results, where most of inflammatory sinonasal diseases displayed low SI in T1 WI and high SI in T2 WI except for fungal infection, which displayed low SI (2 cases), signal void in one case, and Wegner's granulomatosis displaying mixed SI. All showed significant pattern of enhancement of varying degree (mild-moderate-marked) except mucocele, which showed faint peripheral enhancement.
variable SI in both T1 and T2 with variable enhancement pattern depending on tumor cellularity and necrosis.3
This matches our results, where all cases presented the characteristic cribriform pattern of inverted papilloma and angiofibroma exhibited intense enhancement. On the other hand, malignant cases displayed intermediate to low SI in T1 WIs (6 cases) and intermediate to high SI in T2 WIs, except one case that pathologically proved to be malignant melanoma and displayed high SI in T1 WI and low SI in T2WI. This may be attributed to hemorrhage and paramagnetic effect of metals bound to melanin.9,10 Additionally, all malignant cases exhibit different patterns of enhancement, which was homogenous in four cases and heterogeneous in three.
In our study, MRI criteria suggestive of malignancy were unilateral sinus lesion, bone involvement, tumor necrosis, soft tissue mass, lymphadenopathy, and involvement of surrounding structures. These criteria were matched with Maeda et al.3We found that these criteria were absent in two malignant cases and found some of these criteria in benign cases, with variable percentage up to 35.5%. According to these criteria, when we used conventional contrast-enhanced MRI alone correlated with histopathologicalfindings, sensi-tivity and specificity of conventional contrast-enhanced MRI
in the differentiation between benign and malignant sino-nasal lesions were 71% and 82%, respectively.
Then, with the introduction of DWI with MRI, diagnostic accuracy improved the differential diagnosis between benign and malignant sinonasal lesions.2,11
In this study, we evaluated the potential of using echo-planar diffusion weighted MRI in the characterization of sinonasal lesions by determining their ADC values using b-values of 500 and 1000 second per mm2. The signal intensity of the sinonasal lesions in DW images and ADC maps varied according to histopathological type of sinonasal lesion. The evaluation with DWI showed that benign sinonasal lesions, including both inflammatory and benign tumors, appeared hypointense in (b¼500, 1000) DW images and hyperintense in ADC maps, while malignant sinonasal lesions were hyperintense on (b¼500, 1000) DW images and hypointense in ADC maps.
was highly statistically significant. These results agreed with Sasaki et al,10White et al,12and Razek et al.13
The mean ADC value for inflammatory lesions ranged from 1.5410 3 mm2/s to 2.7210 3 mm2/s, while that of benign tumors ranged from 1.310 3mm2/s to 1.810 3mm2/ s and there was no statistical difference in ADC value differen-tiation between inflammatory lesions and benign tumors. These results are in agreement with those of Sasaki et al.10
Although we could not significantly differentiate between different benign tumors on basis of ADC value measurement, we found that benign vascular tumor as juvenile angiofi -broma had higher ADC value (1.810 3 mm2/s) than other benign solid tumors, such as inverted papilloma with ADC value¼1.6410 3 mm2/s, with no statistical significant difference.
These results matched those of Sasaki et al,10who found that there were no significant differences in the overall ADC and ADC mapping between inverted papilloma, angiofi -broma, and hemangioma. Moreover, ourfindings matched those of Razek et al13and Sakamoto et al,14who found that angiofibroma had a higher ADC value than other solid neo-plasms. This is due to excess extracellular spaces and free diffusion within vascular lesions.10,14In addition, the
perfu-sion of bloodflow and susceptibility effects brought about by hemosiderin deposition may also affect ADC values.
In our study, the mean ADC value of malignant sinonasal tumors was 1.7310 3mm2/s and the mean ADC value of SCC was 1.1410 3mm2/s, adenoid cystic carcinoma was 1.1710 3mm2/s, esinthoneuroblastoma was 0.9510 3 mm2/s, lymphoma was 0.75
10 3mm2/s, and malignant melanoma was 0.8410 3mm2/s. We found that lymphoma had lower ADC value than other malignant tumors with non-significant difference (p¼0.54).
These were similar to those mentioned by Maeda et al3and Sumi et al.11They explained that DWI and ADC value were related to tumor cellularity and attributed the reduced ADC value in lymphoma to increased cellularity and reduced extracellular space.
In our study, when we used ADC value of 1.210 3mm2/s as a cut-off value for the differentiation of benign sinonasal lesions from malignant, with an accuracy rate of 90%, 100% sensitivity, 88.4% specificity, 77.8% PPV, and 100% NPV, we found the cut-off point to be highly statistically significant (p¼0.0001).
Sasaki et al10reported an ADC cut-off point of 0.8410–3 mm2/s was the best to distinguish benign/ in
flammatory from Fig. 4 Malignant melanoma case.(A, B)Coronal T1WI Coronal T1W gadolinium-enhanced MR images reveal mild homogenous enhancement of the mass.(C)Axial DW image with b-value 1000 seconds/mm2shows high signal intensity of the lesion denoting restricted diffusion.(D)Axial ADC map image with b-value of 1000 second/mm2shows low signal intensity of the lesion denoting restricted diffusion with ADC value of 0.84
malignant tumors with diagnostic ability of 61% sensitivity, 94% specificity, 79% accuracy, 90% PPV, and 74% NPV.
Razek et al13used an ADC value of 1.5310 3 mm2/s as the threshold for differentiating malignant from benign lesions, and the best result they obtained had an accuracy of 93%, sensitivity of 94%, specificity of 92%, PPV of 92%, and NPV of 94%.
White et al12did not use an ADC cut-off point for differen-tiation between benign and malignant lesions, but they found that the ADCs of the malignancies were significantly lower than the benign lesions (p<0.0125). The ADCs were inversely correlated with tumor cellularity.
In our study, the small number of lesions included in each group might affect the results. Thus, a multicenter study with large number of cases is needed.
Conclusion
When using the ADC value of 1.210 3mm2/s as a cut-off point for the differentiation between benign and malignant sinonasal lesions, we achieve 90% accuracy, 100% sensitivity, 88.4% specificity, 77.8 PPV, and 100% NPV. At this cut-off point, benign lesions show statistically significant higher ADC value than malignant tumors.
DW, MRI, and ADC value calculations are promising quan-titative methods that help distinguish between malignant and benign sinonasal lesions. They are effective methods compared with other conventional methods with short imaging time and can be easily incorporated into routine evaluations. However, further studies with a larger number of cases are needed.
Conflict of Interest and Financial Disclosure
The authors declare nofinancial support to this study and declare no conflict of interest.
References
1 Connor S, Hussain S, Woo E. Sinonasal imaging. Eur J Radiol 2007; 19:39–54
2 Wang J, Takashima S, Takayama F, et al. Head and neck lesions: characterization with diffusion-weighted echo-planar MR imag-ing. Radiology 2001;220(3):621–630
3 Maeda M, Kato H, Sakuma H, Maier SE, Takeda K. Usefulness of the apparent diffusion coefficient in line scan diffusion-weighted imaging for distinguishing between squamous cell carcinomas and malignant lymphomas of the head and neck. AJNR Am J Neuroradiol 2005;26(5):1186–1192
4 Barnes L, Brandwein M, Som PM. Diseases of the nose, paranasal sinuses, and nasopharynx,. in Barnes L (ed): Surgical Pathology of the Head and Neck (ed 2). New York, NY: Marcel Decker; 2001:439–55
5 Loevner LA, Sonners AI. Imaging of neoplasms of the paranasal sinuses. Neuroimaging Clin N Am 2004;14(4):625–646
6 Lyng H, Haraldseth O, Rofstad EK. Measurement of cell density and necrotic fraction in human melanoma xenografts by diffusion weighted magnetic resonance imaging. Magn Reson Med 2000; 43(6):828–836
7 Eggesbø HB. Radiological imaging of inflammatory lesions in the nasal cavity and paranasal sinuses. Eur Radiol 2006;16(4):872–888
8 Madani G, Beale TJ. Sinonasal inflammatory disease. Semin Ultra-sound CT MR 2009;30(1):17–24
9 Schaefer PW, Grant PE, Gonzalez RG. Diffusion-weighted MR imaging of the brain. Radiology 2000;217(2):331–345
10 Sasaki M, Eida S, Sumi M, Nakamura T. Apparent diffusion coeffi -cient mapping for sinonasal diseases: differentiation of benign and malignant lesions. AJNR Am J Neuroradiol 2011;32(6):1100–1106
11 Sumi M, Ichikawa Y, Nakamura T. Diagnostic ability of apparent diffusion coefficients for lymphomas and carcinomas in the phar-ynx. Eur Radiol 2007;17(10):2631–2637
12 White ML, Zhang Y, Robinson RA. Evaluating tumors and tumor-like lesions of the nasal cavity, the paranasal sinuses, and the adjacent skull base with diffusion-weighted MRI. J Comput Assist Tomogr 2006;30(3):490–495
13 Razek AA, Sieza S, Maha B. Assessment of nasal and paranasal sinus masses by diffusion-weighted MR imaging. J Neuroradiol 2009; 36(4):206–211