Eduardo ChachamovichI
Marcelo P FleckI
Clarissa TrentiniI
Mick PowerII
I Programa de Pós-Graduação em Psiquiatria.
Universidade Federal do Rio Grande do Sul. Porto Alegre, RS, Brazil
II Clinical and Health Psychology. University
of Edinburgh Medical School. Edinburgh, UK
Correspondence: Eduardo Chachamovich Rua Florêncio Ygartua, 391/308 90430-010 Porto Alegre, RS, Brazil E-mail: [email protected] Received: 6/6/2007
Approved: 5/31/2007
Brazilian WHOQOL-OLD
Module version: a Rasch
analysis of a new instrument
Versão em português do Módulo
WHOQOL-OLD: análise de Rasch de
um novo instrumento
ABSTRACT
OBJECTIVE: To evaluate the Brazilian version of WHOQOL-OLD Module
and to test potential changes to the instrument to increase its psychometric adequacy.
METHODS: A total of 424 older adults living in a city in Southern Brazil
completed the WHOQOL-OLD instrument, in 2005. Rasch analysis was used to explore the psychometric performance of the scale, as implemented by the RUMM2020 software. Item-trait interaction, threshold disorders, presence of differential item functioning and item fi t, were analyzed.
RESULTS: Two (“death and dying” and “sensory abilities”) out of six
domains showed inadequate item-trait interactions. Rescoring the response scale and deleting the most misperforming items led to scale improvement. The evaluation of domains and items individually showed that the “intimacy” domain does perform well in contrast to the fi ndings using the classical approach. In addition, the “sensory abilities” domain does not derive an interval measure in its current format.
CONCLUSIONS: Unidimensionality and local independence were seen in
all domains. Changes in the response scale and deletion of problematic items improved the scale’s performance.
The world has been experiencing a profound and ir-reversible demographic shift as older people are liv-ing longer and healthier than ever before.24 The most
dramatic increases in proportions of older people are evident in the most advanced age groups (people over 80 years old) with an almost fi vefold increase from 69 million in 2000 to 377 million in 2050.24 The World
Health Organization (WHO) has described this demo-graphic shift as a major societal achievement, and a challenge25. Increased longevity has been experienced
in the developed and the developing world alike, but where developed countries grew rich before it grew old, developing countries are growing old before they have grown rich.25
This shift in the age pyramid due to increased elderly population demands further research specifi cally ap-proaching the aging process. One important area to be assessed is quality of life. Although there are several studies on this issue, systematic reviews have pointed out that the instruments most frequently used in these investigations are not sufficiently comprehensive and/or are not validated for application in older adult populations.4,11
RESUMO
OBJETIVO: Analisar a versão brasileira do Módulo WHOQOL-OLD,
indicando alterações potenciais do instrumento para aumentar a adequação psicométrica.
MÉTODOS: O total de 424 idosos residentes em Porto Alegre, RS,
responderam o instrumento WHOQOL-OLD em 2005. O modelo de Rasch foi utilizado para a análise do desempenho psicométrico da escala, a partir do
software RUMM2020. Foram analisadas a interação item-traço, a presença
de funcionamento diferencial dos itens e a adequação dos itens ao modelo de Rasch.
RESULTADOS: Dois domínios (“morte e morrer” e “funcionamento do
sensório”) apresentaram interação item-total insufi ciente. Remodelar a escala de resposta e excluir itens com pior performance resultou em melhora da escala. A análise dos domínios e itens individualmente foi capaz de indicar que o domínio “intimidade” teve boa performance, ao contrário dos resultados gerados pela abordagem psicométrica clássica. O domínio “funcionamento dos sentidos” não fornece uma medida intervalar em seu formato atual.
CONCLUSÕES: Todos os domínios apresentaram unidimensionalidade e
independência local. As alterações na escala de resposta e a exclusão de itens problemáticos determinaram melhora da performance da escala.
DESCRITORES: Saúde do Idoso. Questionários. Qualidade de Vida. Psicometria. Validade dos Testes.WHOQOL-OLD. Rasch.
INTRODUCTION
The WHO Quality of Life Group has recently developed the WHOQOL-OLD Module.16 Through a simultaneous
transcultural methodology, this instrument is designed to be suitable for cross-cultural comparisons. In addi-tion, it was developed to specifi cally assess quality of life of the elderly, thus ensuring that important areas concerning old age are covered by the instrument. Its comprehensiveness is sustained by an initial intense qualitative phase.7,10 The WHOQOL-OLD module
rep-resents an additional tool, alongside the WHOQOL-100 or WHOQOL-BREF, and it is a useful alternative in the investigation of quality of life in older adults, including relevant aspects not covered by instruments originally designed for non-elderly populations.
The validation of the Brazilian version of the WHO-QOL-OLD Module is reported in detail elsewhere.8
Briefl y, it involved classic psychometric approach to analyze internal consistency, discriminant validity, criterion validity, concurrent validity and test-retest reliability. The fi ndings indicated suitable psychometric properties for this version.
examining instrument performance in depth, allowing both the instrument as whole and individual items to be assessed. In addition, the Rasch model is also helpful for providing potential solutions for misperforming instru-ments. It is suggested that combining both traditional and modern psychometric approaches is a valuable strategy to enhance power of validation processes.20
Furthermore, the use of the Rasch measurement model for the development and application of quality of life instruments has been increasingly stressed.16,19,21
The present study aimed at evaluating the Brazilian version of the WHOQOL-OLD Module using a modern psychometric approach and testing potential changes to the instrument in order to increase its psychometric adequacy.
METHODS
The data collected for the original classic validation8
was also analyzed in this study. A minimum sample of 300 subjects stratifi ed by gender (50% women and 50% men), age (60–69 years, 70–79 years and over 80) and self-perceived health status (50% considering them-selves healthy and 50% unhealthy) was selected at a uni-versity hospital, nursing homes, and in the community according to the WHOQOL-OLD project. Convenience sampling was used. The stratifi cation process provided minimum subsamples that allowed for the assessment of the instrument under different conditions.
Inclusion criteria were age 60 or above and clinical ability to understand and respond to the instruments administered. Subjects were required to answer the question “In general, do you consider yourself healthy or unhealthy?,” and were later stratifi ed as healthy or unhealthy exclusively according to their subjective self-perception, regardless of their actual objective health status. This methodology is based on the theoretical background for quality of life instruments developed by the WHO, where the quality of life construct is seen as multidimensional and basically subjective23.
Subjects completed a sociodemographic information form, the WHOQOL-OLD Module and the Geriatric Depression Scale 15-item version.18 The
WHOQOL-BREF instrument was also part of the assessment, and its psychometric performance is reported elsewhere.4
The sociodemographic information form included questions about gender, age, educational level, marital status, subjective self-perception of health status, and consumption of alcohol, tobacco and illegal substances. The data obtained from this questionnaire was utilized for demographic description, as well as for differential item functioning (DIF) analysis.
The WHOQOL-OLD is a 24-item self-report instru-ment. It is divided into six domains (sensory abili-ties, autonomy, past-present-future activiabili-ties, social
participation, death and dying and intimacy). Each domain provides an individual score. In addition, an overall score is calculated from the set of 24 items. Answers are based on a 5-point Likert response scale.16
It is validated in Brazilian Portuguese, and this version presents good classic psychometric performance.8
Data was examined by way of the Rasch model using RUMM 2020 software.3 Linacre states that the ideal
sample size varies according to the scale targeting. For a well-targeted scale (40–60% endorsement rates on dichotomous items), a sample size of 108 would have a 99% confi dence of person estimation of +0.5 logits. For non well-targeted scales, though, a minimum sample size for satisfactory estimations would be 243 subjects.13
The Rasch model is understood as a template which puts into operation the axioms for additive conjoint measurement.14 This theory presents a set of
meth-ods to determine whether a variable has an additive structure and, then, is amenable to be measured on an interval scale.17 Originally developed to be applied in
dichotomous scales, the Rasch model is also applicable to polytomous data.1
Basically, the Rasch model assumes that the probability of a given subject endorsing an item is a function of the relative distance between the item location and the person location on a linear common scale15. In the
case of a scale measuring depression, for example, the probability that a person is endorsing an item is a logistic function of the difference between the subject’s ability (level of depression) and the level of depres-sion expressed by the item. The following equation illustrates this statement:
1n⎛⎜
⎝ = θn – bi Pni
1 – Pni ⎞ ⎟ ⎠
where ln is the normal log, P is the probability of a person n to endorse the item, θ is the person’s level of ability and b is the level of ability expressed by the item. If the data fi ts the Rasch model, then both the person’s ability and item diffi culty will be placed in a common metric scale (log-units scale or logit), which allows a linear transformation of the raw scale. Thus, when the data fi ts the model, and the assumptions of local independence are met, the scale is then suitable for valid parametric approaches.14 Since the Rasch
analysis is strongly dependent on unidimensionality, each one of the six WHOQOL-OLD domains was tested individually as separated scales.15
If Rasch assumptions are satisfi ed, and the scale fi ts the expected model, then it is also guaranteed that the performance of the instrument is stable and not dependent on the sample being assessed, or on certain characteristics such as gender or age, which is called specifi c objectivity.21
First, overall fi t statistics were examined. An item-trait interaction was analyzed using the chi-square test, which indicates the invariance property if p-value is not signifi cant (thus indicating similarity between expected and observed models). The standardized distributions of items and persons were examined by way of a diagram.
Furthermore, individual item statistics were analyzed for residuals and chi-square statistics. Again, if a de-termined item fi ts the model, low residual (+2.5) and non-signifi cant chi-square statistics are expected. Bon-ferroni correction was applied to control for multiple test effects. Threshold disorders were also examined using threshold maps and category probability curves for each individual item.
An estimate of internal consistency was also obtained through the person separation index (PSI), which is comparable to the Cronbach’s alpha coeffi cient. Items were examined for DIF. The presence of DIF indicates that a subgroup (e.g., males or young adults) has a consistent way of responding to an item, despite hav-ing the same amount of the latent trait. Both uniform DIF (when the difference is constant through the whole range of the item curve) and non-uniform DIF (when the difference occurs only at a certain level of attribute) were checked.
Finally, modifi cations were tested when fi t statistics indicated misfi t. Item rescoring and deletion were carried out in order to achieve the best item structure possible.
All respondents were informed about the objectives of the study and confi dentiality of the data obtained. Subjects signed an informed consent approved by the Research Ethics Committee of the university hospital where the study was carried out.
RESULTS
The sample comprised 424 subjects and its characteris-tics are described in Table 1. The Geriatric Depression Scale means and standard deviation (SD) indicate that the sample is predominantly non-depressed. In addition, around two thirds of the subjects perceived themselves as being healthy, despite their objective health condi-tion. Subjective self-perception is known to be related to depression levels. Thus, the high rate of “healthy” subjects may be considered an indirect effect of low depression levels in the sample.
As for Rasch analysis results, the verifi cation for miss-ing values showed that only items 1 and 3 had extremely low missing value rates (between 0.2% and 0.4%). The distributions of responses across the fi ve points did not show major problems. These fi ndings corroborate the high responsiveness of the WHOQOL-OLD in a Brazilian sample. It is likely that the close assistance research staff offered to subjects during data collection is somehow related to the unexpected low number of missing values. Table 2 shows item contents, missing values, medians and distributions.
The item-trait interaction was analyzed for the six do-mains individually through chi-square statistics. This test aims at checking whether the observed model (i.e., the data collected) fi ts the expected model (based on a probabilistic adaptation of Guttmann scale).2 Thus, as
Kline states, it is primarily a test of “badness-of-fi t,” since statistical positive results (p-values above the critical one, after Bonferroni correction) indicate that the observed model is different from the expected.12
The “death and dying” domain had an inadequate result (domain χ2 = 51.72, p=0.00012). The “sensory abilities”
domain also showed high chi-square results (domain
χ2 =101.10 and p=0.0000).
Table 1. Demographic characteristics of the study sample. Porto Alegre, Southern Brazil, 2005. (N=424)
Characteristic N (%) or M (SD)
Age (years)
60–69 173 (40.9)
70–79 153 (36.2)
≥80 97 (22.9)
Gender
Male 152 (35.8)
Female 272 (64.2)
Self-perceived health status
Healthy 286 (67.5)
Unhealthy 138 (32.5)
Marital status
Single 29 (6.8)
Married 212 (50.0)
Separated 30 (7.1)
Widowed 128 (30.2)
Educational level
Illiterate 7 (1.7)
Elementary/Middle school 165 (38.9)
High school 110 (25.9)
College 90 (21.2)
Depression level
GDS 15 (Mean, SD) 3.99 (2.91)
Local dependence was examined for the six domains and the 24-item set. A correlation of residuals for all items was carried out. Coeffi cients equal to or higher than 0.3 were considered indicators of local depen-dence. No dependence was found for any domain or the overall scale.
Items 4, 5, 9 and 20 showed reversed threshold. Thresholds indicate the point where there is exactly a probability of 0.50 that a subject will respond to
the item between a certain response category and the adjacent one. Threshold disorders, thus, suggest that the response scale is not effi cient to discriminate between two ability levels, so that subjects with more ability could respond in the same category as another with lower ability. In other words, the response scale would not be working adequately to order subjects with distinct levels of ability. These items were examined and rescored according to the point of the disorder in
Table 2. WHOQOL-OLD items descriptions. Porto Alegre, Southern Brazil, 2005. (N=424)
Domain / item Mean SD MV(%) Distribution Skew Kurt
1 2 3 4 5
Sensory abilities
1 Impairments to senses affect daily life 3.89 1.1 0.2 2.4 11.8 20.8 24.1 40.9 –0.663 –0.641
2 Loss of sens. abilities affect participation
in activities 4.05 1.0 0.0 1.4 10.6 17.0 23.3 47.6 –0.853 –0.400
3 Problems with sens. functioning affect
ability to interact 4.06 1.2 0.2 6.4 5.9 14.4 22.0 51.3 –1.18 0.392
4 Rate sensory functioning 3.78 0.85 0.0 0.7 6.6 25.5 48.1 19.1 –0.486 0.061
Autonomy
5 Freedom to make own decisions 3.90 0.96 0.2 2.4 9.0 10.6 52.2 25.8 -1.04 0.862 6 Feel in control of your future 3.34 1.0 0.0 6.4 16.5 26.4 38.4 12.3 –0.424 –0.524 7 People around you are respectful of your
freedom 3.80 0.89 0.0 1.7 7.5 19.1 52.6 19.1 –0.804 0.655
8 Able to do things you’d like 3.50 1.0 0.0 2.8 13.4 34.9 29.0 19.8 –0.195 –0.593 Past, present and future activities
9 Satisfi ed with opportunities to continue
achieving 3.37 1.0 0.0 4.5 16.5 30.2 34.9 13.9 –0.304 –0.528
10 Received the recognition you deserve
in life 3.63 0.95 0.0 3.1 8.5 26.4 46.2 15.8 –0.664 0.306
11 Satisfi ed with what you’ve achieved
in life 3.96 0.85 0.0 0.7 6.4 15.1 52.1 25.7 0.852 0.654
12 Happy with things to look forward to 3.71 0.77 0.0 1.4 3.3 30.4 52.8 12.0 0.774 1.09 Social participation
13 Have enough to do each day 3.53 0.95 0.0 2.6 10.6 32.5 39.4 14.9 0.957 –0.130 14 Satisfi ed with the way you use your time 3.72 0.89 0.0 1.2 11.1 17.7 55.0 15.1 0.894 .266 15 Satisfi ed with level of activity 3.62 0.98 0.0 2.4 13.7 19.8 48.1 16.0 0.987 –0.162 16 Satisfi ed with opportunity to participate
in community 3.49 0.96 0.0 1.9 12.7 34.7 35.6 15.1 0.960 –0.409
Death and dying
17 Concerned about the way you will die 3.71 1.2 0.0 3.5 17.9 18.4 24.3 35.8 1.22 –0.989 18 Afraid of not being able to control death 3.81 1.2 0.0 3.1 17.7 16.0 21.9 41.3 1.23 –0.964
19 Scared of dying 3.86 1.2 0.0 3.3 14.4 17.7 22.6 42.0 1.20 –0.746
20 Fear pain before death 2.87 1.2 0.2 12.5 36.6 19.1 15.1 16.5 1.29 –1.04
Intimacy
21 Feel a sense of companionship in life 3.60 1.0 0.4 7.1 7.6 20.6 47.4 17.3 1.08 0.309 22 Experience love in your life 3.88 0.93 0.4 3.8 5.0 13.0 56.2 22.0 0.937 1.78
23 Opportunities to love 3.62 1.1 0.4 6.6 8.8 20.9 43.1 20.6 1.10 0.056 24 Opportunities to be loved 3.55 0.94 0.4 5.0 11.4 25.4 40.8 17.5 1.06 –0.173
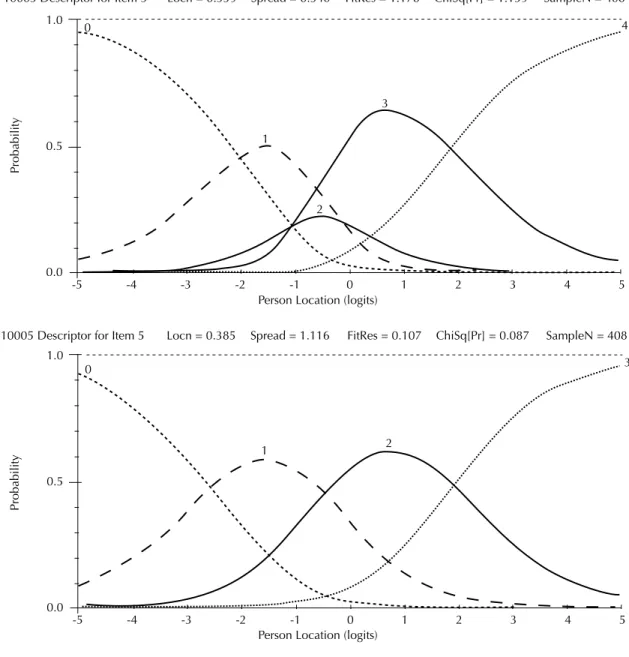
the response scale. For the items 4, 5 and 9, response categories two and three were merged into one. For the item 20, categories three and four were collapsed (values for the original instrument).
Figure 1 illustrates the category probability curves of the item 5 in its 5-point original form and after rescor-ing. One can see that the original form presents reversed thresholds (i.e., category number 2 is not endorsed at any point). After rescoring, categories are well distrib-uted. The RUMM2020 software3 automatically renames
the categories in order to assign the value 0 for the fi rst category. In the instrument, however, the categories range from 1 to 5.
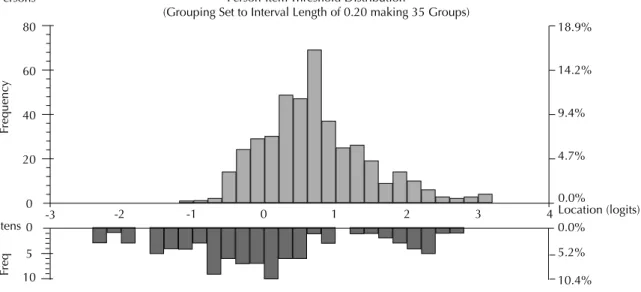
The distributions of persons and item thresholds are illustrated in Figure 2. Persons’ locations are placed on the top half of the chart. The mean person location value was 0.719 (SD=0.744). This is slightly above the average scale items (which would be zero logits). Threshold distribution is located on the bottom half of the chart. The scale’s peak of information (if taken as a 24-item set) is located between 0 and -1 logits. However, thresholds adequately cover all the range of ability, which ensures that the scale is able to provide information for all levels.
DIF was assessed by gender (male and female) and age (60 to 79 years and 80 or older). Item bias indicates that
Figure 1. Item 5 Category Probability Curves in original response scale (above) and after (below) rescoring. Porto Alegre, Southern Brazil, 2005. (N=408)
Person Location (logits)
Person Location (logits) 10005 Descriptor for Item 5 Locn = 0.339 Spread = 0.540
Probability
FitRes = 1.178 ChiSq[Pr] = 1.159 SampleN = 408
1.0
0.5
0.0
-5 -4 -3 -2 -1 0
0
1 1
2 2
3 3
4
4
5
Probability
10005 Descriptor for Item 5 Locn = 0.385 Spread = 1.116 FitRes = 0.107 ChiSq[Pr] = 0.087 SampleN = 408 1.0
0.5
0.0
-5 -4 -3 -2 -1 0
0
1 1
2 2
3
3
item performance is not homogeneous and, thus, has distinct performance on different subjects when control-ling for the level of underlying construct measured by the test.6 As a result, scores obtained from an item with
DIF are not comparable across populations. Items were analyzed for uniform and non-uniform DIF. Briefl y, the former is related to a constant difference of functioning through the entire spectrum of the construct, while the latter indicates that the DIF is seen only in a certain part of the curve.5 Uniform DIF items can be either excluded
from the scale or, alternatively, be used to create two different scales (and then the item would have distinct weights in each).22
Item 3 (“sensory abilities” domain) showed uniform DIF for age. No DIF was found for other items. The fi rst step in the scale modifi cation was rescoring re-sponse categories. Besides solving threshold disorders, the item-trait interaction showed improvement for the “sensory abilities” domain (original χ2 =142.44; and
after rescoring χ2 =93.32). This improvement was not
suffi cient to adjust this domain to the expected model. Item 3 showed differential functioning, as well as misfi t of chi-square test and residuals. These three statistics suggest that item 3 is not performing according to the expected Rasch model. Thus, item 3 was deleted and the domain was then re-examined. The item-trait interaction showed improvement (χ2 changed from
93.32 to 59.28). However, the model after deleting is still misfi tting.
The “death and dying” domain also showed item-trait interaction misfi t in its original format (χ2 =60.03).
Rescoring item 20 resulted in improvement of the model (χ2 =51.72). At this stage, values were still
non-signifi cant, indicating persistent misfi t. Deletion of item
18 (which presented high chi-square results) resulted in an adjusted structure.
Table 3 describes the fi t statistics for the refi ned WHO-QOL-OLD version.
DISCUSSION
The WHOQOL-OLD Module was developed through a simultaneous transcultural methodology, which is able to include different cultural contexts from the fi rst steps of the instrument construction.9 This is regarded as a
major characteristic of the WHOQOL-OLD.16
In addition to the theoretical design, it is also crucial that a new international measure is adequately vali-dated. This ensures that the original strengths of the instrument remain in the new version in a different language. The validation of a scale or instrument is a longitudinal process and ideally should involve its testing in distinct contexts.
The combination of different psychometric approaches for the validation or development of a new measure is supported in the literature. Particularly, it has been argued that the Rasch measurement model is able to add important input, since it puts into operation the axioms for additive conjoint measurement.14 Using
both traditional and Rasch analyses seem to be a useful strategy and provide relevant insight regarding scale performance.16,20
The fi ndings of the present study are in line with the results previously reported through classical psycho-metric theory.8 The “sensory abilities” domain showed
inadequate performance in multiple linear regression analyses in previous studies. The Rasch analysis corroborated the domain misfi tting. The “intimacy”
Figure 2. Person item distribution chart for the WHOQOL-OLD scale. Porto Alegre, Southern Brazil, 2005. (N=408) Person-Item Threshold Distribution
(Grouping Set to Interval Length of 0.20 making 35 Groups) 80
60
40
20
0
0 1 2 3 4
-1 -2
-3 0
5
10
18.9%
14.2%
9.4%
4.7%
0.0%
Location (logits) 0.0%
5.2%
10.4% Persons
Itens
Frequen
cy
domain, however, showed misperformance in the classi-cal psychometric approach (multiple linear regression), but not in Rasch analysis. This discrepancy indicates that the domain itself functions well as a set, and the items show satisfactory performance. It is suggested the previous fi ndings are due to limitations of the multiple linear regression, particularly the choice of a suitable dependent variable.
Rescoring and item deletion has not resulted in ad-equate improvement in the “sensory abilities” domain.
Interestingly, item rescoring and deletion signifi cantly improved the performance of the “death and dying” domain. After these changes, the model statistics fi t the Rasch model.
These potential changes should not produce crucial modifi cations in the scale format, since they can be made during the statistical analysis phase and not necessarily in the data collection stage. Replications of these fi ndings in different samples are needed to confi rm the results.
Table 3. Fit statistics for the refi ned WHOQOL-OLD Module. Porto Alegre, Southern Brazil, 2005. (N=424)
Domain / item Domain χ2 Fit p-value PSI
Item χ2 Fit
Item Residual
DIF Gender*
DIF Age*
Sensory abilities 59.28 0.0000* 0.737
Impairments to senses affect daily life 21.615* -1.355 0.023
Rate sensory functioning 26.712* -0.342 –0.11
Problems with sensory functions affect
ability to interact 10.954* 0.684 0.087
Autonomy 34.11 0.082 0.713
Freedom to make own decisions 11.06 –0.107 –0.385
Feel in control of your future 11.443 0.242 0.584
Able to do things you’d like to 7.159 2.101 0.078
People around you are respectful of
your freedom 4.478 0.237 –0.277
Past, present and future activities 27.92 0.262 0.788
Happy with things to look forward to 13.138 –0.167 –0.027
Satisfi ed with opportunities to continue
achieving 4.943 –1.906 0.53
Received the recognition you deserve
in life 3.5 0.909 0.169
Satisfi ed with what you’ve achieved in
life 6.35 1.115 –0.672
Social participation 28.69 0.095 0.812
Satisfi ed with the way you use your time 7.709 –2.094 –0.292
Satisfi ed with level of activity 10.976 –2.308 0.008
Have enough to do each day 6.672 2.565 0.166
Satisfi ed with opportunity to participate
in community 3.277 1.068 0.118
Death and dying 30.90 0.017 0.800
Concerned about the way you will die 15.92* –0.93 –0.351
Scared of dying 11.53 –0.75 –0.507
Fear pain before death 3.44 2.22 0.858
Intimacy 14.85 0.535 0.867
Feel a sense of companionship in life 1.995 0.886 0.241
Experience love in your life 8.183 –2.101 –0.537
Opportunities to love 3.44 –2.37 0.116
Opportunities to be loved 1.232 0.383 0.18
Overall score (24 items) 563.30 0.0000* 0.889
1. Andrich D. Rating formulation for ordered response categories. Psycometrika. 1978;43(4):561-573
2. Andrich D. Rasch models for measurement. London: Sage University Paper; 1988.
3. Andrich D, Lyne A, Sheridan B, Luo G. RUMM 2020. Perth: RUMM Laboratory; 2003.
4. Chachamovich E, Trentini C, Fleck MP. Assessment of the psychometric performance of the WHOQOL-BREF instrument in a sample of Brazilian older adults. Int Psychogeriatr. 2006;19(4):635-46.
5. Crane PK, Gibbons LE, Jolley L, van Belle G, Selleri R, Dalmonte E, et al. Differential item functioning related to education and age in Italian version of the Mini-Mental State Examination. Int Psychogeriatr. 2006;18(3):505-15.
6. Crane PK, Gibbons LE, Narasimhalu K, Lai JS, Cella D. Rapid detection of differential item functioning in assessments of health-related quality of life: the functional assessment of cancer therapy. Qual Life Res. 2007;16(1):101-14.
7. Fleck MPA, Chachamovich E, Trentini CM. Projeto WHOQOL-OLD: método e resultados de grupos focais no Brasil. Rev Saude Publica. 2003;37(6):793-9
8. Fleck MPA, Chachamovich E, Trentini C. Development and validation of the Portuguese version of the WHOQOL-OLD module. Rev Saude Publica. 2006;40(5):785-91.
9. Guillemin F. Cross-cultural adaptation and validation of health status measures. Scand J Reumathol. 1995;24(2):61-3.
10. Hawthorne G, Davidson N, Quinn K, McCrate F, Winkler I, Lucas R, et al. Issues in conducting cross-cultural research: implementation of an agreed international procotol designed by the WHOQOL Group for the conduct of focus groups eliciting the quality of life of older adults. Qual Life Res. 2006;15(7):1257-70.
11. Haywood KL, Garrat AM, Fitzpatrick R. Quality of life in older people: A structured review of generic self-assessed health instruments. Qual Life Res. 2005;14(7):1651-68.
12. Kline RB. Principles and practice of structural equation modelling. 2. ed. New York: Guilford Press; 2005.
13. Linacre JM. Sample size and item calibration stability. Rasch Meas Trans. 1994;7(4):328.
14. Pallant J, Miller R, Tennant A. Evaluation of the Edinburgh Post Natal Depression Scale using Rasch analysis. BMC Psychiatry.,2006;6:28
15. Pallant J, Tennant A. An introduction to the Rasch measurement model: an example using the Hospital Anxiety and Depression Scale (HADS). Br J Clin Psychol., 2007;46(Pt 1):1-18.
16. Power M, Quinn K, Schmidt S, WHOQOL-OLD Group. Development of the WHOQOL-Old module. Qual Life Res. 2005;14(10):2197-214.
17. Rasch G. Probabilistic models for some intelligence and attainment tests. Chicago: University of Chicago Press; 1960.
18. Sheikh JI, Yesavage JA. Geriatric Depression Scale (GDS): recent evidence and development of a shorter version. Clin Gerontol. 1986;37:819-20.
19. Swaine-Verdier A, Doward LC, Hagell P, Thorsen H, McKenna SP. Adapting quality of life instruments. Value in Health. 2004;7(Suppl 1):S27-30.
20. Tammaru M, McKenna SP, Meads DM, Maimets K, Hansen E. Adaptation of the rheumatoid arthritis quality of life scale for Estonia. Rheumatol Int. 2006;26(7):655-62.
21. Tenant A, McKenna SP, Hagell P. Application of Rasch analysis in the development and application of quality of life instrument. Value Health. 2004;7(Suppl 1):S22-6.
22. Tennant A, Pallant JF. Unidimensionality matters! (A tale of two Smiths?). Rasch Meas Trans. 2006;20:1048-51.
23. The World Health Organization quality of life assessment (WHOQOL): development and general psychometric properties, 1998. Soc Sci Med. 1988;46(12):1569-85.
24. United Nations. World population prospects: the 2002 revision. New York: United Nations Population Division; 2003.
25. World Health Organization. Active ageing: a policy framework. Geneva; 2002.
REFERENCES
E Chachamovich was supported by Coordenação de Aperfeiçoamento de Pessoal de Nível Superior (CAPES – Process 3604-06/3; Foreign Scholarship for Doctorate studies).