*e-mail: [email protected]
Process Parameter Optimization for Fly Ash Brick by Taguchi Method
Prabir Kumar Chaulia* and Reeta Das
Central Mechanical Engineering Research Institute,
Durgapur-713209, India
Received: October 1, 2007; Revised: April 22, 2008
This paper presents the results of an experimental investigation carried out to optimize the mix proportions of the fly ash brick by Taguchi method of parameter design. The experiments have been designed using an L9 orthogonal array with four factors and three levels each. Small quantity of cement has been mixed as binding materials. Both cement and the fly ash used are indicated as binding material and water binder ratio has been considered as one of the control factors. So the effects of water/binder ratio, fly ash, coarse sand, and stone dust on the performance characteristic are analyzed using signal-to-noise ratios and mean response data. According to the results, water/binder ratio and stone dust play the significant role on the compressive strength of the brick. Furthermore, the estimated optimum values of the process parameters are corresponding to water/binder ratio of 0.4, fly ash of 39%, coarse sand of 24%, and stone dust of 30%. The mean value of optimal strength is predicted as 166.22 kg.cm–2 with a tolerance of ± 10.97 kg.cm–2. Confirmatory experimental result obtained for the optimum conditions is 160.17 kg.cm–2.
Keywords: optimization, compressive strength, fly ash brick, Taguchi method
1. Introduction
Economic and environmental considerations play a major role in the rapid increase for usages of mineral admixtures such as stone dust, fly ash, blast-furnace slag and the like to improve the engineering properties and performance of concrete mix design1,2. In addition to lowering the heat of hydration, the use of fly ash and slag can im-prove namely the workability, plasticity, water tightness, resistance to sulphate, and sea-water attack. A higher content of pozzolanic materials implies that less cement is required. Considering the water content or water-to-binder ratio is an indirect approach to sizing the volume, thus ensuring greater durability in the mixture proportions for brick made of.
In the recent years, fly ash is being used extensively for utiliza-tion of industrial wastes by producing cost-effective and durable building components. Consequently, several experimental studies pertaining to processing of fly ash based materials are provided in the literature3,4. Fly ash is a by-product of the coal combustion in thermal power generation and consists mainly of SiO2, Al2O3, Fe2O3, CaO, and some impurities. According to ASTM Standards, fly ash belongs to class F if (SiO2+Al2O3+ Fe2O3) > 70%, and belongs to class C if 70% > (SiO2+Al2O3+ Fe2O3) > 50%. Usually, class F fly ashes have a low content of CaO and exhibit pozzolanic properties, but class C fly ashes contain up to 20% CaO and exhibit cementi-tious properties. The mechanism is that when pozzolanic materials are added, calcium hydroxide Ca(OH)2 is transformed into second-ary calcium silicate hydrate (C-S-H) gel, causing the transformation of larger pores into finer pores as a result of pozzolanic reaction of the mineral admixtures. Ca(OH)2, which appears as a result of the hydration, affects the quality of the concrete negatively by forming cavities because of its solubility in water and its low strength. The use of mineral admixtures has a positive effect on the quality of concrete by binding the Ca(OH)25,6. In this study, fly ash, coarse sand, and stone dust have been used as mineral admixtures for making bricks.
Because of low calcium content of the fly ash used in this study, its behavior is like a pozzolanic admixture in the brick. The addition of fly ash can also increase workability due to its spherical shape and their extreme fineness at lower contents.
Compressive strength is a vital parameter to judge the durability/ stability of the brick. Therefore, studies on optimization of brick with concrete mix design to achieve adequate strength is of considerable importance. In a concrete mix design, as the number of mix variables increases the number of experiments also increases. The traditional approach for such experimental studies is to use full factorial or fractional factorial design followed by response surface modeling. Soudki7 has used a full factorial experiment to optimize concrete mix design for hot climates. However, in the case of a full factorial design the number of experiments is numerous, and it is practically not possible to carry out the experiments in majority of situations. An alternative approach for optimization is to adopt Taguchi’s parameter design method based on orthogonal arrays (OA), which is widely used in research and industrial applications. This method is economic one as fewer experiments are required to obtain the optimum levels of the process parameters. Moreover, use of this method helps to make a process/product robust against environmental conditions/sources of noise, thus improving its field performance. Precisely, parameter design technique leads to achieve high quality of a product or com-ponent at low cost. The effects of admixtures in the concrete mix design using Taguchi method have been reported earlier8,9. However, the existing literature provides limited information on the optimiza-tion for constituent materials to be used for making fly ash brick by using orthogonal array design.
as water/binder ratio, fly ash, coarse sand, and stone dust and each with three levels. Results derived from statistical analysis of the experimental data were presented, based on Taguchi’s parameter design technique.
2. Parameter Design Methodology
Taguchi’s parameter design method10,11 is a powerful tool for optimizing the performance characteristic of a product/process. The aim of a parameter design experiment is to identify and design the settings of the process parameters that optimize the chosen quality characteristic and are least sensitive to noise (uncontrollable) factors. In the present study, the goal is to evaluate the effects of process pa-rameters on the performance measure and the optimum combination of control factors that would maximize the compressive strength, of the fly ash brick (prepared in the laboratory), which is chosen as the quality characteristic. The cause-and-effect diagram illustrating the possible effects of the process parameters on the compressive strength is shown in Figure 1.
Selection of control factors and their levels are made on the basis of some preliminary trial experiments conducted in the laboratory and also from literature review on the subject. Four control factors such as water/binder-ratio, fly ash, coarse sand, and stone dust are selected for the study. Each of the four control factors is treated at three levels, as shown in Table 1. The choice of three levels has been made because the effect of these factors on the performance charac-teristic may vary nonlinearly.
3. Design of Experiment
The experiments were designed based on the orthogonal array technique. An orthogonal array is a fractional factorial design with pair wise balancing property. Using orthogonal array design the ef-fects of multiple process variables on the performance characteristic can be estimated simultaneously while minimizing the number of test runs. An L9 (34) standard orthogonal array11 as shown in Table 2 was employed for the present investigation. This array is most suitable to provide the minimum degrees of freedom as 9 [= 1 + 4 x (3–1)] required for the experimental exploration.
Table 3 represents the layout of the experimental design, which has been obtained by assigning the selected factors and their levels to appropriate columns of L9 orthogonal array. This array has 9 rows and 4 columns and each row represents a trial condition while each column accommodates a specific process parameter. Moreover, the notation 34 implies that at most 4 factors, each at 3 levels can be investigated using this OA and their main effects can be estimated provided all other interactions are negligible which is assumed in the present case. The numbers in each column indicate the levels of specific factors (A, B, C, and D). However, while conducting the experiments the test runs have been randomly made to avoid the unidentified noise sources, which are not considered but could have an adverse impact on the response characteristic.
4. Materials and Procedure
Both the binding materials i.e, Portland cement and the fly ash used in experimental work are all manufactured in India. The chemical compositions of binding materials are presented in Table 4. Dry fly ash was obtained from Durgapur Projects Limited (DPL) and Portland slag cement12 as per IS available locally was used in the experimental work. The fineness modulus of coarse sand is approximately 3.2.
The constituent materials with desired proportion were put in a mixture machine for thorough dry mixing at first and subsequently wet mixing for obtaining the desired mix. The mixture thus obtained was put in desired moulds and pressed through vibro-compaction technique to produce brick. The green bricks thus obtained were cured by covering wet gunny bags and then dried in open air to obtain the final product.
5. Analysis, Results and Discussion
Universal Testing Machine has been used to measure the compres-sive strength of brick specimens. Three readings (corresponding to the three replications) are recorded for each experimental condition as shown in Table 5. Conventionally, data from a designed experiment are used to analyze the mean objective/response function. In Taguchi
Material composition
Mixing/curing technique
Maximization of compressive
strength Quality of
raw material
Environment Type
of sand
Quality of stone dust
Fineness of binder
w/b ratio
Coarse sand (%)
Stone dust (%)
Fly ash (%)
Temperature Humidity
Figure 1. Cause-and-effect diagram for processing of fly ash brick.
Table 1. Control factors and levels.
Factors Factors
designation
Level 1 Level 2 Level 3
Water/ binder ratio A 0.42 0.41 0.40
Fly ash (%) B 35 37 39
Coarse sand (%) C 24 22 20
Stone dust (%) D 28 30 32
Table 2. L9 (3
4) Standard orthogonal array.
Experiment no. Factor A Factor B Factor C Factor D
1 1 1 1 1
2 1 2 2 2
3 1 3 3 3
4 2 1 2 3
5 2 2 3 1
6 2 3 1 2
7 3 1 3 2
8 3 2 1 3
technique, the variation of the response is also examined using an appropriately chosen S/N ratio. Broadly speaking, the S/N ratio is the ratio of the mean (signal) to the standard deviation (noise). These S/N ratios, derived from the quadratic loss function, are expressed on a decibel (dB) scale. The formula used to compute the S/N ratio depends on the objective function. Generally, three standard S/N equations are widely used to classify the objective function as: ‘larger the better’, ‘smaller the better’, or ‘nominal the best’. However, re-gardless of the type of performance characteristic, a larger S/N ratio is always desirable.
In the present study, compressive strength is a ‘larger the bet-ter’ type of quality characteristic since the goal is to maximize the strength. The standard S/N ratio computing formula for this type of response is10,11:
S N
n Y
i
ij j
n
/ 10log 1 12
1 (1)
where ‘i’ is the number of a trial; ‘Yij’ is the measured value of quality characteristic for the ith trial and jth experiment; ‘n’ is the number of repetitions for the experimental combination. Signal-to-noise ratios are computed using Equation 1 for each of the nine experimental conditions and are reported in Table 5. Since the experimental design
is orthogonal, the factor effects can be separated out in terms of the S/N ratio and in terms of the mean response. The average values of S/N ratios of the four control factors at each of the levels are shown in Figure 2, and from which the levels corresponding to the highest S/N ratio values are chosen for each parameter representing the optimum condition. Here, the optimum condition is corresponding to the maxi-mization of the compressive strength. It is clear from Figure 2 that the optimum levels are: A3 (water/binder ratio: 0.4), B3 (fly ash: 39%), C1 (coarse sand: 24%) and D2 (stone dust: 30%) respectively.
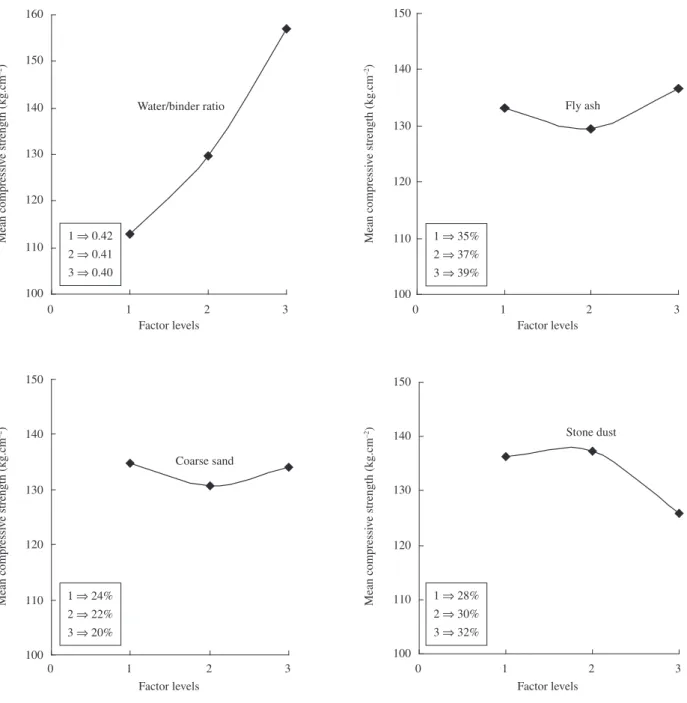
In addition to S/N analysis, main effects of the process parameters on the mean response are also analyzed. The mean response refers to the average value of the quality characteristic for each factor at different levels. Thus the average values of the compressive strength for each factor at the three levels have been calculated and are plot-ted in Figure 3. The mean response analysis (Figure 3) also indicates the same optimum level of the parameters (A3, B3, C1, and D2) as is obtained in S/N ratio analysis.
The analysis of variance (ANOVA) is also performed to study the relative significance of the process parameters. Table 6 shows the computed results of the ANOVA with 95% confidence. The F-ratio and the percent contributions of the various parameters as quanti-fied under the respective columns of Table 6 reveal that, both water/ Table 3. Layout of experimental design (34).
Experiment no. A
Water/binder ratio
B Fly ash (%)
C Coarse sand (%)
D Stone dust (%)
1 0.42 35 24 28
2 0.42 37 22 30
3 0.42 39 20 32
4 0.41 35 22 32
5 0.41 37 20 28
6 0.41 39 24 30
7 0.40 35 20 30
8 0.40 37 24 32
9 0.40 39 22 28
Table 4. Chemical composition (%) and properties of binding materials.
Binder %SiO2 %Al2O3 %Fe2O3 %CaO %MgO %SO3 %LOI*
Fly ash (source: DPL) 60 20 10.7 4 0.4 0.4 4
Cement 29 56 8.4 4 1.5 2.1 4
*loss of ignition.
Table 5. Results for quality characteristic and signal-to-noise ratio.
Experiment no. Compressive strength of material
(kg.cm–2)
S/N ratio (dB)
Reading 1 Reading 2 Reading 3 Mean
1 113 117 123 117.667 41.397
2 113 100 120 111.000 40.831
3 113 110 107 110.000 40.821
4 123 117 120 120.000 41.578
5 117 133 140 130.000 42.204
6 133 147 137 139.000 42.837
7 163 163 160 162.000 44.189
8 143 147 153 147.667 43.376
binder ratio and stone dust have significant effect on the compressive strength at the 95% confidence level. Moreover, the impact of fly ash and coarse sand are insignificant since their F-ratios are lower than the critical value (3.55). However, water/binder ratio yields the most significant effect on the measured response as shown by the much higher F-ratio (= 108.337) and also percent contribution (= 82.62).
5.1. Prediction of optimum quality characteristic (QC)
From the analyses of S/N ratio and the mean response charac-teristic, the optimum levels of the control factors are determined as: A3, B3, C1, and D2. Hence, the predicted mean of the quality characteristic (compressive strength) has been computed as shows the reference13.
Smp = Y + (A3 – Y) + (B3 – Y) + (C1 – Y) + (D2 – Y) (2)
where Y is the grand average of performance characteristic [cor-responding to all the 27(= 9 x 3) readings in Table 5]. A3, B3 , C1, and D2 are the average values of the compressive strength with process parameters at their respective optimal levels and Smp de-notes the predicted mean of the compressive strength at optimum condition. The calculated values of various response averages are: Y = 133.148 kg.cm–2, A
3 = 156.889 kg.cm –2, B
3= 136.667 kg.cm –2, C1 = 134.778 kg.cm–2, and D
2 = 137.333 kg.cm
–2. So substituting these in Equation 2, the mean optimum value of the compressive strength has been predicted as: Smp = 166.22 kg.cm–2.
An important step in Taguchi’s optimization technique is to conduct confirmation experiments for validating the predicted re-sults. Thus a 95% confidence interval (CI) for the predicted mean of
optimum QC on a confirmation test is estimated using the following two equations13:
α e e
eff
1 1
CI F ,1,f V
N R
( ) +
= (3)
and
eff
DOF
N
N
1+T (4)
where, F (a, 1, fe) is the F-ratio required for 100 (1– a) percent confidence interval, fe is DOF for error,Ve is the error variance, R is number of replications for confirmation experiment (= 3), and Neff is effective number of replications. N is total number of experiments [= 27 (9 x 3)] and TDOF is the total degrees of freedom [= 8 (2 x 4)] associated with the estimate of mean optimum. From Table 6, the values are: Ve = 40.963, f.e= 18, and from standard Statistical Table, the required F-ratio for a = 0.05 is: F (0.05,1,18) = 4.41. Substituting these values in Equations 3 and 4, the calculated confidence interval is: CI = ± 10.97. Thus the 95% confidence interval of the predicted optimal compressive strength is obtained as:
(166.22 ± 10.97) kg.cm–2
i.e. 155.25 < Smp (kg.cm–2) < 177.19
5.2. Confirmation experiment
In order to test the predicted result, confirmation experiment has been conducted by running another three replications at the optimal settings of the process parameters determined from the analysis.
Water/binder ratio
40 41 42 43 44
0 1 2 3
Factor levels
A
v
erage S/N ratio(dB)
Fly ash
40 41 42 43 44
0 1 2 3
Factor levels
A
v
erage S/N ratio(dB)
Stone dust
40 41 42 43 44
0 1 2 3
Factor levels
A
v
erage S/N ratio(dB)
Coarse sand
40 41 42 43 44
0 1 2 3
Factor levels
A
v
erage S/N ratio(dB)
1 0.42 2 0.41 3 0.40
1 35% 2 37% 3 39%
1 28% 2 30% 3 32%
1 24% 2 22% 3 20%
Figure 3. Effects of process parameters on mean response characteristic. Water/binder ratio
100 110 120 130 140 150 160
0 1 2 3
Factor levels
Mean compressi
v
e strength (kg.cm
–2)
Fly ash
100 110 120 130 140 150
0 1 2 3
Factor levels
Mean compressi
v
e strength (kg.cm
–2)
Coarse sand
100 110 120 130 140 150
0 1 2 3
Factor levels
Mean compressi
v
e strength (kg.cm
–2) Stone dust
100 110 120 130 140 150
0 1 2 3
Factor levels
Mean compressi
v
e strength (kg.cm
–2)
24%
2 22%
3 20% 1 0.42
2 0.41 3 0.40
1 35% 2 37% 3 39%
1 28% 2 30% 3 32%
Table 6. Analysis of variance (ANOVA) for compressive strength.
Factor Sum of
squares (S)
Degrees of freedom
Variance (V) F - ratio Pure sum
of squares (S′)
Percent contribution (P) (%)
Water/binder ratio 8875.629 2 4437.81 108.337* 8793.703 82.62
Fly ash 227.629 2 113.81 2.778 145.703 1.37
Coarse sand 85.851 2 42.925 1.048 3.925 0.04
Stone dust 716.963 2 358.48 8.751* 635.037 5.97
Other/errors 737.335 18 40.963 - 1065.039 10.00
Total 10643.407 26 - - 10643.407 100.00
Table 7. Results of confirmation experiments.
Replications Mean
1 2 3
Compressive
strength (kg.cm–2)
161.00 159.00 160.50 160.17
Optimum combination of control factors for confirmation experiment: water/binder ratio = 0.4; Fly ash = 39%; coarse sand = 24%; Stone dust = 30%; 95% confidence interval of predicted strength: (166.22 ± 10.97) kg.cm–2 i.e. (155.25-177.19 ) kg.cm–2
These results are shown in Table 7 and it is observed that the mean compressive strength obtained from the confirmation experiments
is 160.17 kg.cm–2, which falls within the predicted 95% confidence
interval.
6. Conclusions
Optimization of process parameters for fly ash brick was
per-formed via Taguchi’s parameter design method. An L9 OA was used to accommodate four control factors and each with three levels for the experimental plan. Selected process parameters along with their levels were: water /binder ratio (0.42, 0.41, 0.40); fly ash (35, 37, 39%); coarse sand (24, 22, 20%); stone dust (28, 30, 32%). The following conclusions may be drawn from the present investigation work:
• Among the four process parameters, the water/binder ratio
and stone dust were having significant effect on the quality characteristic i.e., compressive strength. Moreover, water/ binder ratio was having the highest contribution of the order of 82.62%.
• Theoptimallevelsoftheprocessparameterswerefoundtobe
A3, B3, C1, and D2 corresponding to water/binder ratio of 0.4, fly ash of 39%, coarse sand of 24%, and stone dust of 30%.
• An optimized value of the compressive strength for a 95%
confidence interval was predicted as: (166.22 ± 10.97) kg.cm–2
i.e.155.25
<
Smp(
kg.cm–2)
<
177.19
• Fromconirmationexperiments,themeanvalueofthecom -pressive strength corresponding to the optimum conditions was obtained as 160.17 kg.cm–2, which fell within the predicted range.
• ThusthepredictionsmadebyTaguchi’sparameterdesigntech -nique were in good agreement with the confirmation results.
• Theresultsofthepresentinvestigationwerevalidwithinthe
specified range of the process parameters along with their chosen levels and for the specific combination of brick ingredients.
Notation
CI = confidence interval DOF = degrees of freedom
OA = orthogonal array QC = quality characteristic S/N = Signal-to-Noise ratio (dB)
Smp = Predicted mean of optimum compressive strength (kg.cm–2) w/b = water/binder
Y = quality/performance/response characteristic
Acknowledgements
The authors are grateful to Director, Central Mechanical Engi-neering Research Institute, Durgapur for constant support, encourage-ment and permission to publish this paper.
References
1. Chang PK, Hou WM. A study on the hydration properties of high performance slag concrete analysed by SRA. Cement and Concrete Research 2003; 33(2):183-189.
2. Chang PK, Peng YN, Hwang CL. A design consideration for durability of high performance concrete. Cement and Concrete Composites 2001; 23(4-5):375-380.
3. Hwang CL, Lin CY. A study on quality improvement of side walk slabs.
Journal of Civil and Hydraulic Engineering 1985; 12(3):63-70. 4. Smith LA. The design of fly ash concretes. In: Proceedings Institute of
Civil Engineering; 1967. p. 770-789.
5. Menon AH, Radin SS, Zain MFM, Trottier JF. Effect of mineral and chemical admixtures on high-strength concrete in seawater. Cement and Concrete Research 2002; 323(3):373-377.
6. Papadakis VG, Tasimas S. Supplementary cementing materials in concrete: part-I efficiency and design. Cement and Concrete Research
2002; 32(10):1525-1532.
7. Soudki KA, El-Salakawy EF, Elkum NB. Full factorial optimization of concrete mix design for hot climates. Journal of Materials in Civil Engineering 2001;13(6):427-433.
8. Tan Ozcan, Zaimoglu A Sahin. Taguchi approach for investigation of the setting times on cement-based grouts. Indian Journal of Engineering & Materials Sciences 2004; 11(1):63-67.
9. Hinishoglu S, Bayrak OU. A robust approach for evaluating modulus of elasticity of pavement concrete. Indian Journal of Engineering and Materials Sciences. 2005; 12(2):111-116.
10. Ealey Lance A. Quality by design Taguchi methodsTM and US industry.
2nd ed. Sidney: Irwin professional publishin and ASI Press; 1994.
p. 189-207.
11. Montgomery DC. Design and analysis of experiments. 4th ed. New York:
John Wiley; 1997.
12. A.Oner, S.Akyuz, R.Yildiz. An Experimental study on strength development of concrete containing fly ash and optimum usages of fly ash in concrete. Cement and Concrete Research 2005; 35(6):1165-1171.
13. Singh H, Kumar P.Tool wear optimization in turning operation by Taguchi method. Indian Journal of Engineering and Material Sciences