*e-mail: [email protected]
Presented at the International Symposium on High Temperature Corrosion in Energy Related Systems, Angra dos Reis - RJ, September 2002.
Corrosion Penetration Monitoring of
Advanced Ceramics in Hot Aqueous Fluids
Klaus G. Nickel*, Björn Seipel
University Tübingen, Germany, Institute for Geosciences, Applied Mineralogy Wilhelmstr. 56, D-72074 Tuebingen
Received: September 2, 2002; Revised: September 4, 2002
Advanced ceramics are considered as components in energy related systems, because they are known to be strong, wear and corrosion resistant in many environments, even at temperatures well exceeding 1000 °C. However, the presence of additives or impurities in important ceramics, for example those based on Silicon Nitride (Si3N4) or Al2O3 makes them vulnerable to the corrosion by hot aqueous fluids. The temperatures in this type of corrosion range from several tens of centi-grade to hydrothermal conditions above 100 °C. The corrosion processes in such media depend on both pH and temperature and include often partial leaching of the ceramics, which cannot be monitored easily by classical gravimetric or electrochemical methods.
Successful corrosion penetration depth monitoring by polarized reflected light optical microscopy (color changes), Micro Raman Spectroscopy (luminescence changes) and SEM (po-rosity changes) will be outlined. The corrosion process and its kinetics are monitored best by microanalysis of cross sections, Raman spectroscopy and eluate chemistry changes in addition to mass changes. Direct cross-calibrations between corrosion penetration and mechanical strength is only possible for severe corrosion. The methods outlined should be applicable to any ceramics corrosion process with partial leaching by fluids, melts or slags.
Keywords:Ceramics, nitrides, aqueous, corrosion, penetration monitoring
1. Introduction
Advanced ceramics, which are used or considered for energy related systems, demonstrate corrosion resistance at higher temperatures than metals. A number of books and articles reviewing their behavior is available1-4.
Oxide ceramics are naturally stable in oxygrich en-vironments, which make them useful for applications at extreme temperatures. Alumina tubes operate in furnaces at 1800 °C, zirconia is in use as a heater material in air well above 2000 °C. Non-oxide ceramics based on silicon car-bides and nitrides operate as structural materials at tempera-tures above 1200 °C.
Because of their impressive chemical resistance at such conditions and the common use of glass and traditional ce-ramics in chemical laboratories it is often inferred that ad-vanced ceramics should be almost invulnerable to corro-sion at relatively low temperatures. The literature shows that
this is not really true. Attack of aggressive aqueous media can deteriorate ceramics with secondary grain boundary phases even below 100 °C and many types are affected at higher temperatures under appropriate pressures.
This should not be confused with the attack by water vapor or steam. Wet atmospheres can accelerate oxidation and corrosion of non-oxides but this effect by itself is not dramatic5-7. Wet atmospheres can transport alkalis and other
impurities and thereby induce a further acceleration8 and at
very high temperatures change the kinetics9-11. Some
ce-ramics, based on BN, AlN or B4C may be degraded com-pletely12. However, at temperatures below about 1100 °C
there will be little oxidation or corrosion of alumina, sili-con carbides and nitrides in wet oxygen sili-containing gaseous media.
which make them dangerous to advanced ceramics. Thus water, as a fluid under supercritical conditions is likewise a corrosion medium, which is quite different from steam or wet atmospheres.
This opens the question about the applicability of ad-vanced ceramics in energy related systems, where hot aque-ous media have to be handled. If they interact with such fluids then the engineer needs to know the kinetics of the process in a given medium at a certain condition and a model for the consequences for the properties of the materials. Corrosion is a system property rather then a simple mate-rial property und for this reason it is not easy to obtain re-sults, which can be transferred to other materials or condi-tions. This is one of the reasons why the classification for corrosion resistance in handbooks is rather vague13.
In this paper we will show how aqueous corrosion of advanced ceramics can be monitored, which is the first step in the development of lifetime prediction models. To do so, we have to discuss the mechanisms and the basic types of kinetics following from those.
2. Corrosion Mechanisms
A. Pure ceramic phases
In general the attack of water on the non-oxide ceramic phases is oxidizing, for example
(1) (2)
The free energies of reactions (1) and (2) are strongly negative at room temperature, hence the thermodynamic equilibrium is on the side of the oxides. However, at room temperature, only surface reactions will take place and silica formers have a silanol (SiOH) ± amine (SiNH2)-group14
coverage.
Reactions of the pure phases SiC and Si3N4 with water have been evaluated by powder experiments. Data of Yoshimura et al.12,15 on SiC in water under 100 MPa
pres-sure indicated a insignificant amount of reaction below 500 °C. This was confirmed in hydrothermal experiments on SiC fibers and crystals16,17. Experiments using Si
3N4 gave
a strongly differing result, where the powder reacted below 200 °C15 and also pure HIPped and additive containing
ce-ramic materials were reported to degrade at relatively low temperatures12. A threshold value of about 130 °C has been
suggested18.
As outlined below, the attack of aqueous media is via the oxide. Therefore the lack of reaction with water up to the boiling point makes both SiC and Si3N4 as pure phases resistant to the attack by acid and caustic media. One ex-ception are amorphous silicon nitride films, which can be
etched, for example, by mixtures containing H2O2 and caustics at 70 °C14. Other exceptions are HF-containing
sys-tems. There is a rich literature on etching studies, to which the reader is referred to14,19-21.
To understand the general aqueous corrosion behavior we need to turn to the oxides, in particular to silica22. Silica
can react and dissolve according to a sequence of reactions:
(3)
H4SiO4 is only a very weak acid with a limited solubil-ity. Only at higher pH-values, where hydrogen ions are re-moved, the reactions proceed towards the ions with a higher negative charge. Therefore silica solubility becomes signifi-cant above pH = 9 and very high at pH > 11. The solubility of amorphous silica in water rises from about 120 ppm in neutral water to about 900 ppm at pH 10.6, the influence of rising temperatures is likewise to increase both solubility and dissolution rates24. Increasing pressure causes a
non-linear increase in solubility25. Depending on pressure, the
solubility at about T > 250 °C can drop again, because a less dense solution is making it progressively a poorer sol-vent for ionized species22.
Some solute constituents can increase the solubility of silica strongly, because they form complexes with H4SiO4 or H3SiO4–. Namely Fe3+, but also Mg2+ and Ca2+ have been
reported as well as a number of organic species. There is also a catalytic action of constituents like Na+, which
strongly increase dissolution rates of silica already at low concentrations.
From the discussion above we can rationalize the dif-ference of hydrothermal behavior of silicon carbide and sili-con nitride: it is probably the change in pH of the water at the material surface, because the emission of NH3 accord-ing to reaction (2) induces the formation of NH4OH, which dissociates to make a caustic solution. At room tempera-ture, a pH between 9.5 and 10.5 has been measured26, the
pH at hydrothermal conditions (100 MPa, 200 - 400 °C) was not established.
From the strong change of reaction kinetics comparing 10 MPa and 100 MPa-results27 it is clear that at 100 MPa
pressure there is no dissociation of NH3 into N2 and H2 at least up to 300 °C and that the alkalinity is high at those conditions.
The basic kinetics of hydrothermal corrosion of pure Si3N4 in caustic aqueous media therefore have to be linear with time, because either the reaction to form the silica or the dissolution of silica in the medium is rate controlling. This has been suggested from powder experiments18 and is
also true for the behavior of additive free HIPSN materials in strongly caustic media such as 1n NaOH28.
remarks here. The thermodynamic calculation of the reac-tion:
(4)
will favor the hydroxide at low temperature. However, the kinetic of pure corundum materials corrosion is so slow that water attack even at 300 °C is very low29.
Pure zirconia is likewise a very stable oxide. However, in particular the versions stabilized by further elements, are known for their susceptibility to aqueous corrosion in hy-drothermal conditions and even at room temperature30.
B. Glasses
A great number of works on weathering and corrosion of glassy phases were published in the past and five classes of corrosion modes have been classified31. These modes are
characterized by: I Hydrated surface layer (≤ 5Å), II:
Al-kali-depleted surface layer, III: Silica-rich layer adjacent to bulk and cation rich layer adjacent to solution, IV: silica-rich non-protective layer, V: no layer formation. The behavior is correlated with “durability” from high with type I to lowest with type V.
This is compatible with the schematics outlined by Grambow32 (Fig. 1). In this general model the glass surface
becomes first hydrated and under appropriate conditions hydrolyzed, i.e. transformed into a gel, which has lost the glassy state (Corrosion mode III31). Within this usually
po-rous layer, which contains molecular water, there is a high ionic and water mobility. The gel layer interacts with the solution by exchanging ions with varying speed. Usually ions from network modifiers like alkalis are fast, while those from network formers are slow.
In particular acids, which have little power to dissolve silica, can extract network modifiers from glasses or gels with appropriate bonds33:
(5)
The consequence for the outer scale can be quite differ-ent. Either we have a silica- ± network former-rich layer depleted in other elements or we find the complete dissolu-tion of the glass. A third possibility is that secondary phases form at the boundary towards the solution, because small insoluble components become enriched.
From this simple picture we can predict the possible ki-netic behavior. If the advance of the hydrolyzing front is fast, the dissolution of the gel in the solution slow and the ion exchange fast, we find profiles like the one of Na in Fig. 1: A very steep gradient very close to the boundary towards the pristine glass and the development of a depleted layer. Nonetheless, the overall kinetics are approximately parabolic, which is evidence for the transformation into gel to be rate controlling34. This is typical for the attack by acids.
If the water transport is slower, the diffusion profile for the alkalis will smear out over the whole gel-layer, the reac-tion is still controlled by diffusion of water through a grow-ing layer: again the first approximation is a parabolic or near parabolic kinetic.
If the dissolution of the whole glass is rate controlling it can be treated like a first order chemical reaction and the dissolution is expected to be constant with time, i.e. linear kinetics should prevail. In cases, where minor elements be-come concentrated, precipitate and form protective layers the linear kinetics will be retarded: parabolic or logarithmic kinetics follow.
For the action of pure water on complex glasses we find a process with simultaneous factors: the ion exchange of alkalis with H+ and the dissolution of the network-forming
silica (or other network-forming elements, such as Al, B and Zr), according to Eqs. (5) and (6)
(6)
At short times the exchange-reaction with parabolic ki-netics is dominating, which makes the pH rise and initiate the glass dissolution, which is then acting with linear kinet-ics at longer times.
Both reaction rates and diffusion profiles depend strongly not only on external conditions like pressure, temperature and flow/exchange of media, but also on the composition of the glass at hand, which is different for every glass and can change during the process. Attempts have been made to predict corrosion behavior from the composition35 but have
not proven successful in simple well controlled experiments at pH = 724. A summary of surface layer effects on glass
corrosion is given by Feng et al.36, important details can be
found in Darby et al.37.
Thus only general rules follow from the mechanisms described. For example, it is expected to have less corro-sion by acids if the glass contains more silica, because this is not harmed by the solution, while this will increase at-Figure 1. Schematic of the surface regions in corroded silicate
tack by basic solutions. Similarly, we can expect decreas-ing corrosion in acids by improvdecreas-ing the bond strengths of network modifiers in the glass: alkaline earth elements should corrode less then alkali elements. Further arguments for the influence of the bonding structure comes from find-ings that silicon oxycarbide glasses have a much better re-sistance against alkaline solutions or HF compared with phase separated glasses of the same composition38.
Alu-minium and boron can improve the durability of glasses, depending on amount and solute pH. Nitrogen incorpora-tion can increase the resistance against alkaline soluincorpora-tions. Concentrated acids or bases corrode less then moderate concentrated solutes, which may be attributed to lower solu-bility for reaction products or decreasing water activity39.
C. Advanced ceramics with grain boundary phases
Most of the materials, which may be considered for en-ergy related systems, will have a grain boundary phase, because the economic industrial production usually involves sintering additives to obtain dense ceramics.
From the discussion of the mechanisms above it is clear that ceramics with glassy grain boundary phases should behave different from pure phases. This is the case. An ex-treme example has been reported for alumina ceramics, where it has been shown that impurities as low as 500 ppm SiO2 cause dramatic differences40. The impurity leads to the
existence of a continuous grain boundary phase, which was rapidly leached in boiling 10% H2SO4, while the ceramic without it was practically untouched.
The same is true for SiC and Si3N4. If there is a second-ary phase like Si in SiSiC41 or a glassy silicate grain
bound-ary phase in liquid phase sintered SiC or Si3N4, then this component dominates the process21 at least below 100 °C.
Under hydrothermal conditions the grain boundary phase can make the material both less or more resistant to aque-ous corrosion than the pure phase42. The corrosion is then
via selective attack, which makes the calculation of pen-etration depths difficult, imprecise or impossible.
3. Corrosion monitoring
From the discussion of the mechanisms it is clear that the corrosion processes can follow quite variable kinetic patterns. The shape of such a curve may be anticipated in some cases, the exact prediction of the curve is not possible.
One of the reasons for the difficulties is that a rate con-trol by dissolution or leaching processes means that the ac-tual velocity of corrosion is strongly dependent on the physi-cal boundary conditions: surface area exposed, defect con-centrations, flow velocity and flow type (stagnant, laminar, turbulent) of the media will all have an influence. And the conditions, to which of a material in an energy related sys-tem is subjected, will vary strongly.
Standard corrosion experiments can create additional problems, because the criterion for comparability may be violated: saturation and pH-change effects in fixed vol-ume experiments are not uncommon32. Thus for an
evalu-ation of the actual performance is necessary to simulate the process at hand with appropriate experiments and evaluate the process by monitoring. A life time prediction beyond the experimental times necessitates a good under-standing of the acting mechanisms and this can only be done by a combination of monitoring methods: mass change, fluid composition, analyses of cross sections and properties.
The possibilities will be demonstrated for the corrosion of a sintered silicon nitride in sulfuric acid. The chosen material was deliberately of a type very susceptible to cor-rosion in order to create large, measurable effects.
A. Material and Experimental Setup
A gas pressure sintered Si3N4 with 6 wt.% Y2O3 and 4 wt.% Al2O3 with 99.5% density prepared by IKTS Dres-den was used in the corrosion tests in diluted sulphuric acid. XRD investigations did not show any indication for crys-talline phases within the grain boundaries.
The samples were cut and ground into rectangular 3.5 × 3 × 45 mm beams. These were inserted in a teflon (PTFE) corrosion cell with continuous flow, which is de-scribed elsewhere43. The flow rate of 0.24 ml/min through
the corrosion cell (30 ml) ensured a replacement of the cor-roding agent approximately every 2 h. This setup was used to exclude overall saturation effects to play a role. With an oil bath a temperature of 90 °C was kept with a precision of ± 1 °C.
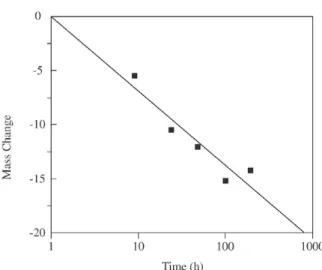
Figure 2. Mass change of Si3N4 sample exposed to 1n H2SO4 at
B. Mass change
The most widely used monitor parameter is the mass change after a given treatment. The results for the Si3N4 corroded by 1n H2SO4 at 90 °C are shown in Fig. 2.
Figure 2 is an example for a corrosion, which seems to follow a logarithmic trend, i.e. the fast mass losses of the initial period seem to cease after some time. Such curves are known from glasses in strong acids44. However, the
mechanisms cannot be determined from this result. Passivation or the balancing of processes operating in dif-ferent directions are possible.
Often mass changes due to corrosion in aqueous media are much smaller (µg/cm2 range), which makes the
inter-pretation more difficult, because minute losses due to sam-ple handling will interfere with the result. As a single pa-rameter the mass change is not conclusive.
C. Eluate chemistry
The change in eluate chemistry can be followed easily in experiments with continuous flow. Here at a chosen time a separate eluate sample is taken. This allows the evalua-tion of the amount going into the medium at a given time instead of analyzing the content of a fixed volume, which becomes more and more concentrated.
The results of measurements by atomic absorption spectroscopy (AAS) and ICP-MS for the Si3N4 is shown in Fig. 3. Obviously we have a decrease of all elements going into solution with time, which is approximated by an expo-nential trend in Fig. 3. This is a first indication of the mecha-nism operating: the result is compatible with the
assump-Figure 3. Concentrations of Si, Al and Y in eluats taken at the
indicated time, corroding Si3N4 sample by 1n H2SO4 at 90 °C.
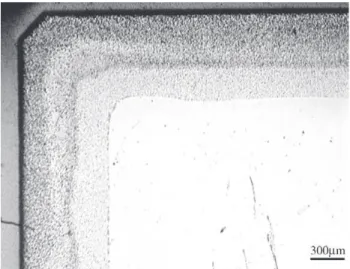
Figure 4. Cross section of Si3N4 sample exposed for 100 h to 1n H2SO4 at 90 °C in reflected polarised light microscopy from43.
tion of a slowing down of the process.
The retardation speed seems not to be compatible with a parabolic law. Thus simple explanations with diffusion control will not be satisfactory.
D. Cross section analysis
In all cases where corrosion is preferentially along grain boundaries the penetration can not be calculated directly from mass changes, unless the distribution of this phase is analyzed. Thus, for penetration depths the evaluation will have to be with the aid of cross sections.
For a qualitative evaluation, often an investigation by reflected light microscopy is sufficient (Fig. 4). The altered
Figure 5. Cross section of Si3N4 sample exposed for 100 h to 1n
zone is clearly visible. The differences in reflectivity indi-cate a structured corrosion zone.
The chamfer on the sample on the top left corner is well preserved and provides evidence for the preservation of the original geometry, which, in turn, is evidence for the process of grain boundary corrosion without matrix degradation.
In cross sections of corroded Si3N4 observed by REM (Fig. 5) the corrosion front is visible by porosity changes. It can be seen that the porosity is not continuous within the corroded zone. However, if we have a gradual decrease of porosity with depths or rather a layered structure with diffuse boundaries is hard to decide. The comparison with the opti-cal micrograph (Fig. 4) is arguing for a structured feature.
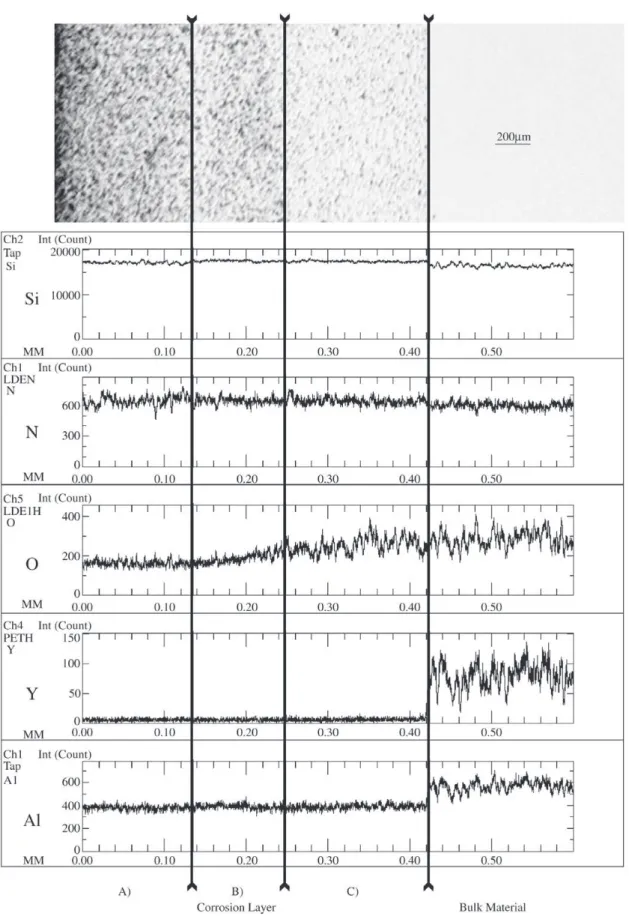
Chemical profiling of the corroded layer is possible with a number of techniques. An example is electron microprobe analysis in wavelengths dispersive mode. This is shown in Fig. 6.
From Fig. 6 it is clear that the corroded zone has a com-plete loss of Y and Al from the glass phase (some Al re-mains in Si3N4). The concentration profile is thus akin to the schematic of Fig. 1. The nitrogen profile provides fur-ther evidence that no Si3N4 is lost by corrosion. The oxygen profile reveals three or four different zones. The solution side contains no oxygen; hence it represents a zone of near complete dissolution. Further in we have signals of oxy-gen, which may be interpreted as continuously increasing towards the zone of pristine material or as a field with two zones B and C in Fig. 6, which must contain leached silica. The structure of the phases within the corroded zone cannot be evaluated by chemical profiles. However, the lu-minescence as observed by Raman spectroscopy (Fig. 7) provides evidence for strongly disordered silica in corro-sion zone C of Fig. 6, the gel formation according to Fig. 1 is a likely mechanism. Very interesting is the luminescence of zone B of Fig. 6. There is no simple monotonous de-crease in the amount of silica towards the solution. The pat-tern may be interpreted as evidence for the precipitation of phases or structures, which correspond to the outer zone in Fig. 1 and which may be responsible for the retardation of the corrosion process with time.
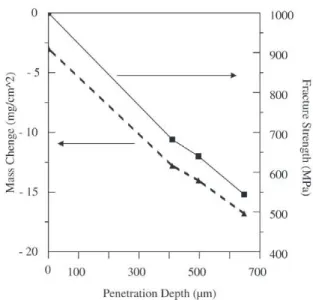
The monitoring of the effect of corrosion on mechani-cal properties of the ceramics is very cost- and time con-suming, because a large number of samples is needed to establish a significant value for brittle materials45. For ex-tensive corrosion, a direct link between the extent of corro-sion and loss of strength is evident as shown in Fig. 8.
However, this needs not to be the case. The failure of brittle materials is from existing flaws of critical size. If flaws are created by and grow with corrosion they will not be detected as long as they are smaller then the pre-existing flaws. So there may be a discontinuous behavior with a seemingly unchanged strength for long times, followed by a sudden change in properties.
Figure 8. Correlation of mass change, penetration and fracture
strength for the Si3N4 described in the text
Figure 7. Linescan by Micro Raman Spectroscopy showing
rela-tive luminscence intensities of the zones depicted in Fig. 6 from 43.
4. Conclusions
• Aqueous media can attack advanced ceramics. • At temperatures below 100°C the attack is related to
SiC and alumina as pure phases are resistant to higher temperatures.
• The grain boundary phase can be tailored to meet spe-cific demands, e.g. to be acid resistant.
• The selective corrosion makes grain boundary attack the dominant corrosion type. The effect is not reliably predictable and has to be monitored by experiments simulating application conditions.
• Several methods of monitoring (mass change, eluate chemistry, cross section analysis by optical microscopy, chemical profiling and Raman spectroscopy) can be successfully employed. For the analysis of mechanisms and to establish a predictive tool a combination of such methods is necessary. Sub-sequently, low-cost monitoring by optical means may be sufficient.
• There is a strong correlation between the strength of the ceramics and corrosion progress in severely cor-roded samples. The correlation is however not so straightforward in all cases.
Acknowledgements
We gratefully acknowledge funding from the German Research Association (DFG) under Ni299/7. We like to thank Dr. Westerheide, Dr. Herrmann and J. Schilm from the Fraunhofer-Institutes for the mechanics of materials (IWM, Freiburg) and for ceramics and sintering technol-ogy (IKTS, Dresden) and Prof. Y. Gogotsi (Drexel Univer-sity) for collaboration and many fruitful discussions.
References
1. Gogotsi, Y. G. and Lavrenko, V. A., Corrosion of High-Performance Ceramics, Springer Verlag, Berlin, F.R.G.,
1992.
2. Corrosion of Advanced Ceramics - Measurement and Modelling; Vol. 267, edited by Nickel, K. G. (Kluwer
Academic Publisher, Dordrecht, NL, 1994).
3. Nickel, K. G. and Quirmbach, P., in Technische
Keramische Werkstoffe, edited by Kriegesmann, J.
(Deutscher Wirtschaftsdienst, Köln, 1991), p. Chapter 5.4.1.1., p. 1-76.
4. Fordham, R. J., Baxter, D. J., and Graziani, T., Corro-sion of Advanced Ceramics, Vol. 113, TransTech Pub.,
Zurich, CH, 1995.
5. Opila, E. J., J.Am.Ceram.Soc. v. 77, p. 730-736, 1994. 6. Schumacher, C., Nickel, K. G., and Thaler, H., in
WerkstoffWoche 98; Vol. 3, edited by Kranzmann, A.
and Gramberg, U. (Wiley-VCH, Weinheim, 1999), p. 25-30.
7. Opila, E. J., J.Am.Ceram.Soc. v. 82, p. 625-636, 1999. 8. Opila, E., J.Am.Ceram.Soc. v. 78, p. 1107-1110, 1995. 9. Cappelen, H., Johansen, K. H., and Motzfeld, K., Acta
Chem.Scand. v. A 35, p. 247-254, 1981.
10. Opila, E. J. and Hann Jr., R. E., J.Am.Ceram.Soc. v. 80, p. 197-205, 1997.
11. More, K. L., Tortorelli, P. F., Ferber, M. K., and Keiser, J. R., J.Am.Ceram.Soc. v. 83, p. 211-213, 2000. 12. Gogotsi, Y. G. and Yoshimura, M., MRS Bull. v. 1994,
p. 39-45, 1994.
13. Morell, R., Handbook of properties of technical & en-gineering ceramics, HMSO books, London, 1987.
14. Sangster, R. C., Kämpf, P., and Nohl, U., Silicon Suppl. B 5d2, Vol. 15, Springer-Verlag, Berlin, 1995.
15. Yoshimura, M., Kase, J., Hayakawa, M., and Somiya, S., in Corrosion and Corrosive Degradation of Ceram-ics, edited by Tressler, R. E. and McNallan, M.
(Am.Ceram.Soc., 1990), p. 337-354.
16. Kraft, T., Nickel, K. G., and Gogotsi, Y. G., J.Mat.Sci. v. 33, p. 4357-4364, 1998.
17. Kraft, T. and Nickel, K. G., J.Mat.Chem. v. 10, p. 671-680., 2000.
18. Nickel, K. G., Däumling, U., and Weißkopf, K., Key Eng.Mat. v. 89-91, p. 295-300, 1994.
19. Sato, T., Tokunaga, Y., Endo, T., Shimada, M., Komeya, K., Nishida, K., Komatsu, M., and Kameda, T., J.Mat.Sci. v. 23, p. 3440-3446, 1988.
20. Knotter, D. M. and Denteneer, T. J. J. D., J.Electrochem.Soc. v. 148, p. 43-46, 2001.
21. Sharakawy, S. W. and El-Aslabi, A. M., Corrosion Sci-ence v. 40, p. 1119-1129, 1998.
22. Dove, P. M. and Rimstidt, J. D., in Silica; Vol. 29, edited
by Heaney, P. J., Prewitt, C. T., and Gibbs, G. V. (Min-eralogical Society of America, Washington, 1994), p. 259-308.
23. Iler, R. K., The Chemistry of Silica, Wiley, London, 1979.
24. Perera, G., Doremus, R. H., and Lanford, W., J.Am.Ceram.Soc. v. 74, p. 1269-1274, 1991.
25. Fournier, R. O. and Rowe, J. J., Am.Min. v. 62, p. 1052-1056, 1977.
26. Däumling, U., Diploma Thesis (M.Sc.) Thesis, Eberhard-Karls-Univertität Tübingen, 1993.
27. Yoshimura, M., Kase, J., and Somiya, S., in Oxidation of Si3N4 and SiC by High Temperature-High Pressure Water Vapor, Germany, 1986, p. 529-536.
28. Herrmann, M., Klemm, H., and Schubert, C., in Hand-book of Ceramic Hard Materials, edited by Riedel, R.
(Wiley-VCH, Weinheim, 2000), p. 749-801.
29. Oda, K. and Yoshio, T., J.Am.Ceram.Soc. v. 80, p. 3233-3236, 1997.
30. Kimel, R. A. and Adair, J. H., J.Am.Ceram.Soc. v. 85, p. 1403-1408, 2002.
31. Pantano, C. G., Clark, D. E., and Hench, L. L., Corro-sion of Glass, Books for Industry, New York, 1979.
32. Grambow, B., in Uhlig´s Corrosion Handbook, 2 ed.,
2000), p. 411-437.
33. Moore, J. M., Clark, D. E., and Simmons, J. H., Ce-ramic Transactions v. 101, p. 153-158, 2000.
34. Scholze, H., Glas, 3.rd edition ed., Springer-Verlag,
Ber-lin, 1988.
35. Jantzen, C. M. and Plodinec, M. J., J.Non-Cryst.Solids v. 67, p. 207-223, 1984.
36. Feng, X., Mat.Res.Soc.Symp.Proc. v. 333, p. 55-68, 1994.
37. Darby, G., Clark, D. E., and Simmons, J. H., Ceramic Transactions v. 101, p. 141-151, 2000.
38. Sorarù, G. D., Modena, S., Guadagnino, E., Colombo, P., Egan, J., and Pantano, C., J.Am.Ceram.Soc. v. 85, p. 1529-1536, 2002.
39. Elmer, T. H., J.Am.Ceram.Soc.Comm. v. 68, p. C-273-274, 1985.
40. Meyer, H., in Technische Keramische Werkstoffe; Vol.
Kap. 5.4.1.2.1., edited by Kriegesmann, J. (Deutscher Wirtschaftsdienst, Köln, 1999), p. 1-15.
41. Wendland, K., Hollstein, T., Pfeiffer, W., Heinrich, J.,
and Zeus, D., in Korrosion und Verschlei0 von
keramischen Werkstoffen, edited by Telle, R. and
Quirmbach, P. (DKG, Köln, 1994), p. 107-113. 42. Herrmann, M., Michael, G., Schubert, C., and Hermel,
W., in Werkstoffwoche ’98; Vol. 3, edited by Kranzmann,
A. and Gramberg, U. (Wiley-VCH, Weinheim, 1998), p. 281-286.
43. Seipel, B. and Nickel, K. G., J.Europ.Ceram.Soc. v. 23,
p. 595-602, 2003.
44. Doremus, R. H., Glass Science, 2 ed., John Wiley &
Sons, N.Y., 1994.
45. Munz, D. and Fett, T., Ceramics : Mechanical Proper-ties, Failure Behaviour, Materials Selection, Vol. 36,