*e-mail: [email protected]
New driving Parameters for Diamond Deposition Reactors:
Pulsed Mode versus Continuous Mode
Alix Gicquela*, Khaled Hassounia, Guillaume Lombardia, Xavier Dutena, Antoine Rousseaub
aLaboratoire d’Ingénierie des Matériaux et des Hautes Pressions, UPR 1311, CNRS
Université Paris 13 99 Avenue Jean Baptiste Clément 93430 Villetaneuse, France
bLaboratoire de Physique des Gaz et des Plasmas,
UMR 8578, Université Paris Sud, Bât 210, F91405 Orsay Cedex
Received: January 02, 2002; Revised: September 30, 2002
Experimental investigation and modeling of pulsed H2/CH4 plasmas used for diamond deposi-tion are presented. Two plasma configuradeposi-tions are studied : a 2.45 GHz microwave cavity configu-ration and a 915 MHz surface-wave configuconfigu-ration. Time-resolved measurements of the gas tem-perature determined from the Doppler broadening of the Balmer -Hα line, of the H-atom relative density and of the discharge volume (Vpl) are reported. The experimental time-variations of the gas temperature are characterized by a sharp increase at the beginning of the pulse (t < 250 µs) and a decrease down to a stable value at steady state (t > 1 ms). The simulations enable us to estimate time-variations of the electron energy distribution function, gas temperature and chemical species densities. The in-pulse steady state temperature obtained from the model is in agreement with the measured one, although a discrepancy is obtained on the shape of the early time-variation. Calcu-lations were carried out in order to study the effects of the in-pulse power, the duty cycle and the off-plasma time on the H-atom and CH3-radical densities. It is seen that, at a constant power density averaged over a period, low duty cycles favor high H-atom and CH3 - radical densities, while too long off-plasma times reduce the H-atom density during the pulse. In addition, the production of H atoms was seen to be governed by thermal dissociation in the 2.45 GHz micro-wave cavity system, and by electronic impact dissociation in the 915 MHz surface micro-wave system, the latter operating under high gas velocities.
keywords: diamond deposition process, microwave plasma, continuous mode versus pulsed
mode, key parameters
world accepted fact that H atoms and CH3 radicals play major role for diamond growth in hot filament devices as well as in microwave plasma devices working at 1000 to 20000 Pa1-4, our objective is to improve the densities of these
species.
In continuous plasmas (cw), due to the high tempera-tures (2500 K to 3500 K) reached for power density greater than 15 Wcm-3, H-atom production is mainly driven by
ther-mal processes rather than by electronic processes5.
How-ever, due to the high gas temperatures reached in the plasma bulk, a significant increase of the reactor wall temperature is generally observed6. This strongly enhances the surface
1. Introduction
over-recombination processes and limits the excepted increase of the H-atom density due to the increase in dissociation yield. This drawback may be overcome by the use of pulsed discharges with a relatively low duty cycle (lower than 50%). Such discharges would enable to optimize the thermal heat-ing so as to insure high enough H-atom production in the discharge with the lowest possible surface losses at the re-actor walls6. The CH
3 radicals production is maximal for
gas temperature ranging between 1800 K to 2000 K, and depends linearly on H-atom density7. These conditions are
achieved at the plasma/surface interface.
The present paper is dedicated to the analysis of the changes occurring in the discharge characteristics and in the H-atom and CH3-radical production efficiency when pulsed regime is used. After the experimental and modeling methods are provided, the paper is developed around three subsections. The first presents the approach and the results obtained in a continuous microwave plasma sustained in a cavity. Two types of modeling are presented in order to un-derstand how the microwave power is coupled to the plasma, on the one hand and what are the kinetics of production and losses of the main species in the reactor on the other hand. In the second subsection is treated the effect of pulsing the plasma while the same configuration of microwave cavity is used. A time-dependant model is introduced, and the re-sults are compared to the ones obtained for continuous mode. In particular, the effects of the in-pulse microwave plasma power and of the time-averaged power are studied. Finally, in the last section, using the same time-dependant model, another configuration for a pulsed plasma is studied. The excitation frequency is lowered from 2.45 GHz to 915 MHz, higher maximum in-pulse power is used (30 kW instead of 6 kW), and a surface-wave configuration is used instead of a cavity, in addition high gas velocities are used (up to 60 ms-1 instead of 1 ms-1). In this section is studied the
ef-fect of the destruction of the H atoms during the off-plasma time, on the H-atom density during the on-plasma time.
2. Experimental setups – measurements
2.1- Experimental setups
The first plasma configuration (Fig. 1) consists of a quartz bell-jar surrounded by a cavity in which the micro-waves (2.45 GHz) generated by a Sairem GMP 60 KE power supply are injected, with a maximum power of 6 kW7. The
pressure ranges between 2500 and 20000 Pa, and for a given pressure value, the input microwave power is chosen in such a way to yield a constant ratio of the input power to the species density and a constant volume of the discharge (spherical shape in absence of the substrate holder of around 65 cm-3). In pulsed mode, the duty cycle and the in-pulse
power are monitored by a low-frequency voltage supply and followed by an oscilloscope. The couple power/pressure is
varied from 2500 Pa/600 W to 20000 Pa/6 kW, and the gas flow and the maximum methane percentage are set to 200 sccm and 5%, respectively. The substrate temperature Ts is measured with a bichromatic pyrometer (IRCON), and its value is monitored by heating or water cooling the substrate.
The second device is depicted in Fig. 28. The discharge
is generated by a 915 MHz SAIREM power supply (GLP 300 KI) with a maximum output of 30 kW. The power is coupled to the plasma using a wave guide with a 6 cm diameter aperture, perpendicular to the wave propagation direction, where a tubular quartz reactor is introduced. Effi-cient power coupling and homogeneous plasma flow was
Figure 1. Microwave diamond deposition reactor in the cavity
configuration. Excitation frequency of 2.45 GHz.
Figure 2. Reactor operating in a surface wave coupling
obtained with a tube diameter of 5 cm diameter for a wide range of working pressure, i.e. p = 5000-10000 Pa, and a power varying between 5 and 30 kW. These input power values may result in high plasma temperature and an over-heating of the reactor wall. Therefore, a double envelope quartz tube cooled with a low microwave absorption sili-con oil was used. The feed gas is pumped in a sili- constant-pressure closed circuit using a high pumping speed primary root. High gas flow velocity (5-60 ms-1) is used that yields
further heat dissipation through the heat convection flux transported by the gas exhausting the reactor. The residence time in the discharge ranges between 0.1 and 0.5 s for the experimental conditions routinely adopted in this system.
The plasma may be operated either in a continuous wave (cw) or a pulsed wave (pw) regimes. The pulse period and duty cycle may be varied in the ranges 3-30 ms and 1-100%, respectively. When operating in pw regime at 30 kW, a re-sidual input power of 3 kW is maintained during the out-pulse time. This is necessary for providing a quasi-square pulse with a fast ignition time at high in pulse power. Note that the ignition time is always less than 25 µs, which is the time required by the power supply to increase the input-power from 3 kW to the in-pulse input-power value. In this work we will mainly focus on the study of the pulsed mode.
2.2- Measurement-Experimental Validation
The H2-CH4 plasmas obtained in the device described above were investigated experimentally by optical emission and absorption spectroscopy. For this purpose, a THR 1000 Jobin Yvon monochromator equipped with a 1800 gr/mm grating along with a Hamamatsu R928 photo-multiplier were used to detect the plasma emission signal. Time-resolved emission spectroscopy was used to track the temporal evo-lution of the emission intensities of Hα line (IHα), H2(G1Σ
g +-B1Σ
u
+) band, C 2(d
3Π g-a
3Π
u) Swan band and
CH(A2∆ – X2Π) band. Argon was introduced at very low
amount in the discharge and its 750 nm emission line was used as an electrical calibrator for performing actinometry measurements and reach H atom relative densities, once this method has been validated by TALIF9.
For the 915 MHz device, the gas temperature was deter-mined from the rotational structure of the absorption band of the C2(a3Π
u) low-energy state (0.09 eV above ground
state). Under the considered discharge conditions, i. e. p > 500 -10000 Pa, the rotational mode of this low-energy state and the translation mode of heavy species may be as-sumed in thermal equilibrium. Absorption techniques en-able therefore a direct determination of the gas temperature along with C2(a3Π
u) density 10.
The absorption experiments were performed using an OSRAM stabilized xenon arc lamp as a light source. They additionally required the use of a EG&G CCD detector in-stead of the photo-multiplier for enabling data
accumula-tion and signal enhancement. The determinaaccumula-tion of gas tem-perature using absorption measurement requires integration time typically above 2 ms. Consequently absorption was only used for cw discharges. The comparison between the gas temperature determined with this technique and the ro-tational temperatures of several excited states of carbon containing species (C2, CH and CN-nitrogen being added as an impurity) and H2 molecule (especially the d3Π
u state
of the Fülcher-α system and the G1Σ g
+ state) showed that
the rotational temperature of the G1Σ g
+ state of the H 2
mol-ecule could be used as an indicator of the gas temperature for the conditions used11. Consequently, the rotational
tem-perature of the G1Σ g
+ state was used in pw mode.
In the 2.45 GHz device, the gas temperature was deter-mined by the Doppler broadening of the Hα emission line (656.3 nm ; H(n = 3)=>H(n = 2)), after this method has been validated by Talif9. For the pw mode, we assumed that the
thermal equilibrium between H(n = 1) and H(n = 3) still takes place for pulsed mode discharge6. This assumption
would be valid at least for high enough delay after the dis-charge ignition when the time-variation are smooth enough and H(n = 3) excitation proceeds through electron-impact collision with H(n = 1). The thermal equilibrium assump-tion could be however quesassump-tionable for a very short delay, immediately after the discharge ignition, where “hot” H-atom may be created through dissociative excitation of either H2 or CH4. This assumption is discussed in Ref. 6. In addition, CH3 radical densities have been measured by UV absorption spectroscopy, but only in cw mode6,12-14.
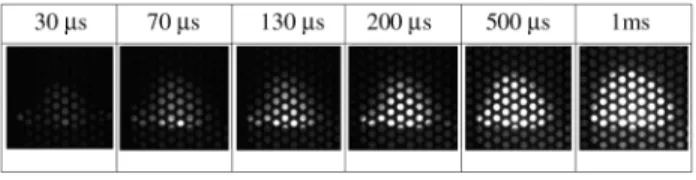
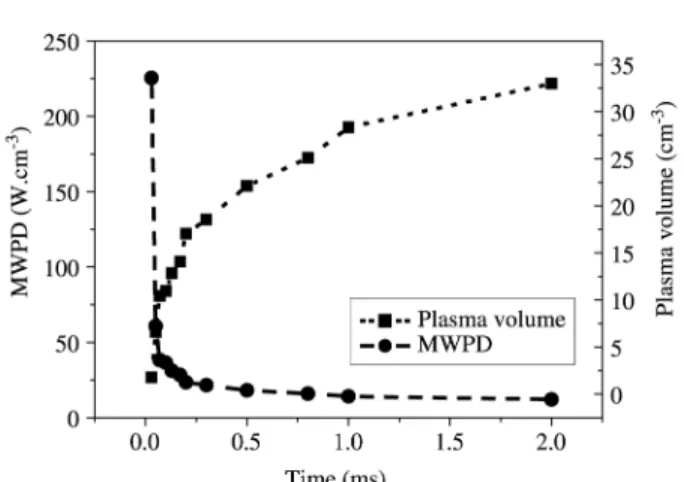
In pw mode, the time-variation of the discharge volume was measured using a set of pictures taken at frequency of approximately 30 kHz using a “Flashcam” (from PCO Com-puter Optics) (Fig. 3). The time-variation of both volume and MWPD are reported in Fig. 46. The volume-values
de-termined from the discharge pictures are used for the esti-mation of the variations of the average power density. They have been calibrated by the power density value previously determined for a continuous-mode discharge obtained at 800 W and 3200 Pa, which is the same as that obtained for the steady state in-pulse discharge.
Figure 3. Ignition of the plasma ball, observed thanks to a
3. Plasma Modeling
3.1 Plasma Modeling in continuous mode and for a cavity configuration
In order to understand the different phenomena which occur in microwave cavity plasmas typical for diamond deposition operating in cw mode, two models have been developed: a 2D self-consistent diffusive H2 plasma model15
and a non-self-consistent one-dimensional diffusive/convec-tive CH4 + H2 plasma model5.
The first model enabled us to understand how the en-ergy is deposited into the plasma and to determine the main processes which control electron energy and density, gas heating, hydrogen dissociation and plasma/surface energy transfers. The second model, which involved input data pro-vided by the self-consistent model or by experimental meas-urements, enabled us to understand the chemical kinetics and transport of H-atoms and carbon-containing species. The physical model used in the latter model describes the thermal non-equilibrium of this kind of plasma by taking into account three energy modes: the translation-rotation mode of heavy species (‘t-r’), the vibration mode of mol-ecules (‘v’) and the translation mode of electrons (‘e’). The ‘t-r’ and ‘v’ modes are described by a Maxwell-Boltzmann distribution function with two different temperatures, re-spectively denoted Tg and Tv. For the ‘e’ (electronic) mode, the electron energy distribution function (EEDF) is deter-mined for several discharge conditions by solving the elec-tron Boltzmann equation for the H2/H/CH4 system16,17. The
electron-heavy species collision rate constants are then curve-fitted as a function of the electron average energy. The use of these curve-fit along with a balance equation for the electron average energy enables us to take into account the non-Maxwellian behavior of the EEDF.
As far as chemistry is concerned, the kinetics model used in this work is similar to that of Ref. 5. The chemical non-equilibrium of the plasma is described by taking into ac-count 31 chemical species and 134 reactions. The chemical model involves three groups of reactions. The first corre-sponds to the chemical model necessary to describe a pure hydrogen plasma, while the second group describes the ther-mal cracking of methane and takes into account CHy=0 4 and C2Hy=0-6 neutral species. The third reaction group consists of collisions involving charged species such as electron impact ionization and dissociation of hydrocarbon species, ion conversion processes and dissociative recombination of hydrocarbon ions16,17.
3.2- Plasma Modeling in pulsed mode
The physical plasma model used for H2-CH4 pulsed plasma extends that previously mentioned. In principle, the prediction of the time-variation of the plasma characteris-tics requires the solution of the time-dependant transport equations for the chemical species, the flow momentum components and the total energy. In addition, the electron Boltzmann equation and an electromagnetic model that en-able to describe the plasma-wave interaction and the elec-tron heating should be considered and coupled to the plasma transport equations. This leads, for a two-dimensional ge-ometry, to a quite complex and intractable numerical prob-lem that is out of the scope of this work. We focused on the investigation of the plasma dynamic in a pulsed wave re-gime, that is on the determination of the time-variation of species densities, gas temperature and eedf in the bulk of the plasma. For doing so, a Nusselt model was used to de-scribe the plasma flow in the case of the 915 MHz surface wave configuration device8.
The Nusselt model used to describe the plasma flow in a cylindrical reactor assumes a radial homogeneous plasma volume and a linear boundary layer where all the plasma parameters are assumed to vary linearly. The thickness of the boundary layers is in addition assumed to remain con-stant along the reactor (Fig. 5). Under these assumptions, the concentration of a given species only depends on the residence time, t, in the reactor. This latter is related to the axial position through the relation t = z/<v>, where <v> is the radially averaged plasma flow velocity. The time-varia-tion of species populatime-varia-tion in the bulk of the plasma is equal to the total net production rates due to gas phase chemistry and to catalytic reactions on the reactor wall. This may be expressed using the following ordinary differential equa-tion :
ρ
s s
s
W
R
dt
dY
−
=
(1)Figure 4. Evolution of plasma volume and MWPD as a function
where Ys and Ws denote the mass fraction and the mass pro-duction rate by gas phase reaction in the bulk of the plasma for species ‘s’, respectively. r is the plasma total mass den-sity. Rs is the mass production rate of species ‘s’ by surface reactions at the reactor wall. Its determination requires the estimation of the rates, rr, for all the surface reactions, ‘r’, of the model.
In this work we have considered catalytic recombina-tion reacrecombina-tions for atoms, charged species and unstable radi-cals. The surface reactions are especially important in the case of H-atom and charged species, the consumption of which is mainly due to recombination on the reactor wall. The rate of a surface recombination reaction ‘r’ of a species ‘s’ may be expressed as:
s w s s s r
M
R
c
c
D
r
δ
δ
−
−
=
−2
(2)
where Ds, cs, cs-w and Ms are the diffusion coefficient, the bulk concentration, the surface concentration and the molar mass of the recombining species ‘s’. R is the reactor radius and δ is the diffusion boundary layer thickness.
The estimation of rr requires the determination of spe-cies ‘s’ concentration at the reactor wall. This latter may be related to the bulk concentration through the following re-lation which expresses the equality between the rates of dif-fusion flux and recombination at the reactor wall:
w s s w r w s s s
c
M
RT
c
c
D
−
−=
−π
γ
δ
8
4
(3)Where γr is the recombination coefficient for reaction ‘r’, Tw is the wall temperature and R the gas constant.
The ions recombine totally on the reactor wall and their recombination coefficients were then taken equal to 1. The recombination coefficient of H-atom on quartz was taken from Ref. 18 (γH = 10-4). There is practically no data on the
recombination coefficients of hydrocarbon radicals on quartz surface. We therefore assumed a value of 10-3 similar to that
found for CH3 recombination on diamond for the recombi-nation probability of all the hydrocarbon radicals. This as-sumption should not have an important consequence on the model results since, as reported in Ref. 18, surface reac-tions have almost no effect on the kinetics of hydrocarbon species under moderate pressure discharge conditions.
The diffusion boundary layer thickness for hydrogen species (H2, H, H+, H
2 + and H
3
+) were estimated using the
one-dimensional model of reference5,8,9. This model yields,
in the case of the investigated device (R = 5 cm), a diffusion boundary layer thickness of 2 cm for H-atom and of 5 mm for H+ and H
3
+ ions. As far as hydrocarbon species are
con-cerned, we assumed a boundary layer thickness of 2 cm for neutral species and 5 mm for ions. This assumption should also not affect the results since the populations of these spe-cies are mainly governed by gas phase reactions.
The diffusion coefficients were determined by using the collision integrals given by Yos for hydrogen species19, while
Lennard-Jones potential was assumed for estimating the diffusion coefficients of hydrocarbon species. Due to the relatively high pressure of the considered discharges, ambipolar diffusion was assumed for charged species, the diffusion coefficients of which were corrected by the factor (1+2/3<εe>/kTg) where <εe> is the average electron energy, Tg the gas temperature and k the Boltzmann constant.
The estimation of Ws in equation (1) requires the de-termination of the rate constants, kj, of all the reactions involved in the chemical model described in the previous section. These rate constants may depend either on the eedf in the case of the processes involving electrons or on the gas temperature for the processes involving only heavy species. In the present model, the eedf is determined from the solution of the time-dependant electron Boltzmann equation16,17.
Finally, the total energy equation that governs the time-evolution of the gas temperature in the frame of the model used in this work is written as:
2 H -2 ) ( 3 2 3 2 x , 1 i 1 , 1 1 n 1, = i s R v R T T PMW dt dY k Cp dt d k Cp Y h dt dY dt dT Cp Y nrs i i t w g e e e e e e n i i i g i i s ∑ ∑ ∑ = − = − ∆ − − = > < + > < + + δ λ ε ρ ε ρ ρ ρ
The left hand side (LHS) of equation (4) represents the time-variation of the total energy that includes four compo-Figure 5. Principle of the Nusselt model
nents: two components corresponding to the change of heavy species temperature and electron average energy and two other terms corresponding to the heavy species and elec-tron participation to the total change of the plasma enthalpy due to chemical reactions. The right hand side (RHS) of equation (4) includes the electomagnetic power absorbed by the plasma (PMW) and two terms that represent the en-ergy loss by conduction and enthalpic species recombina-tion at the reactor wall. The data references necessary to solve the problem can be found in Ref. 18.
In the expression of the different terms described above, Cpi and hi denote the specific heat and the formation enthalpy of a heavy species ‘i’ respectively. ∆Hi and vi denote the rate and reaction-enthalpy of surface reactions, respectively. Cpe and <εe> are the electron specific heat and average energy and k is the Boltzmann constant. The heat loss due to conduction to the reactor wall depends on the thermal conductivity and the thermal boundary layer thickness. The thermal conductivity was also estimated by using the colli-sion integrals proposed by Yos for hydrogen species19 and
Lennard-Jones interaction potential for hydrocarbon spe-cies. The thermal boundary layer thickness was also esti-mated from the one-dimensional model of reference20. A
value of 2 cm, similar to that of the boundary layer thick-ness of H-atom, was found for δt.
3.3 Bell jar configuration versus tubular reactor
The thermochemical non-stationary quasi-homogeneous plasma models used in this work are rather similar for both the 915 MHz and 2.45 GHz frequency devices. The main difference consists in the adaptation made to take into ac-count for the geometry of the reactors: a tubular reactor and, a bell jar respectively6.
For the bell jar reactor, the ratio of the plasma volume to the substrate surface necessary to estimate the rates of sur-face chemical processes was determined by considering that the discharge is a spherical cap located just above the substrate surface, and the time-variation of the power den-sity in particular at the beginning of the pulse (estimated experimentally) was taken into account. In the tubular reac-tor operating with a surface wave configuration at 915 MHz, the ratio of the plasma volume to the substrate surface was easily calculated but the power density was considered to be constant during the pulse since it could not be estimated experimentally.
For a given set of experimental conditions (pressure, input power, time-variation of the plasma volume), numeri-cal simulation solves, for the coupled set of non-stationary Boltzmann equation, species kinetics equations and a total energy equation. This enables the estimation of the time-variation of the eedf, the species density, the reduced elec-tric field and the gas temperature6.
4. Results
4.1 Continuous mode: cavity configuration, excitation frequency of 2.45 GHz
4.1.1 H-atom density and gas temperature
Axial variations in microwave power density, electron density and temperature as well as gas temperature and H-atom mole fractions extracted from the 2D self-consist-ent model are shown in Fig. 6a, 6b, 6c, 7a and 7b respec-tively for different power-pressure pairs15,21. The results show
that, while microwave power is mainly deposited in the near surface region and the electron temperature follows this behavior rather well, the gas temperature is maximal in the plasma volume. The atomic hydrogen density is also maxi-mal in the plasma volume and sharply decreases in the near surface region due to catalytic surface recombination reac-tions. The plasma electron density is around 1012 cm-3, the
major ion being H3+ in a large range of plasma conditions.
The results also show that hydrogen dissociation strongly depends on the microwave power coupled to the plasma (Fig. 7b).
Although results obtained from the 2D self-consistent model are qualitatively in agreement with those obtained from the 1D model5, some quantitative discrepancies can
be observed. In particular, 1D model calculations provide higher values of H-atom mole fraction than the 2D self-consistent model calculation do (at 8400 Pa and 1500 W which corresponds to an average power density of 22 Wcm-3,
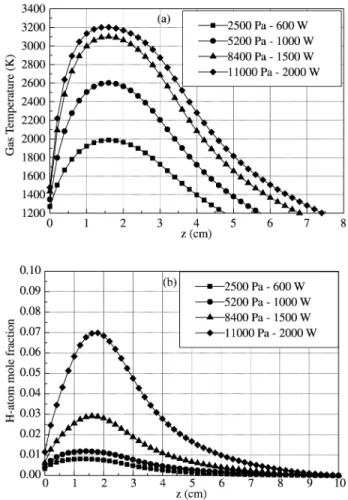
behavior in H2 + CH4. The variations in the H-atom mole fraction with power density calculated from the 1D model are shown in Fig. 8a. The H-atom mole fraction in the plasma volume is seen to vary from 1 to 12% as the power density is increased from 9 to 30 Wcm-3 (Fig. 8a), and
simultane-ously the gas temperature in the plasma volume increases from 2200 K to 3400 K (Fig. 8b). These behaviors associ-ated with the behavior of the electron temperature (Fig. 6c) indicate a change in the dissociation mechanism as the power density is increased. Indeed, the sharp increase in the pro-duction of atomic hydrogen must be related to the sharp increase in the gas temperature in particular, while the lat-ter surpasses 2200 K, since, in contrast, the electron tem-perature decreases. Thus, our conclusions are that the dis-sociation of molecular hydrogen is governed by electronic processes, while the pressure and gas temperature remains below 2000 Pa and 2000 K respectively. In contrast, ther-mal dissociation is predominant, as power density leads to a gas temperature higher than 2500 K.
Due to the decrease in the gas temperature and to the surface atom recombination at the diamond surface, a de-crease in H-atom mole fraction is observed in the near sur-face region (Fig. 7b). Finally, as a first approximation, we Figure 6. Simulated variations, on the reactor axis, of some
dis-charge characteristics vs position above the substrate (z) for dif-ferent power – pressure pairs (a) absorbed power density; (b) elec-tron density; (c) elecelec-tron temperature.
Figure 7. Simulated variations of (a) gas temperature; (b) H-atom
can admit that H-atom density at the surface is mainly con-trolled by the processes of production in the plasma volu-me (that depend on either on the electron temperature or the gas temperature) and by diffusion in the near surface region. Note, however, that, in contrast to the hot filament reactor, in this kind of system, as high electron temperature exists in the near surface region (Fig. 6b), electronic disso-ciation processes may act as a brake for the disappearance of atomic hydrogen in this region.
4.1.1 Carbon containing species
For all the discharge conditions considered in this work, the major hydrocarbon species is C2H2; its value is approxi-mately two times less than that of methane introduced in the feed gas and is practically constant in the discharge4. In
contrast, the axial density profiles of the other hydrocarbon species show very strong variations, several orders of mag-nitude for some species. These variations are strongly linked to that of the gas temperature.
Figure 9a shows profiles of calculated CH3-radical den-sity along the reactor for three power densities (MWPD)4.
As observed experimentally, for 15 Wcm-3 and 22 Wcm-3,
an increase in the methyl-radical density appears in the near
substrate region (at around 2 mm/substrate). Experimental and calculated results lead support to the conjecture that methyl radical concentration is tightly coupled to the hy-drogen dissociation fraction and to the gas temperature (Fig. 9b), in accordance with the partial equilibrium of the hydrogen abstraction reactions :
CH4 + H ↔ CH3 + H (5)
CH3 + H ↔ CH2 + H2 (6)
CH2 + H ↔ CH + H2 (7)
CH + H ↔ C + H2 (8)
Thus, the linear variation of CH3-radical density as a function of methane percentage observed in reference7 is
attributed to the shift in reaction (5) towards the production of CH3, since the H-atom density remains constant as a func-Figure 8. Variations of (a) H-atom mole fraction; (b) gas
tempera-ture vs averaged power density.
tion of methane percentage. As well, the increase and the shift towards the surface in CH3-radical density with power density observed in the near surface vicinity (Fig. 9a) is attributed to the steeper gradient in the gas temperature and the increase of the H-atom density as the power density in-creases (Fig. 9b) (shift in the reaction (5) towards the right). However, as the gas temperature becomes greater than 2000-2200 K, reaction (6) is also shifted to the right, result-ing in a decrease in CH3-radical density. Thus, the strong decrease in CH3-radical density in the plasma volume (at 20 mm from the substrate) is attributed to the strong in-crease in the gas temperature with power density (from 2200 K to 3200 K as power density increases from 9 to 22 Wcm-3) that promotes dissociation of CH
3.
From these results, we can draw some conclusions con-cerning the surface H-atom and CH3-radical densities con-trolling parameters, in cw mode. While H-atom density at the surface is mainly governed by its production in the plasma volume (controlled by the gas temperature and/or the electron temperature) and by a diffusion process in the near surface region, methyl radical density is mainly gov-erned by gas-phase thermally activated reactions occurring in the near-substrate region (although the gas temperature gradient itself is controlled by diffusion processes).
4.2 Pulsed mode: cavity configuration, excitation
frequency of 2.45 GHz6
Up to now, only few sets of experimental conditions have been analyzed, and the results presented here correspond to a pressure of 3000 Pa, an input power of 800 W and a feed gas composition of H2:CH4 = 95:5.The diamond substrate temperature was set to 1000 K, which corresponds to a sur-face recombination coefficient of 0.1 for H-atom18.
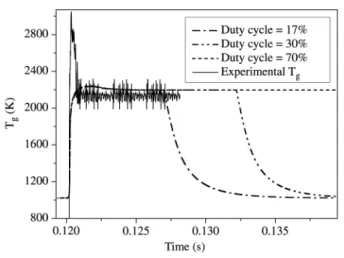
Figure 10 shows the calculated time-variation of the gas temperature for duty cycles varying from 17% to 70%. Comparison with the temperature measured from the Dop-pler broadening of Hα emission line with a duty cycle of 17% shows that although a very good agreement is obtained for the steady state in-pulse value, there is a substantial dis-crepancy on the value of the maximum temperature during the strong heating phase. As a matter of fact, while the H(n = 3) shows a maximum value of 3000 K correspond-ing to an overheatcorrespond-ing of 800 K with respect to steady state, the model only yields a maximum of 2300 K correspond-ing to an overheatcorrespond-ing of 100 K. Many explanations involv-ing criticism of either the experimental method used to de-termine the temperature or some uncertainty in the experi-mental plasma volume, are discussed in Ref. 6.
Beyond the different explanations, the most probable is the following: once all the microwave power is transferred into the discharge (after 30 µs), the plasma ignites just above the substrate in a very small region with a strong electric
field (where the reduced field E/N is the highest6).
There-fore, during the first stage, the 800 W microwave power are coupled in a small volume above the substrate (Fig. 4). This results in a considerably high local MWPD values and con-sequently in a strong gas heating and a high gas tempera-ture. The second phase of the discharge is characterized by the increase of the plasma volume and a subsequent de-crease of MWPD and gas temperature. In this case, the ob-tained discrepancy could be attributed to some uncertainty in the experimental estimation of the plasma volume. The time-variations obtained from simulations are indeed strongly sensitive to the input values of the volumetric power density which may be subject to a substantial error with an important consequence on the predicted Tg value, especially in the early stage of the pulse. Also, the assumption of quasi-homogeneous plasma may break down during this early stage where the plasma volume undergoes a quite strong expansion. If the quasi-homogeneous plasma assumption breaks down during the early stage of the pulse, the im-provement of the description of this phase requires at least the use of 1D model that would properly describes the dis-charge expansion and the spatial non-homogeneity.
In any case the present model gives satisfactory predic-tion of the steady state in-pulse values. In addipredic-tion, the steady state in-pulse values are identical to those obtained in cw plasma, and they depend only on the in-pulse power den-sity and not on the power denden-sity averaged over a period as this has been demonstrated in Ref. 6. On the contrary, the wall temperatures depend on the time-averaged power den-Figure 10. Comparison between calculated and experimental
time-resolved Hα temperature (gas temperature). Experimental plasma conditions: in-pulse power 800 W, 3200 Pa, power density = 12 Wcm-3; duty cycle 17%; 2 cm from substrate.
sity, and not on the in-pulse power density6.
4.2.1 Influence of the duty cycle on gas temperature and active species densities
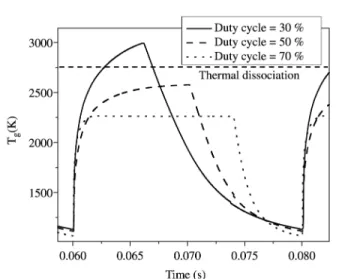
To study the effect of the in-pulse power on the produc-tion of H-atoms and CH3 radicals, the time-averaged input microwave power was set constant to 600 W averaged over a constant period of 20 ms, while three values of duty cycle were tested: 30, 50 and 70%, with in-pulse durations of 6, 10 and 14 ms respectively. The corresponding in-pulse powers were then 2 kW, 1,2 kW and 850 W respectively.
Figure 11a shows the H-atom density obtained for sev-eral duty cycle values. The H-atom density strongly increases as the duty cycle is decreased, and reaches 1.8 ×1016 cm-3
for a duty cycle of 30%, and 1015 cm-3 for a duty cycle of
70%. It is attributed to the increase in the gas temperature with the in-pulse power, the temperature being maximal at low duty cycle as shown in Fig. 12. Indeed, under these conditions, the main H2 dissociation mechanisms is ther-mal, and at a duty cycle of 30%, it is seen that Tg reaches 2800 K, while at a duty cycle of 70%, it reaches only 2250 K. Simultaneously, the corresponding H-atom mole fraction are 7% and 1% respectively. These properties of pulsed dis-charges may be interesting for the deposition of high qual-ity diamond.
We can observe in Fig. 11b the same behavior for CH3, with a density increased by a factor of 5 when the duty cy-cle varies from 50% to 30%, for the power density of 600 W, averaged over the period. The production of the methyl radi-cal is indeed mainly governed both by the gas temperature (in the range 1800 K - 2000 K) and the H-atom mole-frac-tion, these ranges are reached, for the duty cycle of 30%, during the first 250 µs.
4.3 Pulsed mode: surface wave configuration, excitation frequency of 915 MHz
Calculated and measured gas temperatures were com-pared, as in the previous section, for discharge conditions corresponding to an average MWPD of around 12 Wcm-3:
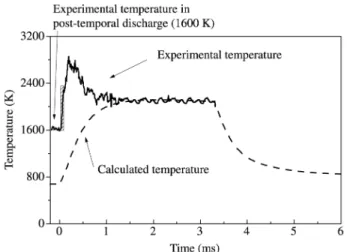
duty cycle of 10 %, discharge duration of 3 ms, in-pulse power of 12 kW, off-pulse power 3 kW, pressure 2000 Pa (Fig. 13). Again, a good agreement is observed for the steady state temperature while a discrepancy appears during the strong heating of the gas (first 500 µs). The discrepancy is here still stronger than in the previous case since the calcu-lations do not take into account the variations of the plasma volume at the ignition.
It is worth noting that, for almost the same MWPD as for the cavity configuration, the steady state gas tempera-ture reached during the pulse is almost identical (2200 K), confirming that the gas temperature is controlled by the in-pulse power density.
Figure 11. (a) Calculated H-atom density for different duty
cy-cles; (b) calculated CH3-radical density for different duty cycles, at a constant average microwave power of 600 W.
Figure 12. Evolution of the gas temperature as a function of the
The calculated and measured actinometric ratios IHα/IAr are compared in Fig. 14, while the calculated H-atom mole fraction and calculated < IHα/IAr > are reported in Fig. 15. The H-atom mole fraction reaches a value of 0.1 at the end of the pulse which is much higher than the corresponding value obtained in the MW cavity plasma (xH = 0,01) al-though the gas temperature was seen to be identical. Since the weights of the thermal dissociation in the production rate of H-atom is similar for the two configurations in the considered discharge conditions, we can say that molecular hydrogen dissociation proceeds mainly through electronic
process (Te = 17000 K and ne = 1012 cm-3 vs.15000 K and
2.1011 cm-3 respectively in the cavity configuration) in the
surface wave configuration. The CH3-radical density shows a maximum value at the mid-pulse as already observed for the cavity case.
4.3.1 Effect of duty cycle on the plasma composition and temperatures
To pursue our investigation on the interest of pulsing discharges for growing diamond, several simulations have been performed. In order to evaluate another parameter than the in-pulse power, instead of changing the in-pulse power as we did for the cavity case, here we kept it constant and varied instead the duty cycle. The interest was to observe the effect of recombination processes on the H-atom den-sity in particular. The conditions are given in Table 1. All the simulations were performed for a pulse duration of 3 ms, an in-pulse power of 12 kW, a pressure of 2000 Pa and a H2/5% CH4 mixture.
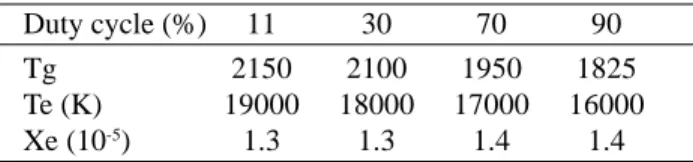
Table 2 shows that as the duty cycle increases the elec-tron temperature as well as the gas temperature decrease while the electron density is slightly increasing. Simultane-ously the H-atom mole fraction strongly increases and the CH3-radical mole fraction decreases (Fig. 16). Since the pro-duction term is controlled by the in-pulse power density, which is maintained constant, the increase in H-atom mole fraction as a function of the duty cycle can only be attrib-uted to the decrease of the off-plasma time as the duty cycle increases, which prevents recombination of H-atom during this stage. As far as CH3-radical density is concerned, its Figure 13. Time-resolved Hα temperature (gas temperature) in
the surface wave configuration (915 MHz). Plasma conditions: in-pulse power 12 kW, off-in-pulse power 3 kW, 2000 Pa, duty cycle 10%, gas velocity 20 ms-1, measurement at the gap. Comparison
with the gas temperature obtained from experiments (Hα tempera-ture) and from modeling.
Figure 14. Time-resolved calculated and measured actinometric
ratios IHα/IAr, (the calculated H-atom mole fraction is also reported). Plasma conditions identical as in Fig. 13.
Figure 15. Variations of the H-atom mole fraction and measured
5. Conclusion
This paper was dedicated to the determination of new driving parameters which control the production and loss of the main active species for diamond growth (H atoms and CH3 radicals) in pulsed plasmas relatively to continu-ous plasmas.
In continuous mode, the H-atom density at the diamond surface was seen to be mainly controlled by its production term in the plasma bulk and governed by the gas tempera-ture (directly related to the microwave power density), and by the diffusion process at the plasma/diamond surface in-terface. The CH3-radical density was seen to be completely controlled by the gas temperature and H-atom gradients at the plasma/diamond surface interface.
Due to the major role of power density on H-atom pro-duction, very high power must be injected to improve dia-mond deposition reactors. However, high thermal transfers to reactor walls lead to their strong heating. This effect was seen to be prevented by using pulsed discharges. H-atom production can be insured by very high in-pulse power den-sity and optimal off-pulse duration, long enough to prevent wall heating and atom catalytic recombination enhancement (These are related to the time-averaged power and not to the in-pulse power density), and short enough to limit the duration of H-atom consumption phase.
In pulsed mode, additional parameters which control H-atom and CH3-radical production and loss terms have been identified: in-pulse power density controls gas tem-perature and then thermal dissociation, while off-plasma time controls volumetric recombination process and H-atom consumption kinetic. Optimization of H-atom density in pulsed mode implies then a compromise between short duty cycle that allows to increase the in-pulse power keeping constant the averaged power, and short off-plasma time that limits H-atom recombination. As far as CH3 radical is con-cerned, its production remains directly related to the gas temperature (in the range 1800 K to 2000 K) and H-atom density.
While in cavity configuration operating at pressure higher than 2500 Pa and power greater than 1 kW, the H-atom density was seen to be, in pulsed mode, still con-trolled by thermal dissociation (the in-pulse power density was always greater than 12 Wcm-3), in surface wave
con-figuration, electronic dissociation was seen to play an im-portant role. As a matter of fact, with this configuration, pressure of around 2000 Pa was currently used, and in ad-dition the excitation frequency was lower than in the cavity configuration (915 MHz instead of 2.45 GHz). The way as the power is coupled to the plasma leads to much larger plasma volume than in the cavity configuration, leading to lower power density for identical injected power. Further-more, according to the gas velocity, which can be varied Table 2. plasma parameters as a function of the duty cycle.
Sur-face-wave configuration with constant in-pulse power (12 kW), off-pulse power (3 kW), pressure (2000 Pa) and plasma duration (3 ms). Excitation frequency of 915 MHz.
Duty cycle (%) 11 30 70 90
Tg 2150 2100 1950 1825
Te (K) 19000 18000 17000 16000
Xe (10-5) 1.3 1.3 1.4 1.4
Figure 16. Variations of the H-atom mole fraction and the CH3 -radical mole fraction averaged over a period as a function of the duty cycle. Plasma conditions 915 MHz/surface wave configura-tion/ In-pulse power 12 kW, off- pulse power 3 kW, pulse duration 3 ms, period variation from 3.3 ms up to 30 ms.
Table 1. Average power as a function of the duty cycle.
Surface-wave configuration with constant in-pulse power (12 kW), off-pulse power (3 kW), pressure (2000 Pa) and plasma duration (3 ms). Excitation frequency of 915 MHz.
Period (ms) Cyclic ratio (%) Average power
3.33 90 % 10.8
4.2 70 % 8.4
6 50 % 6
10 30 % 3.6
30 11 % 1.3
from 1 to 60 ms-1, the gas temperature can be lowered
sub-stantially even while a high in-pulse power is injected. For this configuration, gas velocity and electron temperature and density became therefore new determining parameters for optimizing the reactor in the aim of depositing diamond films.
Acknowledgements
This work has received a financial support from DGA.
References
1. Harris, S.J. Appl. Phys. Lett., v. 56, n. 23, p. 2298, 1990. 2. Goodwin, D.G. J. Appl. Phys., v. 74, n. 11, p. 6888, 1993. 3. Butler, J.E.; Woodin, R.L. Phil. Trans. R. Soc. Lond. A,
v. 342, p. 209, 1993.
4. Gicquel, A.; Silva, F.; Hassouni, K. J. Electrochem. Soc., v. 147, n. 6, p. 2218, 2000.
5. Hassouni, K.; Leroy, O.; Farhat, S.; Gicquel, A. Plasma Chem. Plasma Process., v. 18, p. 325, 1998.
6. Lombardi, G.; Duten, X.; Hassouni, K.; Gicquel, A.; Rousseau, A. submitted to J. Electrochem. Soc., 2002. 7. Cappelli, M.A.; Owano, T.G.; Gicquel, A.; Duten, X.
Plasma Chem. Plasma Process., v. 20, n. 1, p. 1-12, 2000. 8. Hassouni, K.; Duten, X.; Rousseau, A.; Gicquel, A.
Plasma Sources Sci. Technol., v. 10, p. 61, 2001. 9. Gicquel, A.; Chenevier, M.; Hassouni, K.; Tserepi, A.;
Dubus, M. J. Appl. Phys., v. 83, n. 12, p. 7504, 1998. 10. Duten, X.; Rousseau, A.; Gicquel, A.; Leprince, P. J.
Appl. Phys., v. 86, n. 9, p. 5299, 1999.
11. Duten, X.; Rousseau, A.; Hassouni, K.; Leprince, P.; Gicquel, A. submitted to J. Phys. D., 2002.
12. Zalicki, P.; Ma, Y.; Zare, R.N.; Wahl, E.H.; Owano, T.G.; Kruger, C.H. Appl. Phys. Lett., v. 67, n. 1, p. 144, 1995. 13. Childs, M.A.; Menningen, K.L.; Chevako, P.; Spellmeyer, N.W.; Anderson, L.W.; Lawler, J.E. Phys. Lett. A, v. 171, p. 87, 1992.
14. Loh, M.H.; Cappelli, M.A. Appl. Phys. Lett., v. 70, n. 8, p. 1052, 1997.
15. Hassouni, K.; Grotjohn, T.A.; Gicquel, A. J. Appl. Phys., v. 86, p. 134, 1999.
16. Capitelli, M.; Colonna, G.; Hassouni, K.; Gicquel, A.; Plasma Chem. Plasma Process., v. 16, n. 2, p. 153, 1996. 17. Hassouni, K.; Gicquel, A.; Capitelli, M.; Loureiro, J.; Plasma Sources Sci. Technol., v. 8, n. 3, p. 494, 1999. 18. Krasnoperov, L.N.; Kalinovski, I.J.; Chu, H.N.; Gutman,
D.J. J. Phys. Chem., v. 97, p. 11787, 1993.
19. Yos, J.M. Technical Memorandum RAD, TM-63-7, AVCO-RAD, 1963, Wilmington, Mass.
20. Gicquel, A.; Hassouni, K.; Breton, Y.; Chenevier, M.; Cubertafon, J.C. Diamond and Related Materials, v. 5, p. 336, 1996.