1137
HEARING CONDITIONS OF GAS STATIONS ATTENDANTS
Condição auditiva de frentistas
Tania Maria Tochetto (1), Lenita da Silva Quevedo (2), Márcia do Amaral Siqueira (3)
(1) Speech Language Pathologist, Associate Professor, Department of Speech Language Pathology, Federal Uni-versity of Santa Maria – UFSM; PhD in Human Commu-nication Disorders by the Federal University of São Paulo – UNIFESP
(2) Speech Language Pathologist; College Professor of the Speech Language Pathology course at the University of Passo Fundo, Master in Human Communication Disorders by the Federal University of Santa Maria – UFSM, Santa Maria, RS, Brazil.
(3) Speech Language Pathologist from the Reference Center for Occupational Health of Santa Maria; Master in Human Communication Disorders by the Federal University of Santa Maria – UFSM, Santa Maria, RS, Brazil.
Conlict of interest: non-existent
neurotoxic substances that are harmful to the CNS (central nervous system), causing damage to brain stem, cerebellum and cerebral cortex1.
Many toxicological research centers in the ield of neurology and neurotology are researching the action of organic solvents in the auditory system. The main reason is that the organic solvents, wides-pread in the industry, are characterized by high volatility and lipid solubility, which facilitates their absorption in tissues and their binding to lipids. As the nerve tissue is composed mainly of lipids, it is particularly sensitive to the toxicity of solvents2.
Hearing loss induced by chemical exposure is often moderate to severe, as well as hearing loss induced by high sound pressure levels (HSPLIHL). However, the high-frequency audiometry, unusual in HSPLIHL assessments, should be presented in investigations of chemical exposures in the long term, and some studies indicate that a wider range of frequencies are affected in exposures to chemicals, when compared to the frequency range affected by noise3.
Several studies suggest damage to the central portion of the auditory system or in the brain stem INTRODUCTION
Chemicals such as organic solvents, are present in several industrial areas and may cause damage to workers’ health as they have varied toxic charac -teristics, ranging from cancer to ototoxic.
Organic solvents are chemicals that contain at least one carbon atom and a hydrogen atom, lipo-philic and have a high afinity with rich tissues in lipid such as the brain tissue. They are known to be
ABSTRACT
Purpose: to evaluate the hearing threshold in the conventional frequencies and high frequencies, and the integrity of the acoustic relex, in subjects exposed to fuels. Method: attendants of three gas stations were evaluated in Santa Maria/RS. After the adaptation to the inclusion criteria, the sample was composed of 24 subjects. It was used the Pure Tone Audiometry, high frequency audiometry and acoustic immitance assessment to evaluate the sample. The time of exposition ranged from one to seventeen years. The control group was composed by 24 not exposed subjects. Results: the average of the thresholds of the PTA and of the high frequency audiometry was superior in the study group in all the tested frequencies. A statistically signiicant difference of thresholds was veriied on the frequencies of 0,5 (p=0,004), 2 (p=0,001), 3 kHz (p=0,025), and frequencies of 9 (p=0,007) e 10 kHz (p=0,026). In 16, 18, 20 kHz a greater absence of responses was observed in the study group (p>0, 05). Also it was observed a greater absence of acoustic relexes (ipsilateral and contralateral) at the study group, on the right ear. On the left ear, there was no difference between the groups, for the occurrence of ipsilateral relex. The absence of the contralateral relex was superior in the study group on all frequencies tested. Conclusion: individuals exposed to fuels with normal hearing thresholds may have cochlear and central alterations.
pure tone audiometry (PTA), high-frequency audio-metry, tympanometry and acoustic relex.
Inspection of the external auditory canal was performed with the Clinical Klinic Welch-Allyn Otos-cope, to verify the presence of excessive cerumen or other change that would prevent the tests or that could alter the outcome of the same. Audiological evaluations were conducted in a quiet environment, inside a soundproof booth.
Examination of pure tone audiometry (PTA) was performed in a soundproof booth, with two-channel digital audiometer Interacoustics AC40 model with TDH-39. The PTA assessed the patients’ hearing thresholds at frequencies of 0.5, 1, 2, 3, 4, 6 and 8 kHz.
The hearing by airborne was considered normal when the thresholds at frequencies between 0.25 and 8 kHz were less than or equal to 25 dBHL8.
The high-frequency audiometry was performed on an audiometer Interacoustics AC40 model at frequencies of 9, 10, 12.5, 14, 16, 18 and 20 kHz, with headphones Koss R/80. For the threshold study, the used technique was descending with 10 dB intervals until the individual no longer responded to sound. From this intensity, the ascending tech-nique was used at intervals of 5 dB until the subject could hear the sound.
The tympanometry and the research on the acoustic relexes in the ipsilateral modes (1 and 2 kHz) and contralateral (0.5, 1, 2 and 4 kHz) were evaluated in middle ear analyzer Interacoustics model AT 235. The tympanometry were classiied into A, As, B or C9. The contralateral acoustic relec -tions were classiied as normal, when triggered an intensity from 70 to 90 dBHL above threshold established in the PTA; absent when not triggered until the maximum intensity reached by the device, and exacerbated when the difference between the threshold and the PTA acoustic relex threshold was greater than 90 dB HL in the frequency test.
To exclude the possibility of hearing disorders caused by high sound pressure levels, the sound pressure level at the three stations in the study was measured. The measurement was performed with a dosimeter Model Q-400, adjusted for compensation scale “A” and slow response speed. The device was placed at the waist of the worker and a microphone was stuck to his ear without interfering with his movements. The dosimeter was installed at eight o’clock in the morning and removed at four o’clock in the afternoon corresponding to the daily working hours.
The average threshold of the high-frequency audiometry of exposed subjects was compared with the average of the control group, according to the time of exposure to the fuel by the workers. Thus, caused by organic solvents, which is not observed
in the case of HSPLIHL4-6.
Toluene can depress the central auditory system that controls the acoustic relex of the middle ear. This may partially explain the synergistic effects of co-exposure to noise and solvent7.
Thus, the present study aimed to evaluate the hearing thresholds in conventional frequencies and high frequencies, and even integrity of the relex arc of the middle ear in gas station attendants.
METHOD
This study is a quantitative study.
The inclusion criteria of the selected gas stations were: gas stations in the city of Santa Maria (RS) with higher fuel marketing and open for 24 hours. According to this criterion, we selected three gas stations and a total of 78 workers.
Inclusion criteria for the subjects were: not having otologic past, presenting normal hearing thresholds (250-8000 Hz) and tympanogram curve type A, being younger than 40 years old, having no history of exposure to noise, organic solvents or pesticides, not making use of ototoxic medication. The subjects could not have a history of noise exposure or other harmful agent to audition before having worked in the Gas Station, i.e., the irst exposure to harmful agents must have been at the gas station.
After the application of the inclusion criteria with the 78 subjects who worked in the three gas stations the sample consisted of 24 subjects, 21 males and three females, aged from 20 to 40 years old.
All subjects worked in the supply platform of the station, getting exposed to vapors of organic solvents that make up gasoline. The exposure time varied from one to 17 years because some gas station attendants have worked a lifetime at gas stations, reaching 17 years of exposure.
A control group was used to make it possible to compare subjects exposed and not exposed to chemical agents. The control group consisted of subjects with no history of noise exposure or chemi -cals, and also no history of hearing disorders. There were 21 men and three women, aged from 20 to 38 years old.
We studied the auditory thresholds in conven-tional frequencies and high frequencies and even the integrity of the relex arc in gas station attendants.
The subjects were evaluated after reading and signing the free and informed consent (IC).
Data collection was performed at the Speech Language Pathology room of the CEREST of Santa Maria.
Auditory condition of gas station attendants
1139
For statistical analysis of the frequencies of 9, 12.5 and 14 kHz was used Mann-Whitney test, as the comparison is between independent nonpa-rametric samples. The frequency of 10 kHz, as a parametric variable was analyzed using the t test. Results were considered signiicant when p <0.05.
For statistical analysis of the acoustic relex the chi-square test was used.
RESULTS
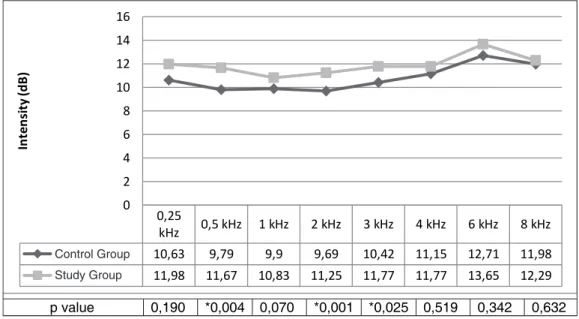
Although all individuals in the study group and the control group have presented hearing thresholds within normal limits in conventional audiometry, the average hearing threshold was higher in the study group at all frequencies, being the difference of threshold statistically signiicant at frequencies of 0,5 (p=0.004), 2 (p=0.001) and 3 kHz (p=0.025), when compared the study group and the control group (Figure 1).
the subjects in the study group were divided into three subgroups according to the time of exposure: 1) one to three years, 2) three years and one month to ive years, and, 3) over ive years exposure. The three groups of exposure were divided according to the suggested by previous studies4,10.
The research project was approved by the Ethics Committee and Human Research of the Federal University of Santa Maria (UFSM) under number 23081.011007/2010-80 and was run in partner-ship with the Center for Excellence in Occupational Health (CEREST) Santa Maria (RS).
The indings of PTA and high frequency audio -metry were analyzed without distintion as to each ear, as the comparison between them was not signi-icant (p> 0.05). For comparison between the ears, we used the Wilcoxon test.
The comparison between groups of hearing thresholds in PTA and high frequency audiometry was performed using the nonparametric Mann--Whitney test.
kHz: kilohertz, dB: decibel, Mann-Whitney test (p <0.05)
Figure 1 – Average thresholds of PTA from the study group and the control group in both ears, according to the frequency
group, for all frequencies. However, statistically signiicant differences in the frequencies of 9 (p = 0.007) and 10 kHz (p = 0.026) (Figure 2).
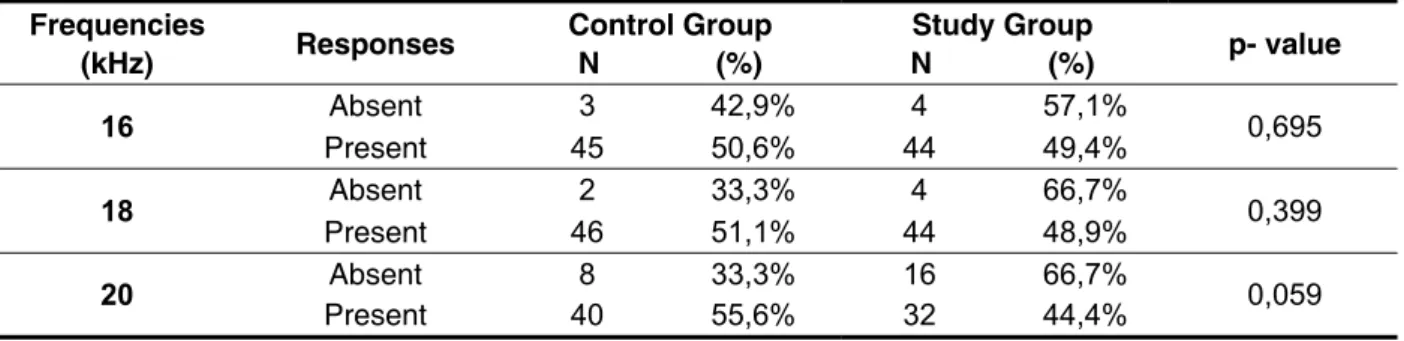
The absence of responses to frequencies of 16, 18 and 20 kHz was higher in the study group compared to the control group, but no statistically signiicant difference (p> 0.05) (Table 1).
The data from the high-frequency audiometry were analyzed separately because the frequencies from 9 to 14 kHz, and continuous variables were the frequency of 16, 18 and 20 kHz was variable not continuous as some responses were absent.
The average threshold at high frequencies were higher in the study group compared to the control
0,25
kHz 0,5 kHz 1 kHz 2 kHz 3 kHz 4 kHz 6 kHz 8 kHz Grupo controle 10,63 9,79 9,9 9,69 10,42 11,15 12,71 11,98 Grupo estudo 11,98 11,67 10,83 11,25 11,77 11,77 13,65 12,29
0 2 4 6 8 10 12 14 16
In
te
n
si
ty
(d
B
)
Average
Threshold
‐
PTA
p value 0,190 *0,004 0,070 *0,001 *0,025 0,519 0,342 0,632
9 kHz 10 kHz 12,5 kHz 14 kHz
Grupo controle 25,42 27,5 33,75 45,21
Grupo estudo 31,56 32,71 39,06 47,08
0 5 10 15 20 25 30 35 40 45 50
In
te
n
si
ty
(d
B
)
Average
high
frequency
thresholds
p valor 0,007* 0,026* 0,075 0,468
kHz: kilohertz, dB: decibel, Mann-Whitney test (p <0.05)
Figure 2 – Average thresholds of high-frequency audiometry in the study group and the control group in both ears, according to the frequency
Frequencies
(kHz) Responses Control Group N (%) N (%) Study Group p- value
16 Absent 3 42,9% 4 57,1% 0,695
Present 45 50,6% 44 49,4%
18 Absent 2 33,3% 4 66,7% 0,399
Present 46 51,1% 44 48,9%
20 Absent 8 33,3% 16 66,7% 0,059
Present 40 55,6% 32 44,4%
Table 1 – Occurrence of responses for high frequency in both ears, according to the group
kHz: kilohertz, the chi-square test (p <0.05)
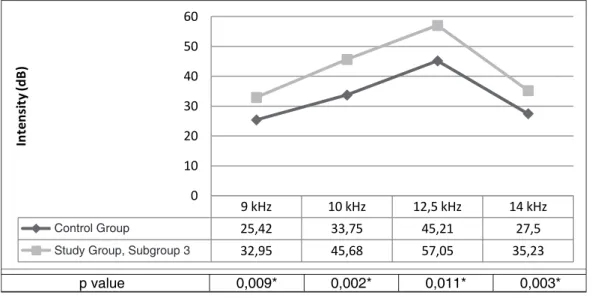
The average thresholds of the study group and control group, for the frequencies of 9, 10, 12.5 and 14 were also compared in regards to the exposure time (subgroups 1, 2 and 3). There was no statisti-cally signiicant difference for the average threshold (p> 0.05) in any frequency when compared to the
Auditory condition of gas station attendants
1141
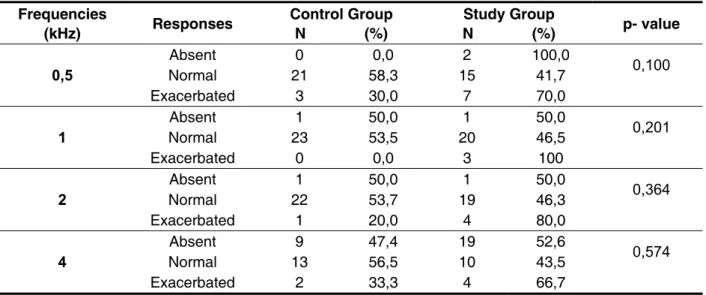
The absence of contralateral acoustic relex on the right ear was higher in the study group than to the control group, in the frequencies of 0.5 and 4 kHz. The number of subjects with exacerbated contrala -teral acoustic relex was higher in the study group than in the control group at all frequencies (0.5, 1, 2 and 4 kHz), while in the frequency of 1k Hz no individual of the control group showed exacerbated relection acoustic. The results of the contralateral acoustic relex of the right ear were not statistically signiicant (p> 0.05) (Table 3).
In the analysis of the acoustic relex, there was a statistically signiicant difference between the ears, therefore analyzes were made for each ear separately.
There was a greater absence of ipsilateral acoustic relex in the study group when compared to the control group, the frequencies of 1 and 2 kHz, although the results were not statistically signiicant (p> 0.05) (Table 2).
The ipsilateral acoustic relex of the right ear showed a higher percentage of absence when compared to the contralateral acoustic relex of the same ear (Tables 2 and 3).
kHz: kilohertz, dB: decibel, Mann-Whitney test (p <0.05)
Figure 3 – Average thresholds of high-frequency audiometry in the study group (subgroup 3) and the control group in both ears, according to the frequency
kHz: kilohertz, the chi-square test (p <0.05)
Frequencies
(kHz) Responses Control Group N (%) N (%) Study Group p- value
1 Absent 2 22,2 7 77,8 0,064
Present 22 56,4 17 43,6
2 Absent 1 20,0 4 80,0 0,156
Present 23 53,5 20 46,5
Table 2 – Occurrence of acoustic relex in ipsilateral mode in the right ear at frequencies of 1 and 2 kHz, according to group
9 kHz 10 kHz 12,5 kHz 14 kHz
Grupo controle 25,42 33,75 45,21 27,5
Grupo estudo ‐ subgrupo 3 32,95 45,68 57,05 35,23
0 10 20 30 40 50 60
In
te
n
si
ty
(d
B
)
frequencies
p value 0,009* 0,002* 0,011* 0,003*
Control Group
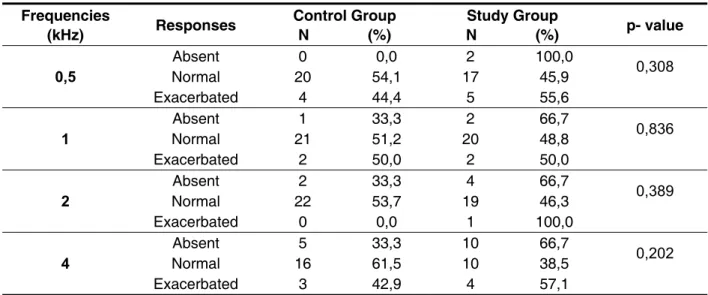
group, but only at frequencies of 0.5, 2 and 4 kHz. There was no statistically signiicant difference (p> 0.05) between the results of contralateral acoustic relex of the left ear, when comparing the control group and study group (Table 5).
The absence of contralateral acoustic relex was higher in the study group than in the control group at all frequencies (0.5, 1, 2, 4 kHz), while in the frequency of 0.5 kHz there was no acoustic relex in the control group. Similarly, the exacerbated acoustic relex had higher incidence in the study
Frequencies
(kHz) Responses Control Group N (%) N (%) Study Group p- value
0,5
Absent 0 0,0 2 100,0
0,100
Normal 21 58,3 15 41,7
Exacerbated 3 30,0 7 70,0
1
Absent 1 50,0 1 50,0
0,201
Normal 23 53,5 20 46,5
Exacerbated 0 0,0 3 100
2
Absent 1 50,0 1 50,0
0,364
Normal 22 53,7 19 46,3
Exacerbated 1 20,0 4 80,0
4
Absent 9 47,4 19 52,6
0,574
Normal 13 56,5 10 43,5
Exacerbated 2 33,3 4 66,7
kHz: kilohertz, the chi-square test (p <0.05)
Table 3 – Occurrence of acoustic relex in contralateral mode in the right ear at frequencies of 0.5, 1, 2 and 4 kHz, according to group
In the left ear, there was no difference between groups in relation to the absence of ipsilateral acoustic relex frequency of 1kHz. Yet, in the
frequency of 2kHz, the control group showed greater changes than in the study group, but no statistically signiicant difference (p> 0.05) (Table 4).
Frequencies
(kHz) Responses Control Group N (%) Study Group N (%) p- value
1 Absent 2 50,0 2 50,0 1,000
Present 22 50,0 22 50,0
2 Absent 3 60,0 2 40,0 0,637
Present 21 48,8 22 51,2
kHz: kilohertz, the chi-square test (p <0.05)
Auditory condition of gas station attendants
1143
hearing loss in the group exposed to toluene and n-hexane together, when compared to the group exposed to a mixture of other solvent, which is most prevalent in the group.
The subjects of this study were only exposed to solvents and did not have any change in frequency of PTA. On the other hand, study17 refer abnormal audiograms in workers exposed to solvents and noise, where there was 63% degradation of subjects with one or more high frequencies unilaterally or bilaterally.
Individuals exposed to noise and solvents5,18,19 and workers exposed to noise and toluene4.20 presented a higher prevalence of sensorineural hearing loss, affecting mainly the frequencies 3-6 kHz, when compared to other groups.
Out of the 328 workers assessed by researchers21, 46 had hearing loss in PTA, with the highest preva-lence of hearing loss (54.9%) in the group exposed to noise and solvents. A study that examined the auditory risk in subjects exposed to harmful agents, reported increased risk for subjects exposed to the mixture of chemicals (40%), even when compared to subjects exposed to chemicals and noise (30%)22. On the other hand, a study4 reported a risk for hearing loss ive times higher for the group exposed to the solvent mixture, and eleven times greater for the group exposed to noise and toluene. In another study23, it also showed higher likelihood of hearing loss in the group exposed to noise and solvents (ive times). The authors pointed out that the frequency of 8 kHz was the most affected for the group exposed to both agents (noise and toluene).
Research on workers exposed simultaneously to noise and solvents highlight the synergistic action DISCUSSION
The thresholds of pure tone audiometry were within the normal range in all subjects evaluated in this study, both in the study group and in the control group. These indings corroborate those of previous studies11, we found thresholds of PTA better than 20 dB in subjects exposed to solvents, but with changes in auditory processing. Researches2,12 showed different results from the present study because they were found abnormal audiograms in both the study and the control groups, although a smaller number of changes have been observed in the control group. In a project carried out by CEREST Campinas – SP, 59 gas station attendants have undergone audiological assessment, in which 27% had abnormal results in PTA13.
Although subjects in both groups of this study have shown normal thresholds, we observed An average threshold of the study group superior than the average threshold of the control group at all frequencies. A statistically signiicant difference was observed at frequencies of 0.5 (p = 0.004), 2 (p = 0.001) and 3 kHz (p = 0.025) (Figure 1). In contrast to these indings, two studies14, 15 evaluated subjects exposed to organic solvents through PTA and did not observe any statistically signiicant differences between groups in relation to thresholds. The indings in terms of average thresholds observed in this study partially agree with other indings12 where the average threshold was observed higher in the study group than in the control group, in both ears, with the exception of the frequencies of 0.25 and 6 kHz in the right ear, and the frequency of 0.25 kHz in the left ear. A study16 observed the presence of
Frequencies
(kHz) Responses Control Group N (%) N (%) Study Group p- value
0,5
Absent 0 0,0 2 100,0
0,308
Normal 20 54,1 17 45,9
Exacerbated 4 44,4 5 55,6
1
Absent 1 33,3 2 66,7
0,836
Normal 21 51,2 20 48,8
Exacerbated 2 50,0 2 50,0
2
Absent 2 33,3 4 66,7
0,389
Normal 22 53,7 19 46,3
Exacerbated 0 0,0 1 100,0
4
Absent 5 33,3 10 66,7
0,202
Normal 16 61,5 10 38,5
Exacerbated 3 42,9 4 57,1
kHz: kilohertz, the chi-square test (p <0.05)
groups. The lack of answers was higher in the study group than in the control group in the three frequen-cies examined, however, there was no statistically signiicant difference (Table 1).
Regarding the exposure time, the hearing thresholds differed signiicantly at all frequencies (9, 10, 12.5 and 14 kHz) when compared to control group and subgroup 3 (exposed for more than ive years) (Figure 3).
Changes in hearing thresholds for high frequen-cies found in this study reinforce what has been suggested by other researchers24, highlighting the importance of the presence of high-frequency audio-metry in the battery of tests performed in evaluating occupational hearing.
Even though the hearing thresholds of all subjects were normal, there was no acoustic relex of the middle ear in some individuals. Acoustic relections at high levels or absent in an individual without conductive pathology or facial nerve invol-vement, are considered indicators of the involve-ment of the auditory low nerve/brainstem27.
The absence of the acoustic relex in the ispi -lateral mode in the right ear was prevalent in the study group compared to the control group, the two frequencies tested (1 and 2 kHz) (Table 2). However, this did not occur in the left ear, where the number of subjects with acoustic relex was equal for both groups, the frequency of 1 kHz and the absence predominated in the control group at 2 kHz (Table 4). The occurrence of ipsilateral acoustic relex was not statistically different between the study and control groups, in the right ear.
In the contralateral acoustic relex of the right ear, the absence was prevalent in the study group when compared to the control group, in the frequen-cies of 0.5 and 4 kHz. The number of subjects with exacerbated contralateral acoustic relex was higher in the study group than in the control group at all frequencies (0.5, 1, 2 and 4 kHz), while the frequency of 1kHz individuals of the control group showed acoustic relex exacerbated. The results of the acoustic relex contralateral right ear were not statistically signiicant (Table 3).
On the other hand, on the left, the study group was higher incidence of acoustic relex at all frequen -cies tested (0.5, 1, 2 and 4 kHz), and the frequency of 0.5kHz no no acoustic relex in the control group. Similarly, the acoustic relex exacerbated had higher incidence in the study group, but only at frequen-cies of 0.5, 2 and 4 kHz. The results of contralateral acoustic relex of the left ear were not statistically signiicant (Table 5). It was observed in a previous study28, thresholds of the acoustic relex elevated or absent in individuals exposed to solvents who had normal hearing. According to the author, these of these agents. Thus, the indings of this study did
not show hearing loss in PTA in subjects exposed to chemicals and sound pressure levels within the recommended limit. However, by being exposed to chemicals that inhibit the protective action of the acoustic relex, the inner ear is partially unprotected and hearing loss from noise can happen, even this being within the recommended limits.
The studies mentioned above used the PTA as the primary assessment tool. It is assumed that because the subjects are not only exposed to the solvent, but also to noise, abnormal audio-grams were found in the majority of workers. Such changes predominated in the higher frequencies of the PTA, and the groups exposed to noise and solvent present in most studies, a higher prevalence of change. Thus, it emphasizes the importance of conducting a more extensive hearing evaluation in this population, due to the risk of hearing loss to be greater when there is co-exposure of agents. Another critical issue is that the conventional PTA cannot detect hearing loss that occurs in the range of high frequencies above 8 kHz 24.
There are, however, few studies with high--frequency audiometry in subjects exposed to solvents or solvent exposed and noise, although this test is of great importance in occupational assessment, as it complements the indings of PTA and indicates the occurrence of early changes in the auditory system. Furthermore, authors24 emphasize that the indings in human studies are not necessa -rily correlated with the indings in animals (hearing loss in average frequency).
In the data analysis of high-frequency audio-metry, it was observed higher thresholds in the study group when compared to the control group at all frequencies where responses were present (9, 10, 12.5 and 14 kHz). Statistically signiicant difference in the thresholds between the groups in the frequency range of 9 (p = 0.007) and 10 kHz (p = 0.026) (Figure 2). These are similar to indings from a study25 that, although it has studied subjects exposed to solvents and noise, its authors observed thresholds higher in the group exposed to noise and solvents, when compared to the group exposed only to noise and the control group. The same authors state that the difference in the thresholds was statis-tically signiicant in the high-frequency audiometry, while PTA results showed no signiicant differences. The level of exposure to the solvent can be deci -sive for the occurrence of hearing loss in high frequencies, for exposed workers had slightly better hearing thresholds at high frequencies than workers exposed to high levels of solvents (about 60%) 26.
Auditory condition of gas station attendants
1145
In the left ear, of the subjects of this study, it was observed the same result from the right ear in rela-tion to the acoustic relex and exacerbated acoustic relex (Table 5). Different results were observed by other researchers5 in the left ear, where the highest percentage of ipsilateral absence was at 2 kHz, and the higher occurrence of exacerbated acoustic relections, was observed at a frequency of 1kHz (contralateral).
The indings of this study suggest that even subjects with normal hearing in the absence of PTA and with the lack of conductive component may have retrocochlear changes manifested by the absence of the acoustic relex and exacerbated acoustic relex, indicating involvement of the audi -tory nerve (lower brainstem)27 .
CONCLUSIONS
Gas station attendants exposed to fuels, which have normal hearing showed changes at high frequencies, as well as missing or exacerbated acoustic relexes, indicating, respectively, cochlear and central change. The exposure time was directly proportional to the extent of the damage.
indings suggest the retrocochlear and/or central involvement, caused by exposure to solvents. Another study12 also found a higher percentage of subjects with normal hearing and no acoustic relex (ipsilateral and contralateral) in the group of workers exposed to solvents. The data from this study corro -borate those of CEREST of Campinas/SP13, where only 27% of the evaluated attendants had abnorma-lities in the PTA, and yet, 63% of subjects showed changes in acoustic relexes.
In the present study, there was no predomi-nance of contralateral acoustic relex over the ipsi -lateral in the right ear (Tables 2 and 3). In contrast another research12 observed prevalence of absence of acoustic relex in the ipsilateral mode when compared to contralateral in the right ear in workers exposed to solvents.
In this research, the acoustic relex with the highest rate of absence in the right ear was contra-lateral relex frequency of 4 kHz, in the exacerbated relection the frequency with the highest subjects was 0.5 kHz (Table 3). The same was observed in a previous study5, in relation to the exacer -bated acoustic relex, however, the absence of the acoustic relex prevailed at 2 kHz.
RESUMO
Objetivo: avaliar os limiares auditivos nas frequências convencionais e altas frequências, e ainda a integridade do arco relexo, em frentistas. Método: foram avaliados frentistas de três postos de gaso-lina da cidade de Santa Maria/RS. Após adequação aos critérios de inclusão, a amostra icou com -posta por 24 frentistas expostos a combustíveis, 21 do gênero masculino e três do gênero feminino, com faixa etária entre 20 e 40 anos. Os exames utilizados foram audiometria tonal liminar, audiome -tria de altas frequências e imitanciome-tria. O tempo de exposição variou de um a 17 anos. O grupo controle foi composto por 24 sujeitos não expostos a qualquer agente nocivo à audição. Resultados: a média dos limiares da audiometria tonal liminar e da audiometria de altas frequências foi superior no grupo estudo em todas as frequências testadas. Veriicou-se diferença de limiar estatisticamente signiicante nas frequências de 0,5 (p=0,004), 2 (p=0,001) e 3 kHz (p=0,025), e nas frequências de 9 (p=0,007) e 10 kHz (p=0,026). Os limiares das frequências de 12,5 e 14 kHz não diferiram estatisti-camente (p>0,05). Em 16, 18 e 20 kHz foi observada maior ausência de respostas no grupo estudo (p>0,05). Também se observou maior ausência de relexos acústicos (ipsi e contralateral) no grupo estudo, na orelha direita. Na orelha esquerda, não houve diferença entre os grupos, para a ocorrên-cia do relexo ipsilateral. A ausênocorrên-cia de relexo contralateral foi maior no grupo estudo em todas as frequências testadas. Conclusão: frentistas com limiares auditivos normais podem apresentar alte-rações cocleares e centrais.
Relation to the diagnosis of toxic encephalopathy. Scand Audiol. 1998;27(3):131-6.
15. Fuente A, Mcpherson B, Munoz V, Espina JB. Assessment of central auditory processing in a group of workers exposed to solvents. Acta Otolaryngol. 2006;126(11):88-94.
16. Sliwinska-Kowalska M, Zamyslowska-Szmytke E, Szymczak W, Kotylo P, Fiszer M, Wesolowsky W, et al. Exacerbation of noise-induced hearing loss by co-exposure to workplace chemicals. Environmental Toxicology and Pharmacology. 2005;19(3):547-53. 17. Cardoso PCM, Viana KS, Oliveira JS, Silva IMC. Audição em trabalhadores de manutenção de aeronaves. Revista do Centro de Ensino Superior Uniicado de Brasília. 2004;1(4):215-32.
18. Bernardi APA. Exposição ocupacional a ruído e solventes e alterações auditivas periféricas e centrais. Tese (Doutorado em Saúde Pública): Faculdade de Saúde Pública, Universidade de São Paulo. São Paulo, 2007.
19. Botelho CT, Paz APML, Gonçalves AM, Frota S. Estudo comparativo de exames audiométricos de metalúrgicos expostos a ruído e ruído associado a produtos químicos. Rev. Bras. Otorrinolaringol. 2009;75(1):51-7.
20. Chang S, Chen CJ, Lien CH, Sung FC. Hearing loss in workers exposed to toluene and noise. Environ. Health Perspect. 2006;114(8):1283-6. 21. Kim J, Park H, Ha E, Jung T, Paik N, Yang S. Combined effects of noise and mixed solvents exposure on the hearing function among workers in the aviation industry. Industrial Health. 2005;43:567-73.
22. Fernandes T, Souza MT. Efeitos auditivos em trabalhadores expostos a ruído e produtos químicos. Rev. CEFAC. 2006;8(2):235-9.
23. Sliwinska-Kowalska M, Zamyslowska-Szmytke E, Szymczak W, Kotylo P, Fiszer M, Wesolowsky W, et al. Effects of coexposure to noise and mixture of organic solvents on hearing in dockyard workers. J. Occup. Environ. Med. 2004;46(1):30-8.
24. Hoet P, Lison D. Ototoxicity of toluene and styrene: state of current knowledge. Crit. Rev. Toxicol. 2008;38:127-70.
25. Morioka I, Miyai N, Yamamoto H, Miyashita K. Evaluation of combined effect of organic solvents and noise by the upper limit of hearing. Ind. Health. 2000;38:252-7.
26. Fuente A, Slade MD, Taylor T, Morata TC, Keith RW, Sparer J, Rabinowitz PM. Peripheral and central auditory dysfunction induced by occupational exposure to organic solvents. JOEM. 2009;51(10):1202-11.
REFERENCES
1. Moller C, Odkvist L, Larsby B, Tham R, Ledin T, Bergholtz L. Otoneurological indings in workers exposed to styrene. Scand J Work Environ Health. 1990;16:189-94.
2. Sulkowski WJ, S Kowalska , Matyja W , Guzek W , W Wesolowski , Szymczak W, et al. Effects of occupational exposure to a mixture of solvents on the inner ear: A ield study. Int J Occup Med Environ Health. 2002;15:247-56.
3. Johnson AC, Morata TC. Occupational exposure to chemicals and hearing impairment. The Nordic Expert Group for Criteria Documentation of Health Risks from Chemicals, 2010.
4. Morata TC, Dunn DE, Kretschmer LW, Lemasters GK, Keith RW. Effects of occupational exposure to organic solvents and noise on hearing. Scand. J. Work Environ. Health. 1993;19(4):245-54.
5. Morata TC, Fiorini AC, Fischer FM, Colacioppo S, Wallingford KM, Krieg EF, et al. Toluene-induced hearing loss among rotogravure printing workers. Scand J Work Environ Health. 1997;23:289-98. 6. Cary R, Clarke S, Delie J. Effects of combined exposure to noise and toxic substances: Critical review of literature. Ann Occup Hyg. 1997;41:455-65. 7. Venet T, Rumeau C, Campo P, Rieger, B, Thomas A, Cour C. Neuronal Circuits involved in the middle-ear acoustic relex. Toxicol. Sci. 2011;119(1):146-55.
8. Momensohn-Santos TM, Russo ICP, Brunetto-Borgianni LM. Interpretação dos resultados da avaliação audiológica. In: Mmomensohn-Santos TM, Russo ICP. Prática da audiologia clínica. 6ª Ed. São Paulo: Cortez. 2007; p.291-310.
9. Jerger J. Clinical experience with impedance audiometry. Arch. Otolaryng. Oct. 1970;92:311-24. 10. Jacobsen P, Hein HO, Suadicani P, Parving A, Gyntelberg F. Mixed solvent exposure and hearing impairment, an epidemi- ological study of 3284 men: the Copenhagen male study. J. Occup. Med. 1993;43(4):1804.
11. Fuente A, Mcpherson B. Central auditory processing effects induced by solvent exposure. Int. J. Occup. Med. Environ. Health. 2007;20(3):271-9. 12. Fuente A. Auditory damage associated with solvent exposure: evidence from a cross-sectional study. PhD Thesis, Hong Kong: University of Hong Kong, 2008.
Auditory condition of gas station attendants
1147
28. Gopal KV. Audiological indings in individuals exposed to organic solvents: Case studies. Noise Health. 2008;10(40):74-82.27. Musiek FE, Baran JA, Pinheiro ML. Neuroaudiology: Case Studies. San Diego: Singular, 1994.
Received on: November 22, 2011 Accepted on: March 05, 2012
Mailing Address:
Lenita da Silva Quevedo Rua Venâncio Aires, 1140 Santa Maria – RS – Brasil CEP: 99300-000