ISSN 0104-6632 Printed in Brazil
www.abeq.org.br/bjche
Vol. 25, No. 03, pp. 603 - 611, July - September, 2008
Brazilian Journal
of Chemical
Engineering
REDUCTION EFFICIENCY PREDICTION OF
CENIBRA’S RECOVERY BOILER BY DIRECT
MINIMIZATION OF GIBBS FREE ENERGY
W. L. Silva
1, J. C. T. Ribeiro
1, E. F. da Costa Jr.
2and A. O. S. da Costa
2*1CENIBRA, Celulose Nipo-Brasileira S.A., Belo Oriente - MG, Brazil. 2
Centro de Ciências Agrárias, Universidade Federal do Espírito Santo, CCA/UFES, Alto Universitário s/n, Caixa Postal 16, CEP: 29500-000,
Guararema, Alegre - ES, Brazil.
E-mail: [email protected]
(Received: July 10, 2007 ; Accepted : March 18, 2008)
Abstract - The reduction efficiency is an important variable during the black liquor burning process in the Kraft recovery boiler. This variable value is obtained by slow experimental routines and the delay of this measure disturbs the pulp and paper industry customary control. This paper describes an optimization approach for the reduction efficiency determination in the furnace bottom of the recovery boiler based on the minimization of the Gibbs free energy. The industrial data used in this study were directly obtained from CENIBRA´s data acquisition system. The resulting approach is able to predict the steady state behavior of the chemical composition of the furnace recovery boiler, - especially the reduction efficiency when different operational conditions are used. This result confirms the potential of this approach in the analysis of the daily operation of the recovery boiler.
Keywords: Black liquor recovery boiler; Gibbs free energy; Combustion, Modeling; Optimization.
INTRODUCTION
In the pulp production process the Kraft recovery boiler has basically three functions: to convert the sodium sulfate (Na2SO4) present in the black liquor into sodium sulfide (Na2S); to produce steam through the combustion of the black liquor organic components; and to eliminate undesirable by-products.
The main difference between recovery and classical boilers is the greater importance given, in the recovery boiler, to regenerate the Na2S rather than to steam production during the black liquor combustion. Besides steam production, the recovery boiler should be capable of producing the maximum amount of Na2S, a product of the burning process.
Basically, the recovery boilers can be divided into the following six parts: (1) furnace - where the black
liquor is burned; (2) waterwall - where saturated steam is produced; (3) screen - where saturated and superheated steam are produced; (4) boiler bank - where the water that arrives from the economizer is distributed and saturated steam is separated; (5) superheater - where saturated steam is transformed into superheated steam; (6) economizer - where the feed water is heated.
One of the main difficulties that must be faced to study Kraft recovery boilers is due to the large diversity of physical and chemical transformations – often unknown – that take place during the black liquor burning process.
combustion products are not only carbonic gas and water, but also other chemical species (inorganic salts).
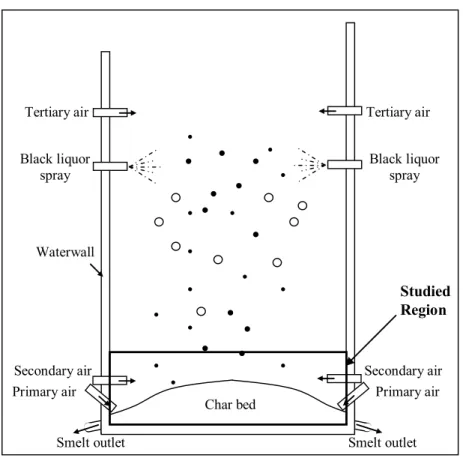
The black liquor burning process begins when this fluid is fed into the recovery boiler furnace through spray nozzles located on the furnace wall (Figure 1). Different physicochemical processes are involved in the black liquor particle burning phenomenon: drying, pyrolysis, char burning, oxidation and reduction of the inorganic salts (Grace, 1992; Smook, 1987).
During the drying process the particles lose their residual humidity (about 30%).
The pyrolysis begins when the black liquor particles reach 473K (Grace, 1992; Sricharoenchaikul et al., 2001). During this process the particle volume increases because of the generation of combustion gases: SO2, CO2, CO, CH4, H2O, and TRS (Total Reduced Sulfur). Due to the oxidation of these gases a visible flame surrounds the particles, which tends to follow the gas flow path. After the pyrolysis, the black liquor particles are composed of inorganic components (mainly Na2CO3, Na2S and Na2SO4) and fixed carbon.
TRS gases are usually taken as H2S for convenience though in practice they usually contain mercaptans (Adams, 1997). Lisa (1997) suggests that the TRS gases are composed of H2S, CH3SH, CH3SCH3 and CH3S2CH3.
When the particles reach the furnace bottom, they get in contact with the char bed and the primary and secondary air fed (Figure 1). The char bed consists of carbon, partially pyrolyzed black liquor solids and melted inorganic salts, called smelt. The oxidation and reduction reactions of the inorganic salts occur in the char bed region. These chemical reactions take place simultaneously in the char bed (Grace, 2001). The exothermic oxidation reaction of Na2S with air oxygen forming Na2SO4, takes place in the solid char bed surface. Because Na2S is an active agent of the wood digestion process in the pulp industry, it is desirable to recover it at the end of the black liquor burning process. The relationship between the recovered sulphur mass as Na2S and the total sulphur mass in the smelt is called reduction efficiency.
Although the inorganic salt oxidation causes a decrease of the reduction efficiency, the energy liberated during the exothermic reaction allows the fusion and the endothermic reduction of the salts, with the Na2SO4 reacting with carbon to form new Na2S. Usually, the smelt is composed of one-third of Na2S and two-thirds of Na2CO3 (Adams, 1997).
Grace and Frederick (1997) suggest that the temperature of the bed surface decreases with
distance into the bed; from 1273 – 1473K on the bed surface to the point where smelt is solidified, at approximately 1033K. The smelt is removed from the furnace bottom and taken to a dissolution stage.
Besides, particulate material- composed of not burned liquor particles and inorganic salts (chemical dust) – is formed during the black liquor burning process and are carried by the combustion gases. These carried substances cause a deposit on the surfaces of the boiler and reduce heat transfer efficiency. Electrostatic precipitators pick up the particulates remaining in the recovery boiler outlet. The formation mechanism of the chemical dust is not completely known (Jokiniemi et al., 1996). Empirical models are usually used in the description of the particulate formation phenomenon (Costa et al., 2004) which it is not considered in this work.
This paper describes an optimization approach for the chemical composition determination in the furnace bottom of the recovery boiler (char bed region - Figure 1) based on the minimization of the Gibbs free energy. The resulting approach is able to predict the steady state behavior of the chemical composition in the furnace recovery boiler - especially the reduction efficiency - when different operational conditions are used.
METHODOLOGY
The black liquor burning process involves unknown chemical reactions in solid, liquid and gas phases. Moreover, the reagents of this combustion vary depending on the digestion process used. In order to overcome this difficulty we have considered an optimization approach that allows the calculation of the chemical composition of the system minimizing the Gibbs free energy. This methodology has been frequently used to describe closed multiphase systems (Faungnawakih et al., 2007; Faungnawakih et al., 2006; Solórzano et al., 2004; Nichita et al. 2002; Lee et al., 1999; Ansari and Pandis, 1999; Soares et al., 1982) and is based on the fact that Gibbs free energy of these systems must be minimum at the equilibrium.
In a closed system with F phases and N different chemical species the Gibbs free energy is calculated by a combination of the chemical potentials of each component in each phase, expressed by equation (1) (Zeggeren and Storey, 1970).
F N i, j i, j j 1 i 1
G n
= =
Where G is the total Gibbs free energy of the closed system, µi,j is the chemical potential of component i in phase j, ni,j is the mole number of component i in phase j, F is the phases number in the closed system, N is the number of chemical components in the closed system. The chemical potential of specie i in phase j is described by equation (2).
i, j
i, j o
i, j f o i, j
f G RT ln
f
µ = +
(2)
where Gof i,j is Gibbs free formation energy of component i in phase j at an average temperature of the closed system (T), R is the gas constant, fi,j is the fugacity of component i in phase j, foi,j is the fugacity of pure component i in phase j at the standard state. For condensed (liquid and solid) ideal phase the partial fugacity is expressed by,
i, j i, j o N i, j k, j k 1 f n f n = =
∑
(3)and for the ideal gas phase by,
i, j i, j o N i, j k, j k 1 f n P f n = =
∑
(4)where P is the pressure of the closed system.
Minimization of equation (1) produces the equilibrium composition of F phases at one condition of pressure and temperature as a function of the mole number of each chemical species in each phase (ni,j). Moreover, the mass relations in the closed system must be satisfied during the solution of the optimization problem. Although the M chemical elements in a close system are distributed between different chemical species, the elementary chemical composition must remain fixed. This behavior described by equation (5) - for each chemical element – restricts the optimization problem.
i, j
N F k k,i
i 1 j 1
b a n k 1, , M
= =
=
∑∑
= " (5)Where bk is the total number of gram-atoms of chemical element k in the closed system, ak,i is the
gram-atoms number of the chemical element k in component i.
Finally, additional restrictions must be considered as the mole number of each species in each phase (ni,j) is positive or equal to zero (equation (6)).
i, j
n ≥0 (6)
The optimization problems are solved for a deterministic optimization method, which is Sequential Quadratic Programming (SQP) (Edgar and Himmelblau, 1988). Random values are used for the initial mole number of the chemical species in each phase, thus satisfying the restrictions described by equations (5) and (6).
The industrial data used in this study were directly obtained from CENIBRA´s data acquisition system and describe the operation of the recovery boiler between September 2004 and March 2005. To analyze each operating condition, some process operation variables must be specified to properly define the constrained equations of the optimization problem. They are:
1) the black liquor elementary chemical composition;
2) the black liquor feed flow rate (Vlu); 3) the black liquor solids concentration (X);
4) the air feed flow rates (the sum of the primary (Var1) and secondary (Var2) air flow rates).
The following assumptions are adopted in order to solve the proposed optimization problem:
1) CENIBRA’s black liquor has the elementary chemical composition presented in Table 1;
2) the system is at chemical equilibrium for a given constant average furnace gas temperature equal to 1273K;
3) the pressure in the furnace is 101.3 kPa; 4) the different phases present ideal behavior; 5) good control of black liquor droplets diameters assure that only dry black liquor particles reach the studied region (Figure 1).;
6) combustion reactions only take place in the studied region (Figure 1).;
7) N2 is inert.
. .
.
.
.
.
.
.
.
.
.
.
.
.
.
.
.
.
.
.
.
.
.
.
.
Char bed
Studied Region
Smelt outlet Smelt outlet
Primary air Secondary air Primary air
Secondary air
Black liquor spray Tertiary air
Black liquor spray Tertiary air
Waterwall
Figure 1: Burning process of black liquor in a typical recovery boiler and identification of the studied region.
Table 1: CENIBRA’s black liquor elementary composition.
Chemical Element Concentration
C 34.4% H 3.7% O 31.6% Na 21.4% S 5.4% K 2% Cl 1.5%
RESULTS AND DISCUSSION
The average operation condition is directly obtained by industrial data set (Table 2).
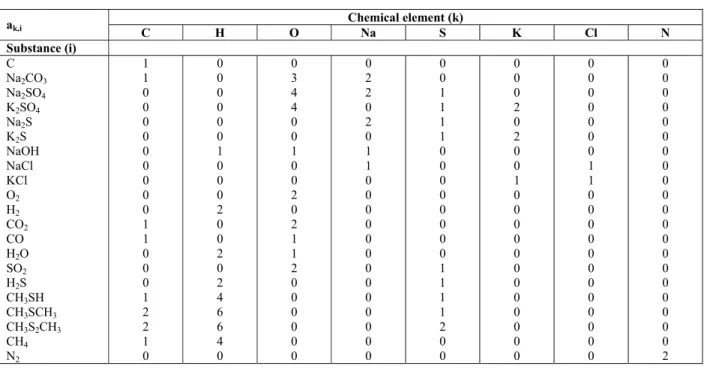
Table 3 presents the chemical species considered to obtain the results and the respective values of ak,i (equation 5).
Using the operation conditions presented in Table 2, the values of bk (equation 5) are calculated and the obtained results are presented in Table 4.
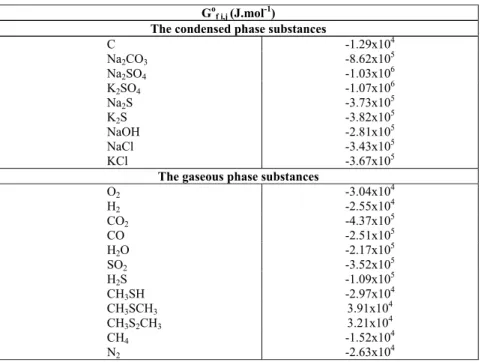
Table 5 presents the Gibbs free formation energy (Gof i,j) at 1273K of each chemical component considered in this study.
since the oxygen concentration is fixed. This behavior is observed in Table 6.
Table 6 shows the chemical composition of the studied region obtained when the real average operating condition is considered (test 5). The average reduction efficiency of the mill is 93.3% (Table 2) and the proposed model can reproduce this variable within an error of 0.6%.
The reduction efficiency value is obtained at CENIBRA by experimental procedures. Therefore, the value of this variable is not known for all industrial data but only for few sampling times. This characteristic of the system disturbs the control of the recovery boiler operation. Sometimes the influence of different operational conditions in the reduction efficiency is known after a long time.
The operational variables are controlled during the recovery boiler operation. Then, small variations can be observed during a significant time of operation. To illustrate this behavior, nine real and different operational conditions that describe eight hours of the recovery boiler operation were analyzed. Table 7 shows the simulated reduction efficiency to
each case. The real values are known only for two conditions (Table 7). The proposed model can reproduce these real values with a maximum error of 1.1%.
The results presented in Table 7 confirm that small changes in the operating conditions do not affect significantly the reduction efficiency. However, the operation of the recovery boiler can be drastically modified, causing important alterations in the chemical composition of the system. Thereby, the challenge is not to describe the standard operating conditions of the equipment, but to describe the recovery boiler behavior during its operation time.
Table 8 shows the results obtained when real different operating conditions are considered for CENIBRA’s recovery boiler. The studied data were chosen randomly. The maximum error obtained is 5.3% (operational conditions 5). The results presented in Table 8 justify the use of this methodology in addition to the usual experimental routines to predict the reduction efficiency of the recovery boiler.
Table 2: CENIBRA’s average operation condition.
Variables Values
Vlu 109.88 m3/h
X 70%
Var1 162.02 t/h
Var2 164.65 t/h
Reduction efficiency 93.3%
Table 3: Atom number of the chemical element k in component i (ak,i) to the studied system.
Chemical element (k)
ak,i C H O Na S K Cl N
Substance (i)
C 1 0 0 0 0 0 0 0
Na2CO3 1 0 3 2 0 0 0 0
Na2SO4 0 0 4 2 1 0 0 0
K2SO4 0 0 4 0 1 2 0 0
Na2S 0 0 0 2 1 0 0 0
K2S 0 0 0 0 1 2 0 0
NaOH 0 1 1 1 0 0 0 0
NaCl 0 0 0 1 0 0 1 0
KCl 0 0 0 0 0 1 1 0
O2 0 0 2 0 0 0 0 0
H2 0 2 0 0 0 0 0 0
CO2 1 0 2 0 0 0 0 0
CO 1 0 1 0 0 0 0 0
H2O 0 2 1 0 0 0 0 0
SO2 0 0 2 0 1 0 0 0
H2S 0 2 0 0 1 0 0 0
CH3SH 1 4 0 0 1 0 0 0
CH3SCH3 2 6 0 0 1 0 0 0
CH3S2CH3 2 6 0 0 2 0 0 0
CH4 1 4 0 0 0 0 0 0
Table 4: Total number of gram-atoms (bk ) of chemical element k in the closed system considering the average operating condition (Table 2).
Chemical Element k bk
C 889.12 H 1298.3 O 1987.6 Na 289 S 52.3 K 15.9 Cl 13.1 N 4897.1
Table 5: Gibbs free formation energy of component i in phase j at T = 1273K.
Gof i,j (J.mol-1)
The condensed phase substances
C -1.29x10⁴
Na2CO3 -8.62x10⁵
Na2SO4 -1.03x10⁶
K2SO4 -1.07x10⁶
Na2S -3.73x10⁵
K2S -3.82x10⁵
NaOH -2.81x10⁵
NaCl -3.43x10⁵
KCl -3.67x10⁵
The gaseous phase substances
O2 -3.04x10⁴
H2 -2.55x10⁴
CO2 -4.37x10⁵
CO -2.51x10⁵
H2O -2.17x10⁵
SO2 -3.52x10⁵
H2S -1.09x10⁵
CH3SH -2.97x10⁴
CH3SCH3 3.91x10⁴
CH3S2CH3 3.21x10⁴
CH4 -1.52x10⁴
N2 -2.63x10⁴
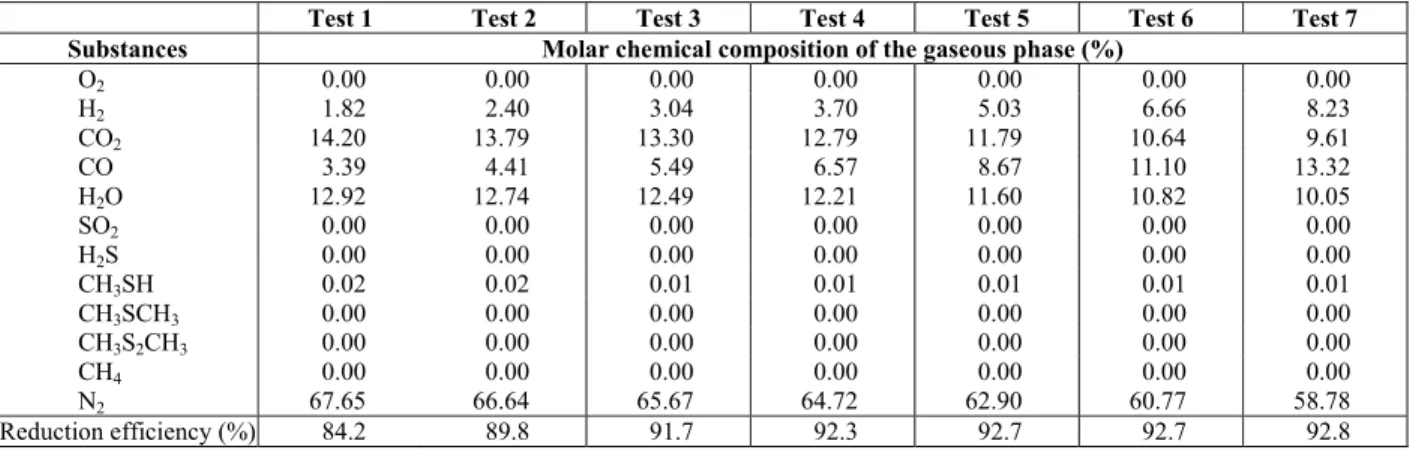
Table 6: Chemical composition at the furnace bottom obtained by minimizing Gibbs free energy considering the average operating condition and different values of Vlu.
Test 1 Test 2 Test 3 Test 4 Test 5 Test 6 Test 7
Vlu (m3/h) 87.90 92.30 95.92 100.28 109.88* 120.87 131.86
X (%) 70 70 70 70 70* 70 70
Var1 (t/h) 162.02 162.02 162.02 162.02 162.02* 162.02 162.02 Var2 (t/h) 164.65 164.65 164.65 164.65 164.65* 164.65 164.65
Substances Molar chemical composition of the condensed phase (%)
C 0.03 0.04 0.06 0.08 0.16 0.27 0.40
Na2CO3 58.09 58.06 58.00 57.94 57.80 57.66 57.51
Na2SO4 2.33 0.78 0.29 0.12 0.03 0.01 0.00
K2SO4 1.81 0.96 0.43 0.20 0.05 0.01 0.00
Na2S 27.12 28.90 29.54 29.78 29.93 29.99 30.01
K2S 0.93 1.56 1.97 2.17 2.29 2.32 2.32
Continuation Table 6
Test 1 Test 2 Test 3 Test 4 Test 5 Test 6 Test 7 Substances Molar chemical composition of the gaseous phase (%)
O2 0.00 0.00 0.00 0.00 0.00 0.00 0.00
H2 1.82 2.40 3.04 3.70 5.03 6.66 8.23
CO2 14.20 13.79 13.30 12.79 11.79 10.64 9.61
CO 3.39 4.41 5.49 6.57 8.67 11.10 13.32 H2O 12.92 12.74 12.49 12.21 11.60 10.82 10.05
SO2 0.00 0.00 0.00 0.00 0.00 0.00 0.00
H2S 0.00 0.00 0.00 0.00 0.00 0.00 0.00
CH3SH 0.02 0.02 0.01 0.01 0.01 0.01 0.01
CH3SCH3 0.00 0.00 0.00 0.00 0.00 0.00 0.00
CH3S2CH3 0.00 0.00 0.00 0.00 0.00 0.00 0.00
CH4 0.00 0.00 0.00 0.00 0.00 0.00 0.00
N2 67.65 66.64 65.67 64.72 62.90 60.77 58.78
Reduction efficiency (%) 84.2 89.8 91.7 92.3 92.7 92.7 92.8 *Average operating condition
Table 7: Predicted reduction efficiency obtained by the minimization of the Gibbs free energy in a serial of operating conditions.
Operating Conditions - Date:10/24/04
1 2 3 4 5 6 7 8 9
6 hr 7 hr 8 hr 9 hr 10 hr 11 hr 12 hr 13 hr 14 hr Vlu (m3/h) 125.0 127.8 128.7 128.4 128.1 126.3 125.0 124.9 124.8
X (%) 68.2 68.4 69.3 70.3 70.4 70.7 71.0 70.5 71.0 Var1 (t/h) 173.5 180.5 181.4 180.3 179.4 180.0 180.7 177.7 179.2 Var2 (t/h) 169.6 178.3 177.1 176.7 175.6 175.8 176.6 176.8 176.6 Reduction efficiency
(simulated) (%) 92.73 92.72 92.73 92.74 92.75 92.74 92.73 92.72 92.73 Reduction efficiency
(real) (%) 93.8 - - - 92.7
Table 8: Predicted reduction efficiency obtained by the minimization of the Gibbs free energy considering real different operating conditions.
Operational Conditions 1 2 3 4 5 6 7 8
09/01/04 09/01/04 10/06/04 11/30/04 01/12/05 01/25/05 02/07/05 02/22/05 Date
06 hr 22 hr 22 hr 14 hr 22 hr 22 hr 06 hr 22 hr Vlu (m3/h) 121.58 124.28 122.53 119.05 120.15 114.9 110.20 99.96 X (%) 70.5 70.0 71.0 70.3 70.0 71.4 70.5 70.0 Var1 (t/h) 173.64 175.83 180.05 170.01 180.50 175.67 176.77 178.64 Var2 (t/h) 174.44 168.32 219.05 177.20 180.50 183.72 169.63 188.86 Reduction efficiency
(simulated) (%) 92.7 92.8 92.2 92.6 89.2 92.6 92.4 87.9 Reduction efficiency
(real) (%) 95.6 93.2 92.2 93.8 84.7 92.8 91.3 89.8 Error (%) 3.0 0.4 0 1.3 5.3 0.2 1.2 2.1
CONCLUSION
The methodology of minimizing the Gibbs free energy has been used satisfactorily in this study to describe the chemical composition of the furnace bottom of the recovery boiler. By this approach it is possible to reproduce the industrial behavior of this equipment, specially the reduction efficiency.
equipment. Therefore, all information reported by the literature has been important to validate the obtained results.
To obtain the chemical composition of the studied region (for each operational condition) a small computational time is requested. This result confirms the potential of this approach in the analysis of the daily operation of the recovery boiler, since the reduction efficiency value is usually obtained through slow experimental routines.
ACKNOWLEDGEMENTS
The authors thank CNPq – Conselho Nacional de Desenvolvimento Científico e Tecnológico (grant no. 471285/2004-8 – Edital Universal 019/2004) – for the financial support provided for this work.
NOMENCLATURE
ak,i Gram-atoms number of the chemical element k in component i
(-)
bk Total number of gram-atoms of chemical element k in the closed system
(-)
fi,j fugacity of component i in phase j
(-)
foi,j fugacity of pure component i in phase j at the standard state
(-)
F phases number in the closed system
(-)
G Total Gibbs free energy of the closed system
J.mol-1 Gof i,j Gibbs free formation energy
of component i in phase j at T
J.mol-1
M number of chemical elements in the closed system
(-)
ni,j mole number of component i in phase j
mol
N number of chemical components in the closed system
(-)
P pressure of the closed system
atm
R gas constant 8.314
J.K-1 .mol-1 T average temperature of the
closed system
K
Var1 primary air feeds t.hr-1 Var2 secondary air feeds t.hr-1 Vlu black liquor feed m3.h-1 X black liquor solids
concentration
%
Greek Letters
µi,j chemical potential of component i in phase j
J.mol-1
REFERENCES
Adams, T. N., General Characteristics of Kraft Black Liquor Recovery Boilers in: Kraft Recovery Boilers, Adams, T. N. (Eds). TAPPI Press, Atlanta (1987).
Ansari, A. S. and Pandis, J. A., Prediction of multicomponent inorganic atmospheric aerosol behavior, Atmospheric Environment 33, 745-757 (1999).
Costa, A. O .S., Biscaia Jr., E. C. and Lima, E. L., Chemical Composition Determination at the Bottom Region of a Recovery Boiler Furnace by Direct Minimization of Gibbs Free Energy. The Canadian Journal of Chemical Engineering 83, 477-484 (2005).
Costa, A. O. S., Biscaia Jr., E. C. and Lima, E. L., Mathematical Description of the Kraft Recovery Boiler Furnace. Computers and Chemical Engineering 28, 633-641 (2004).
Costa, A. O. S., Biscaia Jr., E. C. and Lima, E. L, Mathematical Description of the Kraft Recovery Boiler Furnace, Proceedings of the European Symposium on Computer Aided Process Engineering – ESCAPE 13. Lappenranta, Finland, 1007-1012 (2003).
Edgar, T. F. and Himmelblau, D. M., Optimization of Chemical Process. McGraw-Hill, New York (1988).
Faungnawakij, K., Kikuchi, R., Eguchi, K., Thermodynamic analysis of carbon formation boundary and reforming performance for steam reforming of dimethyl ether. Journal of Power Sources 164, 73-79 (2007)
Faungnawakij, K., Kikuchi, R., Eguchi, K., Thermodynamic evaluation of methanol steam reforming for hydrogen production. Journal of Power Sources 161, 87-94 (2006)
Grace, T. M. and Frederick, W. J., Char Bed Processes in: Kraft Recovery Boilers, Adams, T. N., (Eds.). TAPPI Press, Atlanta (1997).
Grace, T. M., Chemical Recovery Process Chemistry, in: Chemical Recovery in the Alkaline Pulping Processes, Green, R. P., Hough, G. (Eds.). TAPPI Press, Atlanta (1992),
Jokiniemi, J. K., Pyykönen, J. Mikkanen, P. and Kauppinen, E. I., Modeling fume formation and deposition in kraft recovery boilers. TAPPI Journal No.79, 7, 171-181 (1996).
Lee, Y. P., Rangaiah, G. P. and Luss, R., Phase and chemical equilibrium calculation by direct search optimisation. Computer & Chemical Engineering 23, 1183-1191, (1999).
Lisa, K., Recovery Boiler Air Emissions in: Kraft Recovery Boilers, T. N. Adams (Eds.). TAPPI Press, Atlanta (1997).
Nichita, D. V., Gomez, S., Luna, E., Multiphase equilibria calculation by direct minimization of
Gibbs free energy with a global Optimisation method. Computers & Chemical Engineering 26, 1703-1724 (2002).
Smook, G. A., Handbook for Pulp & Paper Technologists, TAPPI Press, Canada (1987). Soares, M. E., Medina, A. G., McDermott, C. and
Ashton, N., Three phase flash calculations using free energy minimisation. Chemical Engineering Science 37 (4), 521-528 (1982).
Solórzano, B. G., Brennecke, J. F., Stadtherr, M. A, Validated computing approach for high-pressure chemical and multiphase equilibrium. Fluid Phase Equilibria 219, 245-255 (2004).
Sricharoenchaikul, V., Hicks, A. L. and Frederick, W. J., Carbon and char residue yields from rapid pyrolysis of kraft black liquor. Bioresource Technology 77, 131-138 (2001).