297
TIME TO EXHAUSTION AT THE ONSET OF BLOOD
LACTATE ACCUMULATION IN RUNNERS WITH
DIFFERENT ATHLETIC ABILITY
ORIGINAL ARTICLE EXERCISE AND SPORTS SCIENCES
Jordan Santos-Concejero1,2
Cristina Granados2
Jon Irazusta2
Iraia Bidaurrazaga-Letona2
Jon Zabala-Lili2
Susana Gil2
1. University of Cape Town, UCT/ MRC ESSM, South Africa 2. University of the Basque Country UPV/EHU, Spain.
Mailing address:
UCT/MRC Research Unit for Exercise Science and Sports Medicine, University of Cape Town. 3º Floor Sports Science. Institute of South Africa, Boundary Road 7700 (Newlands) Cape Town, South Africa.
ABSTRACT
Objective: To characterize the physiological responses of runners of different athletic ability at the
velocity at onset of blood lactate (VOBLA) and to determine if 4 mmol·L-1 represents the same relative
exercise intensity for every runner. Methods: Eleven trained and twelve well-trained runners completed
two running tests on a treadmill: first, a maximal incremental lactate test to calculate the VOBLA (Test 1),
and then another one at the corresponding VOBLA until exhaustion (Test 2). Gas exchange and heart rate
(HR) were continuously measured and plotted as a percentage of time to exhaustion in Test 2 (TET2). The
individual lactate threshold velocity (VLT) and lactate concentration ([La-1]LT) were calculated according to
the D-max method. Results: VOBLA and VLT were higher in well-trained runners (P<0.001). [La-1]LT was <4
mmol·L-1 in the well-trained runners (P<0.001), but not in trained runners. Well-trained runners were faster
at VOBLA than at VLT (P<0.001). Well-trained runners ran a shorter TET2 than the trained runners (P<0.05).
Moreover, well-trained runners presented a higher respiratory rate at 50, 80 and 90% of TET2 and VO2 at
20-100% of TET2 (P<0.05). TET2 was inversely correlated (P<0.01) with VOBLA and positively with personal
best 10-kmperformance (P<0.01). VOBLA was positively correlated with the %VO2max in Test 2 (P<0.01).
The standard value (4 mmol·L-1) for the concentration of blood lactate appears to represent a different
exercise intensity for runners of different athletic ability. Conclusion: VOBLA may not be accurated for
programming running training sessions or for performing an evaluation of aerobic capacity.
Keywords:Athletes, OBLA, fatigue, exercise intensity, performance.
INTRODUCTION
The determination of blood lactate concentration ([La-])
du-ring exercise has been traditionally used as an important factor
for the estimation of workload intensity in training exercise1. The
maximal exercise intensity which elicits a constant [La-] over time,
more specifically a rise lower than 1 mmol·L-1 in the last 20 minutes
of a constant work rate test of 30 minutes, has been defined as the
maximal lactate steady-state (MLSS)2. MLSS represents the highest
intensity of exercise at which a balance exists between the rate of
lactate production and lactate clearance3,4.
The MLSS has been proposed as a useful tool for the evaluation of aerobic capacity, training intensity prescription and the
predic-tion of exercise performance1. However, the technique required
for the accurate determination of the MLSS is complex and time--consuming, as 3 to 5 constant work-rate tests have to be performed
on different days5. As a result, several authors have recommended
the use of single day tests for the indirect determination of MLSS3,6.
During running exercise, a lactate concentration of 4 mmol·L-1
was reported to be associated with the MLSS7 and consequently,
different researchers have proposed the use of the 4 mmol·L-1 value
as a reference value for the MLSS8,9. This value of 4 mmol·L-1, first
proposed by Mader et al in 197610, was later termed as the onset of
blood lactate accumulation (OBLA)11. Some studies have reported
that the exercise intensity which induces an optimum qualitative
sti-mulus should elicit a steady-state [La-] of approximately 4 mmol·L-112,
and therefore OBLA exercise intensity has been adopted by coaches all over the world as a useful index of training status and fitness3).
However, several researchers are against the utilization of OBLA
as an indirect marker for the MLSS13,14, because [La-] corresponding
to MLSS may be reduced as a result of aerobic training15. In addition,
it is acknowledged that the 4 mmol·L-1 value does not take into
account inter-individual variability in the MLSS16. Thus, use of the
OBLA as universal index for accurately estimating aerobic capacity, prescribing training intensity or a predicting performance, may have important limitations.
Currently, it is unclear if relative exercise intensity corresponding to OBLA is similar in athletes of different levels or training status. Thus, the main purpose of this study was to investigate the physio-logical responses at OBLA exercise intensity and consequently, to
ascertain if the 4 mmol·L-1 value for lactate concentration represents
the same relative exercise intensity in runners of different athletic ability. These results will assist us in determining if the OBLA index could be used to design and program running training sessions independently of the runner’s athletic level.
METHODS
Subjects
Twenty-three long distance Caucasian male runners participa-ted in this study: eleven trained (39.9 ± 5.8 years) and twelve well--trained (28.4 ± 6.8 years). Before participation, subjects were medi-cally examined to ensure that they had no signs of cardiovascular, musculoskeletal and metabolic diseases. The Ethics Committee for research on Human subjects at the University of Basque Country (CEISH/GIEB) approved this study. All athletes were informed about
298
all the tests and the possible risks involved and signed a written informed consent prior to testing. For the purpose of this study, athletes were selected according to their recent 10-km personal best time. Inclusion criteria for the trained runners group included a minimum of three days per week of running sessions, current parti-cipation in competitions and a 10-km race time between 35-45 mi-nutes. Inclusion criteria in the well-trained athletes group included current participation in international or national level competitions and a 10-km race time below 33.5 minutes.
Procedures
Anthropometry -Height (cm) and body mass (kg) were
mea-sured with the use of a precision stadiometer and balance (Seca, Bonn, Germany), and body mass index (BMI) was calculated. Eight skinfold sites (biceps, triceps, subscapular, supraspinale, abdominal, suprailiac, mid-thigh, and medial calf ) were determined in duplicate with a skinfold caliper (Holtain, Crymych, UK) by the same researcher and the sum of skinfolds was determined. The body fat percentage
was calculated for each athlete, as described elsewhere17.
All subjects performed two maximal running tests: a peak
trea-dmill lactate test (Test 1) and a constant treatrea-dmill VOBLA test (Test 2)
with a break of one week between them. 24 hours prior to testing, athletes were encouraged to be well rested and to abstain from a hard training session and competition. All athletes were familiarized with running on the treadmill.
Peak treadmill lactate test (Test 1) - All subjects completed a maximal effort incremental running test on a treadmill with a 1%
gradient (ERGelek EG2, Vitoria-Gasteiz, Spain), starting at 9 km·h-1
without previous warm up. The velocity was increased by 1.5 km·h-1
every 4 minutes until volitional exhaustion, with 1 minute of reco-very between each stage. Verbal encouragement was provided to ensure that a maximal effort was reached. During the test,
respi-ratory rate (RR), ventilatory output (VE), oxygen uptake (VO2) and
respiratory exchange ratio (RER) were continuously measured using the same calibrated gas analyzer system (Ergocard, Medisoft, Sorin-nes, Belgium), which was calibrated before each session according to the instructions of the manufacturers.
Athletes were considered to have attained their maximal ability,
and therefore, reached their VO2max, when three of the following
criteria were fulfilled: 1) a plateau in VO2;2) RER > 1.15; 3) HR
wi-thin 5 beats·min-1 of theoretical maximal HR (220-age); 4) lactate
concentration > 8 mmol·L-1; 5) RPE= 10.
Peak treadmill velocity in km·h-1 (PTV) was calculated as follows
taking every second into account18:
PTV= Completed full intensity in km·h-1 + [(seconds at final
ve-locity · 240 seg-1)·1.5 km·h-1]
Immediately after each exercise stage, a 25 μl sample of capil-lary blood was drawn from the earlobe and analyzed in order to determine the blood lactate concentration (Lactate Pro, Arkray, KDK Corporation, Kyoto, Japan). This system has been validated as an
effective analyzer for lactate measurements19. The individual lactate
threshold (LT) was calculated by the D-max method20. The reliability
of this method has previously been reported21. A third order
poly-nomial regression equation was established on the plasma lactate concentrations versus workloads. The D-max was identified as the point on the polynomial regression curve that yielded the maximal
distance to the straight line formed by the two end data points21.
Constant treadmill VOBLA test (Test 2) - This test involved running
on a treadmill at the individual’s velocity corresponding to a lactate
concentration of 4 mmol·L-1 (V
OBLA) until volitional exhaustion with
a 1% gradient. VOBLA was calculated by interpolation, expressing the
collected blood lactate data of each subject in Test 1 as a function of running velocity. A quadratic equation was used to perform the
regression of the [La-] and velocity. During the test, HR and gas
exchange were continuously measured and plotted as 10-100%
of time to exhaustion (TET2) as suggested by Pires et al.22. Lactate
concentration was sampled immediately ([La-]
finalT2) and 3 minutes
([La-]
3minT2) after the test.
Statistics
All values are expressed as mean ± standard deviation (SD) and the statistical analyses of data were performed using the Statistical Package for the Social Sciences 15.0 software package (StatSoft, USA). Data were screened for normality of distribution and ho-mogeneity of variances using a Shapiro-Wilk normality test and a Levene test respectively. An independent Student t-test for the comparison of the means of both groups was utilized. In cases in which variables were not normal, a Mann-Whitney U-test was utilized. Relationships between variables were evaluated by using linear regressions and Pearson and Spearman correlation analyses. Significance for all analyses was set at P<0.05.
RESULTS
Anthropometric characteristics and maximal treadmill test re-sults in trained and well-trained runners are listed in Table 1. Well--trained runners were younger and faster according to their best 10-km time than trained runners (P<0.001). There were no differences in height between the two groups. However, well-trained runners were lighter, and presented lower values of BMI, sum of skinfolds and %BF than trained runners (P<0.01-0.05). Well-trained runners achieved a higher PTV during Test 1 (table 1, P<0.001). Nevertheless, there were no significant differences in any maximum physiological
parameter, such as VO2 (absolute and relative to body mass), HR,
RER or [La-] between both groups.
VOBLA and the velocity at the lactate threshold (VLT) were faster
in the well-trained runners when compared to the trained run-ners (P<0.001) (table 2). Further, the blood lactate concentration
at the lactate threshold ([La-]
LT) was lower in the well-trained
run-ners (P<0.001). VOBLA was faster than VLT in the well-trained
run-ners (P<0.001), but not in the trained runrun-ners. Similarly, [La-]
LT was
<4mmol·L-1 in the well-trained runners (P<0.001), but not in the
trained runners.
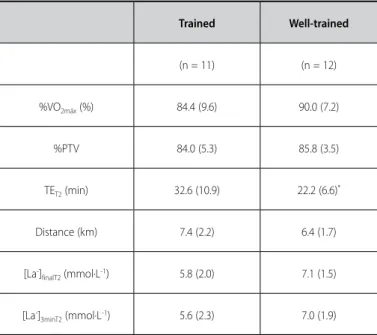
TET2 was 46.8% shorter (P<0.05) in the well-trained runners than
in the trained runners (table 3). However, there were no significant
differences in %VO2max, %PTV, [La-]
finalT2, [La-]3minT2 between both
groups (although the values were higher in well-trained runners), neither in distance covered in Test 2.
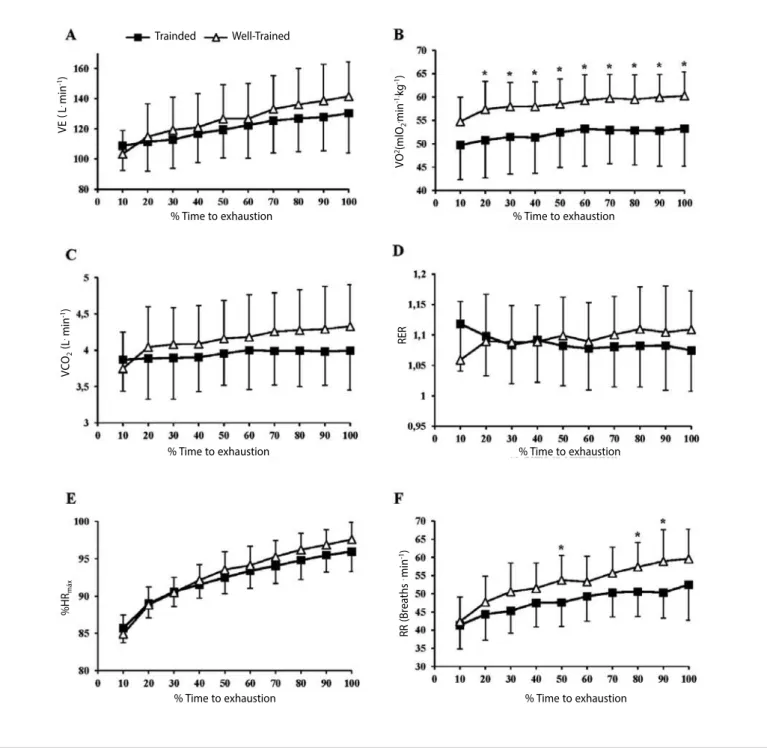
During Test 2, well-trained runners showed a statistically higher
VO2 (ml·kg-1·min-1) at 20 to 100% of the TET2, and a higher respiratory
rate (RR) at 50, 80 and 90% of the TET2 than trained runners (P<0.05,
299
Table 1. Anthropometric characteristics and indicators of performance and exertion
in the maximal treadmill test (Test 1) results for trained and well-trained runners.
Trained Well-trained
(n = 11) (n = 12) Age (years) 39.9 (5.8) 28.4 (6.8)***
10-km time (min) 39.1 (3.0) 31.8 (1.2)***
Height (cm) 176.4 (7.1) 177.2 (5.1) Mass (kg) 70.3 (7.1) 64.9 (4.0)*
BMI 22.6 (1.8) 20.7 (1.5)*
∑ 8 skinfold (mm) 72.3 (23.2) 46.6 (12.6)**
%BF 12.2 (2.5) 9.5 (0.9)**
PTV (km·h-1) 16.5 (1.5) 20.6 (1.1)***
VO2max (L·min-1) 4.2 (0.4) 4.1 (0.4)
VO2max (mL·kg-1·min-1) 59.4 (7.2) 63.2 (4.3)
HRmax (beats·min-1) 180.6 (11.2) 186.7 (5.8)
RERmax 1.19 (0.08) 1.20 (0.06)
[La-]final T1 (mmol·L-1) 9.0 (1.7) 8.5 (1.7)
[La-]3minT1 (mmol·L-1) 9.5 (1.3) 9.6 (1.8)
n, number of subjects; BMI, Body Mass Index, ∑ 8 skinfold, (biceps, triceps, subscapular, supraspinale, abdominal, suprailiac, mid-thigh, and medial calf ); %BF, percentage of body fat; PTV, peak treadmill velocity; VO2max, maximum
oxygen uptake rate; HRmax, maximum heart rate; RERmax, maximum respiratory exchange ratio; [La-]finalT1, final lactate
concentration in Test 1; [La-]
3minT1, lactate concentration 3 minutes after Test 1. Values are means (SD). Statistically
significant differences with respect to trained runners are indicated as *P<0.05; **P<0.01; ***P<0.001.
Table 2. VOBLA, VLT and [La-]LT in trained and well-trained runners.
Trained (n=11) Well-trained (n=12)
Subjects VOBLA VLT [La-]LT Subjects VOBLA VLT [La-]LT
T1 13.9 14.0 4.1 WT1 17.0 16.1 2.7
T2 10.8 12.5 6.4 WT2 17.7 17.0 2.5
T3 10.5 12.4 5.5 WT3 19.1 18.1 2.9
T4 14.7 14.3 3.4 WT4 19.0 18.5 3.1
T5 14.6 13.7 3.0 WT5 17.8 17.7 3.5
T6 15.9 15.0 2.7 WT6 18.9 18.2 3.0
T7 13.0 13.5 4.4 WT7 18.1 17.8 3.1
T8 13.5 13.4 3.9 WT8 16.3 16.0 3.7
T9 15.0 14.5 3.4 WT9 17.5 17.0 3.4
T10 15.4 16.0 4.4 WT10 19.8 19.5 3.4
T11 16.1 16.0 3.9 WT11 16.2 16.0 3.7
WT12 15.0 15.0 4.0
Mean (SD)
13.9 (1.9)
14.1 (1.2)
4.1 (1.1)
17.7 (1.4)***
17.2 (1.3)***†††
3.3 (0.4)*‡ n, number of subjects; VOBLA, velocity corresponding to the Onset of Blood lactate accumulation (km•h-1); V LT, velocity corresponding to the lactate threshold (km•h-1), [La-]LT, lactate concentration at lactate threshold (mmol•L-1).
Statistically significant differences with respect to trained runners are indicated as *P<0.05; ***P<0.001. Statistically significant differences with respect to VOBLA are indicated as †††P<0.001. Statistically significant differences with respect to 4 mmol•L-1 lactate concentration are indicated as ‡P<0.05.
Table 3. VOBLA velocity test (Test 2) results in trained and well-trained runners.
Trained Well-trained
(n = 11) (n = 12)
%VO2máx (%) 84.4 (9.6) 90.0 (7.2)
%PTV 84.0 (5.3) 85.8 (3.5)
TET2 (min) 32.6 (10.9) 22.2 (6.6)*
Distance (km) 7.4 (2.2) 6.4 (1.7)
[La-]
finalT2 (mmol·L-1) 5.8 (2.0) 7.1 (1.5)
[La-]
3minT2 (mmol·L-1) 5.6 (2.3) 7.0 (1.9) n, number of subjects; VOBLA, velocity corresponding at the Onset of Blood lactate accumulation; %VO2max,
percen-tage of the maximum oxygen uptake, %PTV, percenpercen-tage of the peak treadmill velocity; TET2, time to exhaustion
at the end of Test 2; [La-]
finalT2, blood lactate concentration at the end of the Test 2; [La-]3minT2, blood lactate
concentration 3 minutes after Test 2. Values are means (SD). Statistically significant differences with respect to trained runners are indicated as *P<0.05.
production (VCO2), percentage of maximum heart rate (%HRmax) or
RER during the VOBLA. The overall trend was a physiological steady
state in the last half of the Test 2.
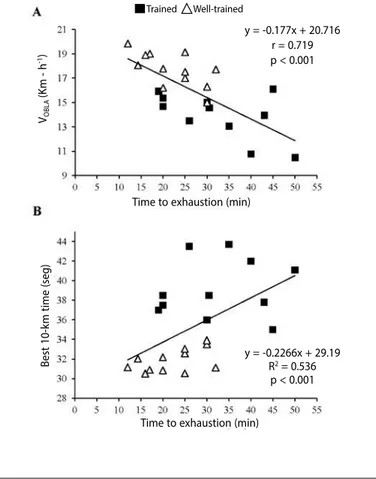
The individual values of the TET2 correlated negatively with the
individual VOBLA values (r=0.719, P<0.001, n=23) (figure 2A), as well as
positively with the individual best 10-km race time values (r=0.536,
P<0.01, n=23) (figure 2B). Further, VOBLA correlated positively with
%VO2max in Test 2 (r=0.604, P<0.001, n=23) (figure 3).
DISCUSSION
This is the first study to compare the physiological responses
(measured as a function of % time to exhaustion) at VOBLA, in order to
ascertain if a 4 mmol·L-1 lactate concentrationrepresents the same
relative exercise intensity for runners of different athletic ability. Time to exhaustion is considered a good indicator of the
rela-tive exercise intensity22. An important finding of this study is that
the time to exhaustion at the velocity corresponding to 4 mmol·L-1
lactate concentration (TET2) was shorter in well-trained runners
compared to trained runners. This result, together with the
nega-tive correlation between TET2 and the VOBLA, and the positive
300
athletic level of the runners is a determinant factor for the exercise duration at the velocity corresponding to a lactate concentration
of 4 mmol·L-1. This idea is corroborated by the finding that VO
2
(ml·kg-1·min-1) and respiratory rate (RR) values during the V
OBLA test
were higher for well-trained runners at certain points. Respiratory
responses are related to the exercise intensity23, so these results
sug-gest that, although at a consistent VOBLA, the intensity of workload
was greater in the well-trained runners.
The key to understanding why the higher level athletes
expe-rienced a shorter TET2 during Test 2 may be explained by
differen-ces in the VLT and [La-]LT between the trained and the well-trained
runners. VOBLA was close to the VLT in trained runners, whereas VLT
was faster in the well-trained runners. Similarly, the [La-]
LT was not
different to OBLA in trained runners and was lower than OBLA in
the well-trained runners. These results indicate that VOBLA does not
represent the same relative exercise intensity in runners of different athletic ability and that the time to exhaustion at a running velocity
corresponding to a lactate concentration of 4 mmol·L-1 appears to
be influenced by the athletic conditioning of the runners. This statement is further supported by the positive correlation
between %VO2max in Test 2 and VOBLA. These results suggest that
athletes of a higher athletic level (athletes with a higher VOBLA) ran
at a higher %VO2max during Test 2. This finding may imply that the
athletic level of the runners is a factor that influences the relative
Figure 1. Physiological parameter responses in trained and well-trained runners during the VOBLA test according to time to exhaustion. VE, volume ventilation (A); VO2, oxygen
uptake (B); VCO2, carbon dioxide production (C); RER, respiratory exchange ratio (D); %HRmax, percentage of maximum heart rate (E); RR, respiratory rate (F). Statistically significant
differences with respect to trained runners are indicated as *P<0.05.
Trainded
% Time to exhaustion % Time to exhaustion
% Time to exhaustion
% Time to exhaustion
% Time to exhaustion
% Time to exhaustion
RR (Br
ea
ths
. min -1)
RER
%HR
máx
V
CO
2
(L
. min -1)
V
E (
L
. min -1)
VO
2(mlO
2
.min -1.kg -1)
301
intensity corresponding to 4 mmol·L-1 lactate concentration.
Al-though, the athletes were exercising at a speed set to maintain 4
mmol·L-1 blood lactate concentration, %VO
2max differed between
athletes. Thus, suggesting the athletes exercised at different relative intensities during Test 2.
Currently, it is known that during prolonged exercise at inten-sities eliciting the MLSS, glycolytic muscle fibers are producing and
releasing lactate24 into the blood for oxidation by distant tissues as
well as conversion to glucose and glycogen, while some lactate may
diffuse to adjacent oxidative muscle fibers to be oxidized25. Lactate
exchange is a dynamic process with simultaneous muscle uptake
and release at rest and during exercise26. Consequently, lactate
va-lues measured in blood are not necessarily indicative of the levels of lactate produced in active muscles. In fact, well-trained runners
are likely to have an enhanced lactate clearance capacity27. Thus,
the 4 mmol·L-1 blood lactate concentration may be associated with
higher relative exercise intensity in this group of athletes.
During exercise performed at VOBLA volitional exhaustion occurred
whilst there was evidence for physiological reserve capacity. Thus,
exercise termination at VOBLA may be induced by an integrative
ho-moeostatic control of the central and peripheral physiological system. This is to specifically ensure the maintenance of homeostasis and not a result of the failure of the body to perform work, as proposed by
the Central Governor Model28.
In summary, the present study suggests that VOBLA does not
re-present the same relative exercise intensity in runners of different competitive level, possibly due to differences in lactate kinetics. Our
results demonstrate that the time to exhaustion, which is a good
indicator of the relative exercise intensity, is closely related to the
level of the athletes when running at VOBLA. Thus, we conclude that
this index should not be recommended for programming training sessions, performing an aerobic capacity evaluation or comparing runners of different athletic ability and conditioning.
ACKNOWLEDGEMENTS
This study has been partially supported by the Department of Physical Education and Sport, of the Faculty of Physical Activity and Sport, University of the Basque Country (UPV/EHU). J.S.C. is supported by a predoctoral fellowship from the Basque Govern-ment (ref. BFI08.51).
All authors have declared there is not any potential conflict of interests concerning this article.
REFERENCES
1. Billat VL, Sirvent P, Py G, Koralsztein JP, Mercier J. The concept of maximal lactate steady state: a bridge between biochemistry, physiology and sport science. Sports Med. 2003;33:407-26.
2. Beneke R. Maximal lactate steady state concentration (MLSS): experimental and modelling approaches. Eur J Appl Physiol 2003;88:361-9.
3. Chicharro JL, Carvajal A, Pardo J, Pérez M, Lucía A. Physiological parameters determined at OBLA vs. a fixed heart rate of 175 beats x min-1 in an incremental test performed by amateur and professional cyclists. Jpn J Physiol 1999;49:63-9.
4. MaderA, Heck, H. A theory of the metabolic origin of “anaerobic threshold”. Int J Sports Med 1986;7:45-65.
5. Beneke R. Anaerobic threshold, individual anaerobic threshold, and maximal lactate steady state in rowing. Med Sci Sports Exerc 1995;27:863-7.
6. Figueira TR, Caputo F, Pelarigo JG, Denadai BS. Influence of exercise mode and maximal lactate--steady-state concentration on the validity of OBLA to predict maximal lactatelactate--steady-state in active individuals. J Sci Med Sport 2008;11:280-6.
Figure 2. Significant relationships between time to exhaustion in Test 2 and the
velo-city corresponding to onset of blood lactate accumulation (VOBLA) (A) and running performance according to the best 10-km time (B) in trained and well-trained runners.
Trained Well-trained
Time to exhaustion (min)
Time to exhaustion (min)
y = -0.177x + 20.716 r = 0.719 p < 0.001
y = -0.2266x + 29.19
R2 = 0.536
p < 0.001
B
est 10-k
m time (seg)
VOBLA
(K
m - h
-1)
Figure 3. Significant relationship between the velocity corresponding to the onset of
blood lactate accumulation (VOBLA) and the percentage of maximum oxygen uptake
in Test 2 in trained and well-trained runners.
Well-trained runners Trained runners
VOBLA (Km-h-1)
% VO
2max
302
7. Heck H, Mader A, Hess G, Mücke S, Müller R, Hollmann W. Justification of the 4-mmol/l lactate threshold. Int J Sports Med 1985;6:117-30.
8. Denadai BS, Figueira TR, Favaro OR, Gonçalves M. Effect of the aerobic capacity on the validity of the anaerobic threshold for determination of the maximal lactate steady state in cycling. Braz J Med Biol Res 2004;37:1551-6.
9. Denadai BS, Gomide EB, Greco CC. The relationship between onset of blood lactate accumulation, critical velocity, and maximal lactate steady state in soccer players. J Strength Cond Res 2005;19:364-8. 10. Mader A, Liesen H, Heck H, Phillippi H, Schürch PM, Hollmann W. Zur Beurteilung der
sportartspezi-fischen Ausdauerleistungsfähigkeit. Sportarzt Sportmed 1976;27:80-8.
11. Sjödin B, Jacobs I. Onset of blood lactate accumulation and marathon running performance. Int J Sports Med 1981;2:23-6.
12. Hollmann W, Rost R, Liesen H, Dufaux B, Heck H, Mader A. Assessment of different forms of physical activity with respect to preventive and rehabilitative cardiology. Int J Sports Med 1981;2:67-80. 13. Kilding AE, Jones AM. Validity of a single-visit protocol to estimate the maximum lactate steady state.
Med Sci Sports Exerc 2005;37:1734-40.
14. Van Schuylenbergh R, Eynde BV, Hespel P. Prediction of sprint triathlon performance from laboratory tests. Eur J Appl Physiol 2004;91:94-9.
15. Keul J, Simon G, Berg A, Dickhuth H, Goertler I, Kubel R. Determination of individual anaerobic threshold for performance test and exercise prescription (Bestimmung der individuellen anaeroben Schwelle zur Leistungsbewertung und Trainingsgestaltung). Deutsche Zeit Sportmed 1979;30:212-8.
16. Stegmann H, Kindermann W. Comparison of prolonged exercise tests at the individual anaerobic threshold and the fixed anaerobic threshold of 4 mmol.L-1 lactate. Int J Sports Med 1982;3:105-10.
17. Yuhasz MS. Physical fitness Manual. London: University of Western Ontario, 1974.
18. Kohn TA, Essén-Gustavsson B, Myburgh KH. Do skeletal muscle phenotypic characteristics of Xhosa and Caucasian endurance runners differ when matched for training and racing distances? J Appl Physiol 2007;103:932-40.
19. Tanner RK, Fuller KL, Ross ML. Evaluation of three portable blood analysers: Lactate Pro, Lactate Scout and Lactate Plus. Eur J Appl Physiol 2010;109:551-9.
20. Cheng B, Kuipers H, Snyder AC, Keizer HA, Jeukendrup A, Hesselink M. A new approach for the deter-mination of ventilatory andlactate thresholds. Int J Sports Med 1992;13:518-22.
21. Zhou S, Weston SB. Reliability of using the D-max method to define physiological responses to incremental exercise testing. Physiol Meas 1997;18:145-54.
22. Pires FO, Noakes TD, Lima-Silva AE, Bertuzzi R, Ugrinowitsch C, Lira FS, et al. Cardiopulmonary, blood metabolite and rating of perceived exertion responses to constant exercises performed at different intensities until exhaustion. Br J Sports Med 2011;45:1119-25.
23. Hills AP, Byrne NM, Ramage AJ. Submaximal markers of exercise intensity. J Sports Sci 1998;16:71-6. 24. Gladden LB. Lactate metabolism: a new paradigm for the third millennium. J Physiol 20004;558:5-30. 25. Brooks GA. Intra and extra-cellular lactate shuttles. Med Sci Sports Exerc 2000;32:790-9. 26. Van Hall G, Jensen-Urstad M, Rosdahl H, Holmberg HC, Saltin B, Calbet JA. Leg and arm lactate and
substrate kinetics during exercise. Am J Physiol Endocrinol Metab 2003;284:193-205.
27. Donovan CM, Pagliassotti MJ. Endurance training enhances lactate clearance during hyperlactatemia. Am J Physiol 1989;257:E782-9.