Bull Pan Am Hdh Or..an 17(2), 1983.
SELECTED
HEALTH
CONDITIONS
IN THE AMERICASl:
A GUIDE
FOR HEALTH
RESEARCH
POLICY
S. Paul Ehrlich,
Jr.2
This presentation’s aim is to provide general data on demography, l$e expec- tancy, and certain spec$c health problems that are relevant to health research and planning. In this manner it seeks to point up noteworthy features of the current health situation in the Amekas and to suggest some possible points of intervention that could prove important in establishing health research priori- ties.
Introduction
It is fitting that a conference on health re- search policies1 should begin with an overview
of the health situation in this hemisphere-
because we must know what is the situation
now, what are the directions of change, and
what are the possible points of intervention before we attempt to define the appropriate
priority areas for a health research policy.
The Pan American Health Organization
views health planning and research within the
following contextual framework: in 1980, the
XXVII Meeting of PAHO’s Directing Coun-
cil adopted a set of Regional Strategies (I) for
attaining the goal of “health for all by the year
2000” and recommended several actions to its
Member Governments that would be conso-
nant with these strategies. The Council also
recommended that a Plan of Action (2) be
developed to implement the strategies; this
was done, and the resulting plan was formally
adopted by the XXVIII Meeting of the Di-
recting Council in 1981.
‘Revised version of a paper presented at the Pan American Conference on Health Research Policies held at Caracas, Venezuela, on 25-28 April 1982 and pub- lished in Spanish in the B&in de la Oficino Sanitaria Panamericana 94(4):348-361. 1983.
2Deputy Director, Pan American Health Organiza- tion.
As stated in the resolution approving the
Plan of Action, the Council resolved “to em-
phasize that the Organization should concen-
trate its efforts and resources on the objectives
and priorities contained in the Plan of
Action. ” Thus, in discussing the conclusions
and implications that can be derived from the
available data on health conditions in the
Americas, it seems appropriate to refer often
to the Plan of Action, not only because the
plan is central to PAHO’s activities, but also
because it is considered a guide to govern-
ments that indicates how they may frame any
actions taken in light of identified priority
problems.
This presentation cannot hope to describe
in detail the health status of the individual
countries involved. Instead it will discuss
some aggregate data significant to health plan-
ning and health research, beginning with data
on the demographic conditions that constitute
a backdrop against which health conditions
must be viewed. It will then discuss life expec-
tancy in the Americas as an indication of
health status, and will present some selected
morbidity and mortality data that shed light
on health conditions and certain major health
problems of our Region.
Demographic Data (3, 4)
The Region of the Americas had an esti-
mated population of 615 million inhabitants in
112 PAHO BULLETIN . vol. 17, no. 2, 1983
1980, and it has been predicted that this figure will rise to 898 million by the year 2000. The
approximate distribution of these actual and
projected populations are shown in Table 1.
The data presented suggest the amount of
health services that will be needed and the kind of research that will be required to devise systems for the effective and efficient delivery of those services.
Partly because increasing population con-
tinues to pose problems, especially in develop-
ing countries, a considerable amount of re-
search and training in human reproduction
and fertility control is being done through one
of the World Health Organization’s special
programs. The PAHO Plan ofAction presents
no specific population control program, but it
does suggest that the family planning compo-
nent of maternal and child health programs
should be integrated into primary care
systems.
In this vein, while we continue to be con-
cerned about population growth, we should
take note of the view that increasing popula-
tion is not intrinsically undesirable, and that
population growth has no long-run negative
effect upon the standard of living or, by exten-
Table 1. The population of the Americas in 1980 and the population projected for the year 2000.
Area Population in millions % 1980 2000 Increase Latin America
Andean arcaa Southern con& Brazil
Central Americac Mexico
Latin American Caribbeand
English-speaking Caribbean and smaller island6 North Amricaf
Total (all areas)
362 599 65.5
73 121 65.8
44 57 29.5
127 213 67.7
23 40 73.9
70 132 88.6
25 36 44.0
7 9 28.6
246 290 17.9
615 898 46.0
&WCC: Pan American Health Organization (1).
aAndean area = Bolivia, Colombia, Ecuador, Peru, and Vene- zuela.
bSouthem cone = Argentina, Chile, Paraguay, and Uruguay. CCentral America= Costa Rica, El Salvador, Guatemala, Hon- duras, Nicaragua, and Panama.
dLatin American Caribbean = Cuba, the Dominican Republic, Haiti, and Puerto Rico.
eEnglish-speaking Caribbean and smaller islands = Antigua, the Bahamas, Barbados, Belize, the Cayman Islands, Dominica, French Guiana, Grenada, the Grenadines, Guadeloupe, Guyana, Jamaica, Martinique, Montserrat, the Netherlands Antilles, N&s, St. Kitts, Saint Lucia, St. Vincent, Suriname, Trinidad and Tobago, the Turks and Caicos Islands, and the Virgin Is- lands.
fNonh America = Canada and the United States.
Table 2. Percentages of the population residing in urban areas in 1970 and 1980, and the percentages projected for 1990 and 2000, by area.
Area=
1970
% of total population in:
1980 1990 2000
Latin America Andean area Southern cone Brazil
Central America Mexico
Latin American Caribbean English-speaking Caribbean
and smaller islandr North America
Total (all areas)
57.6 64.5 70.9 72.6
57.4 64.8 71.0 73.8
75.4 79.6 83.0 85.9
55.8 64.1 71.7 78.3
38.2 44.0 52.6 55.8
58.9 66.4 73.1 79.0
46.3 52.0 57.3 62.0
38.7 44.9 51.1 57.2
74.2 78.8 82.9 86.4
64.8 70.0 75.0 76.9
Ehslich l SELECTED HEALTH CONDITIONS IN THE AMERICAS 113
sion, upon health status (5). Our prime con- cern, as implied in our Strategies and Plan of
Action, is the short and medium term avail-
ability of services capable of providing for
these increasing numbers.
The other demographic trend with an im-
portant impact upon our health conditions is
increasing urbanization (Table 2). It is true
that populations within the traditional limits
of certain Latin American cities may now be
stable or declining; but it is also true that the
urbanization process is spreading to other
centers and is extending beyond the tradi-
tional limits of older cities (6). The resulting
net increase, produced by natural growth of
the established urban population combined
with migration from rural areas, will require
that health systems deal with predominantly
urban populations and urban problems.
It should also be noted that some of the mi-
gration to urban centers is occurring because
rural dwellers feel the cities can afford them
better access to things contributing to an im-
proved standard of living-including health
services. The Plan of Action for implementing
the Regional Strategies points out that health
for all will be sought by making health care ac-
cessible. Within this context, health organiza-
tions like PAHO and national health services
should see the process of urbanization as a fac-
tor working toward improved accessibility.
The challenge is to transform this expectation
of improved health service accessibility into a
reality.
Life Expectancy and Health
Health, in terms of the definition accepted
by WHO, is very difficult to measure. How-
ever, in order to evaluate the effectiveness of
interventions and to make comparisons be-
tween health in different times and places,
some objective indicator of health status and
health conditions is required.
Among the best indicators of health status is
life expectancy at birth and at certain defined
ages. Life expectancy at birth, which gives a
projection based essentially upon the poten-
tially damaging situations that a newborn may encounter over time, is also a very good indi-
cator of social development. Indeed, highly
significant correlations can be drawn between
life expectancy at birth and per capita income
(7); and empirical models have been con-
structed to determine the effect of material
and human resources on life expectancy (8).
Recently, a proxy indicator of living stan-
dards-known as the “physical quality of life
index” (PQLI) consolidated three indicators:
infant mortality, life expectancy at one year of
age, and literacy (9)-thereby incorporating
two health-based indicators involving life ex-
pectancy into an index of the quality of life.
The available data and projections current-
ly being made show that life expectancy in the
Region of the Americas is increasing (Table
3). Specifically, it appears that as of the last
half of the 197Os, average life expectancy at
birth within the Region as a whole was 67.0
years, with subregional averages ranging from
59.3 years in Central America to 71.7 years in
North America. It also appears that the gap
between life expectancy in Latin America and
in North America is closing, and that by the
year 2000 life expectancy in the Region as a
whole will exceed 70 years.
On the other hand, the currently available
data also indicate that the gap is closing more slowly than had been expected (‘la), and that
as life expectancy increases in Latin America,
the rate of increase relative to the rate of in-
crease in developed countries has tended to
decline. The overall figures also conceal sig- nificant differences in the average figures for
different countries and for different groups
within the various countries. In some cases
these differences may have socioeconomic
origins, while in others uneven population
coverage by various services, together with in-
equitable resource allocation and utilization,
may be responsible. One study has shown that
the probability of dying before two years of
age in one country of the Region was five
times greater in one socioeconomic class than
114 PAHO BULLETIN . vol. 17, no. 2, 1983
Table 3. Life expectancy at birth in the latter half of each decade since 1965, with projections to the year 2000, by area.
Area=
Life expectancy at birth (in years) during: 19651970 1975-1980 1985.1990 1995-2000 Latin America
Andean area
Southern cone Brazil
Central America Mexico
Latin American Caribbean English-speaking Caribbean
and smaller islands North America
Total (all areas)
60.0 57.0 65.5
59.7 53.9 61.0 61.7
66.7 70.6
64.9
63.6 67.3 70.4
61.4 66.0 70.2
67.9 69.3 70.6
63.6 67.7 71.1
59.3 63.8 68.2
65.5 68.3 70.3
64.2 66.8 69.5
69.9 72.0 73.2
71.7 72.2 72.5
67.0 69.2 71.1
Source: Pan American Health Organization (1). aSee Table 1, footnotes a-f.
At the same time, some developing coun-
tries have seen life expectancy increase much
faster than GNP. This implies that selected in-
terventions (some health-related) can directly
affect life expectancy in those countries of our
Region where average life expectancy is still
relatively low.
The Plan of Action recognizes that a prime goal for the Region is to raise the average life
expectancy at birth in each country to at least
70 years; and it recognizes that a fundamental
reason for seeking “health for all by the year
2000” is to reduce inequalities between coun-
tries and human groups. It seems reasonable,
therefore, that the first of the regional objec-
tives set forth in the plan is to improve the
equity, efficiency, and effectiveness of health
service systems by reorganizing and expand-
ing those systems. That is, the plan proposes a
restructuring of the health sector and develop-
ment of its service systems, first by increasing the sector’s operating capacity and then by ex-
tending its installed capacity. If these actions
are carried forward in the manner the plan
describes, it is to be expected that they will
make a major contribution to increasing life
expectancy.
The Elderly
One implication of such increased life ex-
pectancy, all other things being equal, would
be a relative increase in the elderly portion of
the population. In this regard, the percentage
of the regional population over 64 years of age
was 6.9 in 1980. It is not expected that this
percentage will increase greatly by the year
2000 (see Table 4), because the projected rate
of population growth affecting younger age
groups is relatively high. Nor is any drastic
change expected in the elderly “dependency” ratio (the ratio of those over 64 to those be- tween the ages of 15 and 64, as shown in
Table 5). Nevertheless, because of an antici-
pated decline in the child “dependency”
ratio, because the actual number of elderly
people is expected to increase substantially,
and because plans and programs for dealing
with that increase are generally lacking, the
Plan of Action has singled out the elderly as a
“special group.” Accordingly, that document
stresses the need to study and assess the mag-
nitudes of older people’s health problems, to
involve epidemiologists and social scientists in
Ehdich l SELECTED HEALTH CONDITIONS IN THE AMERICAS 115
Table 4. Age distributions of the population of the Americas in 1970 and 1980, and projected age distributions for 1990 and 2000, by area.
Area=
% in each of the following age groups:
< 15 years 15-44 years 45-64 years h 65 years
Latin America
1970 1980
1990 2000 English-speaking Caribbean
and smaller islands
1970
1980 1990 2000
North America
1970 1980 1990 2000
Total (all areas)
1970 1980 1990 2000
42.6 41.7 11.9 3.8
40.9 43.2 11.9 4.0
39.6 44.4 11.8 4.2
37.3 45.4 12.7 4.6
44.9 37.2 13.0 4.9
38.7 43.2 12.7 5.4
33.4 48.7 12.1 5.8
29.3 51.1 13.5 6.1
28.4 41.7 20.3 9.6
22.5 46.8 19.7 11.0
22.6 46.4 19.0 12.0
21.7 43.4 22.8 12.1
36.6 41.6 15.7 6.1
33.5 44.6 15.0 6.9
33.4 45.1 14.4 7.1
32.2 44.8 16.0 7.0
Source: Pan American Health Organization (1). aSee Table 1, footnotes a-f.
Table 5. The ratios of children and elderly people to members of the working-age
population in 1980, and projections for the year 2000, by area.
Areaa Child dependency rati& Elderly dependency rati&
1980 2000 1980 2000
Latin America 74: 100 64:lOO 7:lOO 8:lOO
English-speaking Caribbean
and smaller islands 69: 100 45: 100 1O:lOO 10: 100
North America 34:lOO 33: 100 16:lOO 18:lOO
Source: Pan American Health Organization (1). aSee Table 1, footnotes a-f.
bThe number of children below age 15 per 100 persons between the ages of 15 and 64.
CThe number of people age 65 or over per 100 people between the ages of 15 and 64.
comprehensive approaches to providing the
elderly with appropriate health care.
Mortality Data
Mortality data probably represent the
oldest form of health statistics, and despite
various inherent shortcomings they remain an
excellent tool for assessing health conditions.
Among a host of other pu poses, the main
purposes that such data serve today are those
of “d escriptive epidemiology, retrospective
studies, and the testing of hypotheses regard-
ing causation in prospective studies” (12).
Within the context of this presentation, mor-
tality data will be used for the first purpose-
as an epidemiologic tool to indicate the nature
and relative importance of certain specific
disease problems, and to point out critical re-
116 PAHO BULLETIN l vol. 17, no. 2, 1983
Among the leading causes of death in the
Americas are cardiovascular diseases, respira-
tory infections, enteritis and oiher diarrheal
diseases, and traffic accidents. In reviewing
the situation regarding each of these prob-
lems, it would seem appropriate to begin with
respiratory infections and diarrheal diseases,
which predominantly affect children.
Respiratory Infections and Diarrhea1 Diseases
General mortality among children under
five years old, as well as mortality from acute
respiratory infections and diarrhea1 diseases in
this age group, is shown in Table 6. These
data do not show the variations between coun-
tries, but they do demonstrate striking differ-
ences between the three distinct geographic
areas involved. All three areas (Latin Ameri-
ca, the English-speaking Caribbean and
smaller islands, and North America) experi-
enced noteworthy reductions in childhood
mortality (including mortality from the dis-
eases cited), but the rates in Latin America re- mained higher than in the other areas.
By and large, the risks of young children
dying from respiratory infections or diarrheal
diseases were far greater in Latin America and
the Caribbean than they were in North Amer-
ica. For example, in 1978 one of every 10,000
children under five died of respiratory infec-
tions in North America, while some six of
every 10,000 and 31 of every 10,000 died from that cause in the cited areas of the English-
speaking Caribbean and Latin America,
respectively (Table 6). The data also show
that about one of every 20,000 children under five died of diarrhea1 diseases in North Ameri- ca in 1978, while 18 out of 20,000 did so in the
included areas of the English-speaking Carib-
bean and 56 out of 20,000 did so in the cited areas of Latin America.
Regarding the relative importance of respi-
ratory and diarrhea1 disease mortality in this
age group, mortality from diarrheal diseases
was roughly comparable with that from respi-
ratory infections in the cited areas of both
Latin America and the English-speaking
Caribbean in 1968 and 1978. In North Ameri-
ca, however, mortality from respiratory infec-
tions was considerably greater than that from
diarrhea1 diseases, especially in 1968. It also appears that North America and the
included portions of the English-speaking Ca-
ribbean made major strides against respira-
tory infections during the decade in question; for as Table 7 shows, young child mortality from that cause fell by 83 and 71 per cent, res-
pectively, in those areas. Progress was also
made against respiratory infections in the
cited areas of Latin America, where young
child mortality from that cause fell by 46 per
cent; and similar progress was made against diarrheal diseases in all three areas, where de-
clines in young child mortality from diarrheal
diseases ranged from 31 per cent in North
America to 57 per cent in the included por-
tions of the English-speaking Caribbean. By
and large, however, neither diarrheal disease
mortality in the three areas nor mortality from
respiratory infections in Latin America de-
clined much faster than general young child
mortality in those areas during this period.
In weighing these figures, it seems remark-
able that diarrheal disease mortality has not
fallen faster than mortality from all causes.
Perhaps it is too early to see the impact of the
introduction of oral rehydration therapy upon
deaths from diarrhea, but I would predict that over the next 10 years we will see this situation change. Should it fail to do so, that will reflect lack of coverage rather than lack of an appro- priate form of therapy.
The figures presented also point up the im-
portance of making a determined attack on
acute respiratory infections, especially in the
countries of Latin America. We do not have a
form of therapy for respiratory infections as
effective as oral rehydration is for diarrhea,
but the data shown here indicate an urgent
need to develop such a therapy.
Walsh and Warren (13) have proposed a
system of targeting particular diseases for con-
Ehrlich l SELECTED HEALTH CONDITIONS IN THE AMERICAS 117
Table 6. Approximate mortality among children under five years old in 1968 and 1978 from all causes,
acute respiratory infections, and diarrhea1 diseases, showing the percentage of mortality
from all causes accounted for by respiratory and diarrhea1 diseases, by area.
Area=
Deaths Per 1,000 children from: % of mortality from all causes due to’ All causes Acute respiratory infection& DiarrheaI Acute respiratory Diarrheal
disease& infection& dwzasesC 1968 1978 1968 1978 1968 1978 1968 1978 1968 1978 Lafin Am&x
Andean aread Southern conee Brazil
Central Americaf Mexico Latin American
Caribbeang
En&h-speaking Caribbean and ma&~ is/am& North America
20.8 13.1 5.7 3.1 4.2 2.8 27.3 23.5 20.3 21.2
21.0 12.4 5.8 3.1 3.7 2.7 27.6 25.2 17.6 22.0
16.4 10.8 4.1 1.4 2.3 1.2 25.0 12.5 14.3 10.9 -
28.0 17.6 5.4 3.1 5.7 3.9 19.4 17.8 20.3 22.3
23.0 15.0 7.5 4.2 5.8 3.6 32.7 28.3 25.1 24.1
11.9 5.8 1.4 .7 2.1 .7 12.2 11.2 17.5 11.6
11.1 5.6 2.1 .6 2.1 .9 19.0 11.3 16.1 14.3
4.9 3.4 .6 .I .070 ,048 11.8 4.2 1.4 1.4
aSee Table 1, footnotes a-f.
bThis category includes codes A-017, 078, 089-091, and 093 in the World Health Organization’s Manual of the Inter- national Statistical Clas$ication of Direases, Zn+ries, and Causes of Death (eighth revision), referred to hereafter as ICDA-8.
cThis category includes codes 008-009 in ICDA-8. dNo data from Bolivia.
eNo respiratory infection data from Paraguay.
fNo data from Nicaragua; no diarrheal disease data from Guatemala or Honduras. gNo data from Haiti; no diarrheal disease data from Cuba.
hNo data from the Bahamas, the Cayman Islands, French Guiana, Grenada, the Grenadines, Guadeloupe, Guyana, Jamaica, Montserrat, the Netherlands Antilles, Nevis, St. Kitts, St. Vincent, Suriname, Trinidad and Tobago, or the Turks and Caicos Islands. Areas providing data: Antigua, Barbados, Belize (no data on respiratory in- fections), Dominica, Martinique (no data on diarrhea), Saint Lucia (no data on diarrhea), the Virgin Islands (U.S.), and the Virgin Islands (U.K.-no data on diarrhea).
Table 7. Approximate declines in mortality among children under five from all causes, acute respiratory infections, and diarrheal diseases
in 1968-1978, by area.
Percentage declines in mortality, 1968-1978, from: All causes Acute respiratory DiarrheaI
infection& diseas& Latin Arm&a
Andean aread Southern conee Brazil
Central Americaf Mexico Latin American
Caribbeang
English-speaking Caribbean and smaller is/an&h North America
37.0 45.6 33.3
41.0 46.6 27.0
34.1 65.9 47.8
37.1 42.6 31.6
34.8 44.0 37.9
51.3 50.0 66.7
49.5 71.4 57.1
30.6 83.3 31.4
aSee Table 1, footnotes a-f. bSee Table 6, footnote b. cSee Table 6, footnote c. dSee Table 6. footnote d.
118 PAHO BULLETIN l vol. 17, no. 2, 1983
or severity of disability, risk of mortality, and
susceptibility to control. They have placed
such diseases as malaria, diarrheas, measles,
whooping cough, schistosomiasis, and
neonatal tetanus in a “prime” group of dis-
eases that should receive “highest priority for
health care planning.” Respiratory diseases
were assigned a lower rank order by the
authors because of the difficulties confronting
their prevention and management; never-
theless, despite the possible importance of
such difficulties in terms of immediate con-
trol, in terms of need for research the criteria
cited above clearly place respiratory diseases
very high on any list of priority problems.
As a general rule, deaths among children
tend to reflect the extent ofprimary care cover-
age and prevailing conditions. It is obvious,
therefore, that mortality from acute respirato-
ry disease reflects more than just the respirato- ry disease burden. From cohort and longitudi- nal studies it is known that the average child in
North America and Latin America experi-
ences approximately 6-10 respiratory infec-
tions per year (14, 1.5). The difference is that in North America these infections cause mild
illness, while in Latin America, as in other
developing regions, they are more likely to
cause pneumonia and death (16).
The Plan of Action recognizes that the
methods for controlling both acute respiratory
infections and diarrheal diseases must be inte-
grated into primary health care services. In
the case of diarrheal diseases, it specifically
sets out as one area of action the development
of programming approaches that will ensure
the integration of all diarrheal disease control
program strategies (i.e., oral rehydration,
nutrition, health education, food hygiene, and
water and environmental sanitation) into na-
tional programs within the context of primary
health care. Research programs directed at
these diseases, especially respiratory diseases,
must develop technologies for therapy that are
appropriate and that act as entry points into
the primary care system-providing care for
the child as a whole and not restricting the in-
tervention to disease-specific techniques.
Traffic Accidents
Data on mortality from motor vehicle traffic
accidents in the Americas in 1968 and 1978
are shown in Table 8. Such mortality in-
Table 8. Approximate mortality from motor vehicle accidents
in 1968 and 1978, showing the percentages of all deaths
attributed to motor vehicle accident fatalities, by area.
Area=
Deaths from motor vehicle accident& per
% of mortality from all causes due to motor 100,000 population in: vehicle accident& in:
1968 1978 1968 1978
Latin America Andean area Southern cone Brazil
Central America Mexico
Latin American Caribbean English-speaking Caribbean
and smaller islands North America
12.6 16.6 1.1 2.4
13.6 17.8 1.6 3.1
18.1 13.2 1.9 1.6
10.6 16.5 1.3 1.6
7.6 18.3 .8 2.5
11.6 11.2 1.7 2.2
8.3 9.6 1.1 1.5
27.5 23.4 2.9 2.7
%See Table 1, footnotes a-f.
Ehrlich l SELECTED HEALTH CONDITIONS IN THE AMERICAS 119
creased in most countries of Latin America
during that period, producing an. overall in-
crease in the reporting areas of 31.7 per cent.
Conversely, in North America the rate fell
slightly over the ten-year period, so that the share of deaths due to motor vehicle accidents
in the reporting areas of Latin America (2.4
per cent) in 1978 appeared to be approaching
that seen in North America (2.7 per cent).
However, the age-specific death rates (not
shown in the table) reveal a sharp mortality
peak for those in their twenties in North
America, a peak that is not so marked else-
where in the hemisphere.
Of course, these figures deal only with
deaths and do not provide a complete picture
of traffic accident epidemiology. Unfortunate-
ly, recent data on traffic accident epidemio-
logy are hard to obtain. However, one study
has indicated that the number of licensed
vehicles increased some 50 per cent between 1969 and 1975 in 18 of the 25 countries of the
Americas for which data were available (17).
With respect to the number of accidents over this six-year period, only two of these coun- tries showed small decreases, while at least three had increases of over 150 per cent.
The Plan of Action regards intersectoral
cooperation as being essential for attainment
of health goals. Nowhere is this more neces-
sary than in programs seeking to reduce mor-
bidity and mortality from traffic accidents; for
clearly, such morbidity and mortality will not
fall substantially without cooperation and in-
tervention by sectors that deal with policies on
such issues as alcohol, licensing, and road traf- fic laws.
Cardiovascular Diseases
As Table 9 indicates, mortality from cardio-
vascular diseases rose in relation to other
causes of mortality in the cited areas of Latin
America and the English-speaking Caribbean
during the period 1968-1978. In North Amer-
ica, where mortality from this cause dropped
by some 15 per cent, the reverse was true.
This decline in cardiovascular disease mortali-
ty in North America is one of the recent suc-
cess stories of preventive medicine.
It has been claimed that this latter decline
has resulted from changes in life-styles and
related risk factors brought about by a massive health education program conducted over the
Table 9. Approximate cardiovascular disease mortality in 1968 and 1978,
showing the percentages of alI deaths attributed to cardiovascular diseases, by area.
Deaths from cardiovascular disease&’ per
% of mortality from all causes due to cardiovascular 100,000 population in: disease&’ in:
1968 1978 1968 1978
Latin America
Andean area Southern cone Brazil
Central America Mexico
Latin American Caribbean
Englihspeaking Caribbean and smaller islands North America
57.9 53.3 6.4 7.8
38.4 40.1 4.6 7.1
132.8 120.1 14.0 14.4
23.1 25.5 2.8 4.4
24.3 24.6 2.5 3.4
60.1 66.0 8.6 12.9
63.3 80.1 8.2 12.8
341.0 289.2 36.1 33.9
aSee Table 1, footnotes a-f.
120 PAHO BULLETIN l vol. 17, no. 2, 1983
Malaria
-a
past 20 years (18). However, it is possible that
the decline in cardiovascular disease mortality
began before the public health education pro-
gram started. It is therefore essential to
develop, as fast as possible, research that
could determine the cause of this reduced
mortality-so that effective techniques, appro-
priately modified, may be applied in Latin
America and the Caribbean for the purpose of
aborting those areas’ progressive upward
trends in death from cardiovascular disease.
In cases such as this, where the specific etiology is obscure, and where the results of
intervention must be measured over a long
period (19), definitive research requires large
population groups and long, carefully con-
trolled studies. Such research is usually
beyond the capacity of all but a few countries
in the Americas today. However, the feasibili-
ty of performing such research is enormously
enhanced if collaborative intercountry projects
are undertaken, and if a process of informa-
tion exchange through technical cooperation
among developing countries is established.
Meanwhile, the Plan of Action urges
governments to continue analyzing relevant
cardiovascular disease incidence and preva-
lence data, and to attempt identification of
etiopathogenic factors that could be used as a
basis for applying control measures. It will
also be necessary for the kinds of control mea- sures advocated to date to be adapted, so as to
permit their effective integration into the ac-
tivities of the general health services involved.
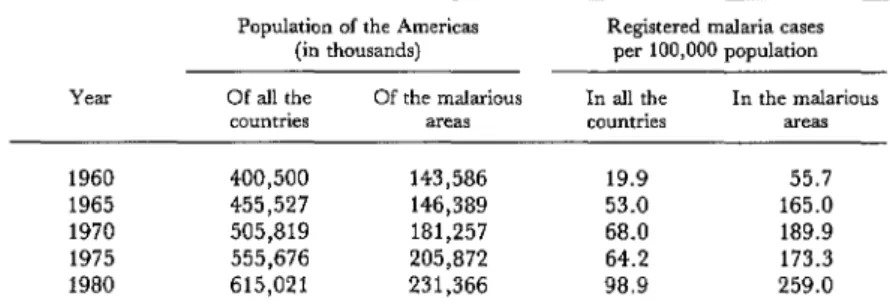
guayan farmlands (21) has helped to demon-
status of the malaria program in the Region
(20). That report indicated that the number of registered malaria cases was increasing steadi-
ly and had experienced a 68 per cent increase
between 1975 and 1980. More specifically, the
reported overall morbidity per 100,000 inhab-
itants in the Region reached a peak in 1967, registered a slow decline over the period 1968 1974, and then began a steady rise in 1975
that continued through 1980 (Figure 1). Un-
fortunately, the malarious areas of the
Americas, where morbidity naturally tends to
be higher, are areas where noteworthy
population growth is occurring (Table 10).
In order to provide a more detailed geo-
graphic breakdown of the different morbidity
patterns involved, the countries of the Region
have traditionally been divided into four
groups as indicated in Table 11. Those in
Group I are the countries where local trans-
mission was not demonstrated and most cases
were classified as imported. At the other ex-
treme, those countries in Group IV experi-
enced high malaria endemicity, and the attack
measures employed proved insufficient or in-
effective. As may be seen, the Group I coun- tries reported a 425 per cent increase in regis-
tered malaria cases over the four-year period
covered, while the Group IV countries re-
ported a 145 per cent increase. It should be noted, moreover, that these increases occurred
despite a pattern of rising expenditures against
malaria, especially during 1978-1980 (Fig-
ure 2).
Besides examining mortality data relating
to various disease categories, it would seem
appropriate to focus upon a single disease af-
fecting health conditions in the Americas.
Malaria has been chosen, partly because the
chances for its control or eradication appear to
be diminishing, despite great efforts, while the
number of cases reported in the Americas is
increasing. In 1981 a report presented to
PAHO’s Directinp Council described the
If the morbidity data shown in Table 11 are
combined with the various national population
figures, it appears that the morbidity caused
by registered cases in the Group I countries
was 0.03 cases per 1,000 inhabitants in 1980,
as compared to 8.7 cases per 1,000 inhabitants
in the Group IV countries. It is clear, how-
ever, that these data deal only with reported
cases and do not describe the unreported mor-
bidity or economic loss caused by malaria.
Regarding economic loss in particular, a
Ehrlich 9 SELECTED HEALTH CONDITIONS IN THE AMERICAS 121
Figure 1. Malaria morbidity per 100,000 inhabitants in the Americas, 1958-1980.
YEAR
Figure 2. Public funds invested to combat malaria in the Americas, 1957-1980 (20).
120 -
110 -
:: loo -
T
i SO-
W- ui
5 70-
*o . . . ..-a . . . .._... INTERNATIONAL
10 - .--.-*/ .‘b’N .w_*_.-.---* /-.-.-.. CONTRIBUTIONS
,/* *-.- --.-.- ._._. - *#.-.a
011 ’ ’ ’ ’ ’ ’ ’ ’ ’ ’ ’ ’ ’ ’ L ’ ’ ’ -- ’ I
67 66 59 60 6, 6.2 63 64 65 66 67 66 69 70 71 72 73 74 75 76 77 76 79 60
122 PAHO BULLETIN l 001. 17, no. 2, 1983
Table 10. Registered malaria morbidity in the Americas, 1960-1980.
Population of the Americas Registered malaria cases (in thousands) per 100,000 population Of all the Of the malarious In all the In the malarious
countries areas countries areas
1960 400,500 143,586 19.9 55.7
1965 455,527 146,389 53.0 165.0
1970 505,819 181,257 68.0 189.9
1975 555,676 205,872 64.2 173.3
1980 615,021 231,366 98.9 259.0
Source: Pan American Health Organization; Status of Malaria in the Americas, XXIX Report (20).
Table 11. Malaria cases registered in 1977-1980 by four groups of countries and territories.
1980 Population of originally Malaria cases registered Groups malarious areas (in millions)
1977 1978 1979 1980
Ia 72.8 531 718
IIb
1,161 2,249
15.0 5,204 5,004 9,044 11,509
111c 101.7
Ivd
140,859 156,413 182,428 219,048 41.9 252,231 302,620 322,459 365,788 Source: Pan American Health Organization; Status of Malaria in the Americas, XXIX Report (20).
aGroup I = Chile, Cuba, Curaclo, Dominica, Grenada, Guadeloupe, Jamaica, Mar- tinique, Saint Lucia, Trinidad and Tobago, the United States, Puerto Rico, and the Virgin Islands.
k roup II = Argentina, Belize, Costa Rica, the Dominican Republic, French Guiana, Guyana, Panama, the Canal Zone, and Paraguay.
cGroup III = Brazil, Ecuador, Mexico, Suriname, and Venezuela.
dGroup IV = Bolivia, Colombia, El Salvador, Guatemala, Haiti, Honduras, Nicara- gua, and Peru.
strate the socioeconomic consequences of
malaria. This study showed that the amount
of land cleared was lower on farms with a high malaria prevalence than it was on malaria-free
farms, and that during malaria epidemics
farming activities were markedly reduced.
Conversely, it has been shown outside of the
Americas that malaria eradication in grain-
producing areas is associated with increased
grain yield (2.2).
Another noteworthy point is that the prob-
lem is not one affecting a single country or
some particular collection of countries. As the
sharp increase of reported cases in the Group I
countries demonstrates, the problem affects all
countries in the Americas and is made more
serious by the ease with which potentially in-
fected people can travel rapidly from one place to another.
PAHO’s Member Governments have reaf-
firmed that malaria eradication is their ulti-
Ehrlich l SELECTED HEALTH CONDITIONS IN THE AMERICAS 123
thorough epidemiologic knowledge of the dis-
ease. It also places increased stress on opera- tional research and points out the critical job
to be performed by intersectoral and inter-
country collaboration. In this vein, it should
be noted that malaria research will be directed not only at using newer technologies to eradi- cate the vector or protect the host, but also at
periodic examinations of social and economic
variables that may have a bearing on the suc- cess with which presently effective techniques
can be applied. PAHO is actively collaborat-
ing with the WHOKJNDPlWorld Bank
Special Program for Research and Training in
Tropical Diseases on this disease, besides
strongly supporting the efforts of its member
countries to control malaria.
Concluding Remarks
This presentation has been deliberately
eclectic. No mention has been made of such
important matters as provision of potable
water and sanitation services, or the problems
posed by malnutrition and chronic debilitating
diseases. The data presented-those dealing
with current health conditions, as well as with
trends and projections-are intended to indi-
cate prime areas of research interest. It is
hoped, at the national level, that such research
will be within the scope and priorities of a na-
tional health research policy. With regard to
formulating and implementing a national
policy of this nature, it seems evident that no
single approach will be applicable to all coun-
tries. However, within the context of the Re-
gional Plan of Action, the Pan American
Health Organization stands ready to cooper-
ate with Member Governments to devise the
research policies and strategies that will in
turn permit development of the technology
needed to address the critical health problems involved.
SUMMARY
This article does not seek to provide any sort of detailed description of health conditions in the many individual countries of the Americas; rather, it presents general data relevant to health planning and health research, starting with data on demogra- phy and life expectancy and proceeding to trends in mortality from respiratory infections, diarrheal dis- eases, cardiovascular diseases, traffic accidents, and malaria. In this manner it seeks to describe the current situation, some directions of change, and some possible points of intervention that could prove useful in setting priorities for future health research.
Two major demographic trends in the Americas today are significant population growth and urbani- zation. By the year 2000, the Region’s 1980 popula- tion of about 615 million inhabitants is expected to reach something in the area of 898 million. Ob- viously, it will be necessary to provide for these in- creasing numbers. At the same time, as a result of natural growth of established city populations and migration to the cities from rural areas, health systems must be prepared to deal increasingly with urban populations, urban problems, and the expec- tations of recent immigrants to urban settings that
their surroundings will afford them better access to health care.
Regarding life expectancy, it appears that aver- age life expectancy in the Americas is increasing, and that the gap between life expectancy in North America and Latin America is closing, but also that this gap is closing less rapidly than had previously been predicted. Within this context, rapid life- expectancy gains in some developing countries sug- gest that selected interventions (including health- related interventions) can directly affect life expec- tancy in countries of the Region where average life expectancy is still relatively low.
124 PAHO BULLETIN l vol. 17, no. 2, 1983
America), highlight the need for research to develop simple methods of respiratory disease prevention and management, and suggest that future diarrhea1 disease mortality data could be used to assess the extent of certain kinds of health service coverage.
Cardiovascular disease mortality has been rising in Latin America and the Caribbean at the same time that it has been falling in North America. It is therefore essential to determine the cause of the reduced mortality in North America, so that effec- tive techniques, appropriately modified, can be ap- plied in Latin America and the Caribbean to abort the upward trend in those areas.
A similar pattern of rising traffic accident mor- tality is also found in Latin America and the Carib- bean. This underscores the need for cooperation between the health sector and other sectors that deal with policies on alcohol, licensing, and road laws to
confront this growing problem.
Data on a single disease, malaria, show a 68 per cent increase in reported cases in the Americas be- tween 1975 and 1980. Particularly sharp increases in the imported cases reported by countries free of the disease demonstrate that all countries are af- fected. PAHO’s Plan of Action, adopted by the Directing Council in 1981, calls for a variety of antimalarial measures, places increased stress on operational research against the problem, and points out the critical need for intersectoral and in- tercountry collaboration. In this vein it should be noted that malaria research will be directed not only at using newer technologies to eradicate the vector or protect the host, but also at periodic exam- inations of socioeconomic variables that may have a bearing on the success with which presently effec- tive techniques can be applied.
REFERENCES
(1) Pan American Health Organization. Health for All b the Year 2000: Strategies. PAHO Official
Document No. 173. Washington, D.C., 1981. (2) Pan American Health Organization. Health for All by the Year 2000: Plan of Action for the Implemen- tation of Regional Strategies. PAHO Official Docu- ment No. 179. Washington, D.C., 1982.
(3) Pan American Health Organization. Health Conditions in the Americas (1977-1980). PAHO Scien- tific Publication No. 427. Washington, D.C., 1982.
(4) Centro Latinoamericano de Demografia (CELADE). Boletin Demogrdfica. Series A, No.. 168. February 1981.
(5) Simon, J. L. Resources, population, envi- ronment: An oversupply of false bad news. Science 208: 1431-1437, 1980.
(6) Fox, R. W. Urban Population Growth Trends in Latin America. Washington, D.C., 1975.
(7) World Bank. Health Sector Policy Paper. Washington, D.C., 1975.
(8) Chao, D.N.W. National Resources and Life Expectation. In Proceedings of the Meeting on Socioeco- nomic Determinants and Consequences of Mortality. World Health Organization, Mexico City, 1979, pp. 453-482.
(9) Grant, J. P. Disparig Reduction Rates in Several Indications: A Proposal for Measuring and Targeting Progress in Meeting Basic Needs. Overseas Develop- ment Council, Washington, D.C., 1978.
(10) Gwatkin, D. R. Signs of Change in Developing Country Mortality Trends: The End of an Era? Develop-
ment Paper 30. Overseas Development Council, Washington, D.C., 1981.
(11) Behm, H. Socioeconomic Determinants of Mortality in Latin America. In Proceedings of the Meeting on Socioeconomic Determinants and Consequences of Mortality. World Health Organization, Mexico City, 1979, pp. 140-165.
(12) Moriyama, I. M. Public health aspects of differential mortality. In Proceedings of the Meeting on Socioeconomic Determinants and Consequences of Mortali- b. World Health Organization, Mexico City, 1979, pp. 8-25.
(13) Walsh, J. A., and K. S. Warren. Selective primary health care: An interim strategy for disease control in developing countries. N Engl J Med 301:967-974, 1979.
(14) Loda, F. A., W. P. Glezen, and W. A. Clyde. Respiratory disease in group day care. Pedi- atrics 49:428-437, 1972.
(15) Mata, L. J. The Children of the Santa Maria Cauque: A Prospective Field Study of Health and Growth. M.I.T. Press, Cambridge, Mass., 1978.
(16) Riley, I. D. Pneumonia in Paupa, New Guinea. Thesis for the M.D. degree. University of Sydney, Australia, 1979.
(17) Alfaro Alvarez, C., and C. Dfaz-Caller. Traffic accidents: A growing public health problem. Bull Pan Am Health Organ 11(3):224-231, 1977.
Ekrlick l SELECTED HEALTH CONDITIONS IN THE AMERICAS 125
(19) Pooling Project Research Group. Relation- ship of blood pressure, serum cholesterol, smoking habit, relative weight, and ECG abnormalities to incidence of major coronary events: Final report of the pooling project. J Chron Dis 31:201-306, 1978.
(20) Pan American Health Organization. Status of Malaria Programs in the Americas, XXIX Report: Report of the XXVIII Meeting of the Directing Council. Washington, D.C., 1981.
(21) Conly, G. N. The Impact of Malaria on Eco- nomic Development: A Case Study. PAHO Scientific Publication No. 297. Pan American Health Orga- nization, Washington, D.C., 1975.
(22) Barlow, R. The Economic Effects of Malaria Eradication. Bureau of Health Economics, Research Series No. 15. University of Michigan School of Public Health, Ann Arbor, 1968.
IMPORTED HUMAN RABIES IN THE UNITED STATES
A United States national 30 years of age was exposed to rabies by a dog-
bite in Nigeria in October 1983. He died in the U.S. on 28 January 1983,
28 days after the onset of symptoms. This was the first case of human rabies in the United States reported to the United States Centers for Disease Con- trol since August 1981.
On 8 October the patient, who worked in Nigeria, was bitten on the right
wrist by his pet doberman pinscher while attempting to free it from a trap.
The dog died later that day and was buried without laboratory examination
for rabies. The patient sought medical attention and received a tetanus im-
munization, but because the dog had recently been immunized against
rabies, it was decided that postexposure prophylaxis was unnecessary.
Eleven weeks later the patient returned to the United States. He re-
mained well until 1 January 1983, 85 days after the bite, when the first
disease symptoms appeared. On 6 January, a day after he was admitted to
the hospital, a diagnosis of rabies was considered and the patient was placed
in strict isolation. On 8 January he was started on a systemic interferon
treatment which was discontinued 17 days later.
A total of 132 persons were evaluated for potential contact with infectious
secretions from the patient. Twenty-eight persons received rabies postex-
posure prophylaxis after the patient’s death on 28 January, and 3 pathol-
ogists received preexposure prophylaxis before his death.