Mathematical Model of Sorption Kinetics of Crude Oil by Rubber Particles
from Scrap Tyres
Felix Aibuedefe AISIEN1,*, Robert Oboigbaotor EBEWELE1, Fredrick Kofi HYMORE2
1
Department of Chemical Engineering, University of Benin, Benin City, Nigeria
2
Department of Chemical Engineering, Covenant University, Ota, Nigeria
E-mail: [email protected]
*
Corresponding author: Phone: +23408025343897
Received: 26 September 2011 / Accepted: 3 May 2011 / Published: 24 June 2011
Abstract
This paper present an insight into how rubber particles from scrap tyres can be
utilized to clean up oil spillages as well as how the process of sorption of
crude oil by rubber particles can be stimulated based on sorption kinetics.
Crude oil sorption tests using recycled rubber particles (a model absorbent)
were designed for investigating crude oil concentration profiles. The model
based on a linear driving force (LDF) was developed using a set of
experimental data and multiple regression analysis. The crude oil sorption
performance tests were conducted under various operating conditions by
varying parameters such as rubber particle size and absorption temperature.
The predictive capacity of the kinetic model was evaluated under conditions
significantly different from those that have already been measured. The
experimental results obtained previously were correlated with the first order
sorption kinetics model developed. The results showed that the first order
kinetics model accurately correlate the experimental data generated. Also,
satisfactory results were obtained from simulation of other operating
Keywords
Sorption Kinetics; Linear Model; Rubber Particles; Prediction; Simulation;
Crude Oil.
Introduction
Recently in Nigeria, there has been increasing environmental awareness on the
adverse effects of crude oil spillage on the environment especially among oil producing
communities in the Niger Delta area. The environmental impact/hazard of crude oil spillage
include: impeded reproduction of aquatic life, destruction of fishing grounds, destruction of
vegetation and loss of soil fertility, reduced marine activities such as fishing and navigation
and contamination of surface and underground water [1-2].
Several methods of remediation have been used in the past such as spraying of
aqueous slurry of expanded graphite and chalk, burning of oil with wicking agents, disposing
of oil with detergent, applying floating barriers or booms, using of polymeric foams and other
absorbents such as recycled rubber and enhanced biodegradation[1-5]. However, the use of
absorbents provided they are environmentally friendly, easily recoverable and of low cost has
proved to be one the fastest way of combating oil spillage on the environment [6, 7]. Aisien et
al. [1, 2] reported that recycled rubber from scrap tyres is very efficient for crude oil sorption.
They stated that crude oil uptake by rubber particle is a combination of both absorption and
adsorption and since absorption is a volumetric phenomenon and adsorption is a surface
phenomenon, the uptake of crude oil is mostly due to absorption and to a considerably small
extent due to adsorption. Also, they reported that rubber particles from scrap tyres absorbed
2.2 to 5.7 times its own weight depending on the sorption temperature and rubber particle
size. Aisien et al. [1, 2] also reported that in a typical oil sorption process the uptake of oil by
rubber was more controlled by a combination of kinetics and equilibrium. The success
achieved in the clean-up of crude oil spill using rubber particles has necessitated this further
investigation involving the development of a sorption kinetics model for predicting crude oil
uptake using rubber particles. According to Tu et al. [8], the essence of model(s) is to
facilitate the forecasting of process dynamics under different operating conditions, and
Aisien et al. [1] and multiple regression analysis. experimental data will provide the necessary
feedback for verification of the predictive capacity of the model. This research takes into
consideration the concentration of crude oil uptake as a function of rubber particle size,
sorption temperature, equilibrium sorption time and rubber particle weight. The simulation of
crude oil sorption system was carried out to predict other different operating conditions
outside the experimental ones. The kinetics of crude oil sorption was determined by direct
measurement of the weight of rubber particle uptake (absorption) of crude oil as a function of
other variables stated above [1].
The objectives of this research included: developing kinetic models (linear and
quadratic), evaluating the predictive capacities of the models, simulation of crude oil
absorption.
Material and Method
The sorption kinetics of crude oil by rubber particles is essentially based on the rate of
the sorption system. It is quite obvious that for the crude oil sorption system the driving force
is the concentration gradient of oil in the bulk solution and in the rubber particles. However,
the rate strongly depends on the driving force, and in this case the diffusion process is the
mechanism by which the oil is driven from the bulk solution into the rubber particles due to
the presence of concentration gradient. Hence, it is assumed that linear driving force for the
sorption of crude oil at any time t is the difference in concentration between the equilibrium
and the bulk liquid time t. [9]
Rate of sorption of crude oil by rubber particles is given as:
dC/dt=k1(Ceq-C) (1)
where C = Absorbed crude oil concentration at time t (g/g), Ceq = Absorbed crude oil
concentration at equilibrium (g/g), that is mass transfer equilibrium and k = Mass transfer
constant (min-1).
The weight of rubber, W is an important parameter in crude oil absorption model. This
will enable accurate prediction of the quantity of rubber required for a given cleanup.
However, it is independent on the concentration of the crude oil (C) and time (t), hence W is a
W(dC/dt)=k1(Ceq-C) (2)
Integrating and rearrangement of equation (2) gives:
ln[Ceq/(Ceq-C)]=k1t/W (3)
Solving equation (3) for C yields,
) e 1 ( C C W t k eq 1 − − = (4)
Rearranging equation (4)
⎥ ⎥ ⎥ ⎥ ⎦ ⎤ ⎢ ⎢ ⎢ ⎢ ⎣ ⎡ − = eq 1 C C 1 1 ln k W t (5)
Equation (5) is a modified first order sorption kinetics that is applicable to crude oil
sorption by rubber particles.
Determination of Model Parameters
The use of the model to predict the absorption as a function particle size of rubber and
temperature of absorption will require the variation of the mass transfer equilibrium, Ceq and
the mass transfer constant,k as a function of these same parameters.
From the experimental data reported by Aisien et al. [1], the following correlation was
tested to predict the mass transfer equilibrium, Ceq as a function of sorption temperature, Ta
(in oC) and rubber particle size, Sr (in mm):
Ceq (Sr, Ta) = ao + a1Sr + a2Ta + a3SrTa +...+ anSnTn (6)
where ao, a1, a2, and a3 are numerical constants which can be estimated by multiple regression
analysis.
Set of 36 Ceq values which were obtained from experimental results as reported by
Aisien et al. [1] was used in the search equation 6. The regression analysis showed that ao, a1,
a2, were 6.1764, -1.446 and -0.002786 respectively. Hence the equation becomes:
Ceq (Sr, Ta) = 6.1764 -1.446Sr - 0.002786Ta (7)
Equation (7) was used to calculate mass transfer equilibrium Ceq,. The calculated Ceq,
correlated favourably with the measured Ceq as reported by Aisien et al. [1]. Also, similar
trend was observed that it, Ceq decreases with decrease in rubber particle size (S_r) and
Additional terms in eq. (7) did not make any significant difference to the accuracy of
the predictions of the mass transfer equilibrium. The substitution of eq. (7) into the derived
model equations enabled the determination of the only unknown model parameter, which is
the mass transfer constant, k.
The mass transfer constant, k can be calculated from the appropriate plots of the
rearranged model equation 5. From eq. (5) k, is obtained from the slope of the plot
⎥ ⎥ ⎦ ⎤ ⎢ ⎢ ⎣ ⎡ − − = eq s C C 1 ln W V t (8)
This is illustrated in Figure 1 using rubber particle size of 0.60mm and sorption
temperature of 30oC. The high correlation coefficients, (R2 > 0.99) testify to this by the linear
model.
Figure 1. Variation absorption time with W*In[1-(C/Ceq)] for linear model
With the generation of the mass transfer constant, k for the different sorption
temperatures and rubber particle sizes, a correlation similar to eq. (7) was obtained by using
the least square method. This gave the mass transfer constant, k as a function of sorption
temperature and rubber particle size.
Based on linear driving force model, k correlation is
k (Sr,Ta) = 0.3203 - 0.06557Sr - 0.00237Ta (9)
This gives a mass transfer constant which decreases with rubber particle size (S_r) and
sorption temperature (Ta).
y = 0.5583x + 0.6509 R² = 0.9935
0 5 10 15 20 25 30 35
0 10 20 30 40 50 60 -W*In[1-(C/Ceq)]
K-Value
t(
min
Substitution of equations (7) and (9) into eq. (4) will enable the evaluation of the
concentration of oil absorbed, C as a function of the most relevant parameters such as sorption
temperature, Ta particle size of rubber, Sr weight of rubber, W and time for sorption, t.
The linear driving force model,
C( t, Sr, Ta, W) = (6.1764-1.446Sr-
- 0.002786Ta)
(
)
⎥ ⎦ ⎤ ⎢
⎣ ⎡
⎥⎦ ⎤ ⎢⎣
⎡ − −
− −
W
t T 00237 . 0 S 06557 . 0 3203 . 0 exp
1 r a (10)
Results and Discussion
Comparison of the LDF model data with measured data
Equations (10) was used of generate the concentration - time data for the LDF model.
The calculated concentration - time data were compared with the experimental results
(measured data). Figure 2 shows the comparison of the measured concentration data with
calculated concentration data for different particle sizes of rubber and sorption temperatures.
It can be seen that the calculated concentration-time data conformed to experimentally
obtained concentration-time data. As a result, the predictions of the model were very
satisfactory.
Figures 3 to 5 show the comparison of the experimental obtained concentration - time
data with concentration - time data based on LDF model prediction. These Figures also
support the fact that the predicted concentration-time data compared favorably with the
experimental concentration-time data. In all cases, it can be seen that the
experimental/measured data and the predicted/calculated data for the concentration of
absorbed crude oil gave an excellent agreement. However, the good performance of the model
Figure 2. Comparison of the measured concentration with model predictions at different rubber particle sizes and temperatures
Figure 3. Comparison of the experimental concentration with concentration based model predictions [278K, 0.425mm]
0 1 2 3 4 5 6
0 5 10 15 20 25 30
Time (min.)
Experimental concentration Concentration based on linear model
Crude oi
l
conce
n
tration
(g/g)
1 2 3 4 5 6
1 2 3 4 5 6
Measured concentration (g/g)
Pred
icted
co
n
cen
tration
(g
Figure 4. Comparison of the experimental concentration with concentration based model predictions [288K, 0.300mm]
Figure 5. Comparison of the experimental concentration with concentration based model
predictions [293K, 0.600mm] 0
1 2 3 4 5 6
0 5 10 15 20 25 30
Time (min.)
Experimental concentration
Concentration based on quadratic model
Crude oi
l
conce
n
tration
(g/g)
0 1 2 3 4 5 6
0 5 10 15 20 25 30
Time (min.)
Experimental concentration Concentration based on linear model
Cr
ude oil concentr
ation
(g
Simulation of Concentration - Time Data using Linear Model
The LDF model was employed in the simulation of concentration - time data for
different rubber particle sizes and for different sorption temperatures outside the experimental
conditions reported earlier by Aisien et al. [1].
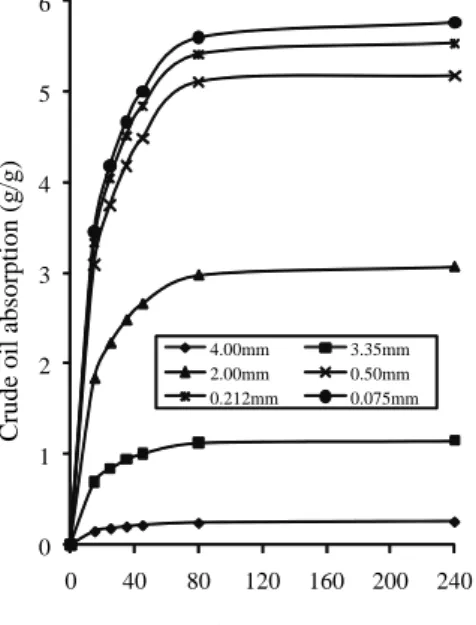
Figure 6 shows the concentration - time profile for different rubber particle sizes
(0.075mm, 0.212mm, 0.50mm, 2.00mm, 3.35mm and 4.00mm) at 15°C. The observed trend
in Figures 6 is similar to that obtained experimentally as reported by Aisien et al. 2003 and
2006. The trend shows a rapid, initial increase in sorption, followed by a decrease until an
asymptotic value is reached at equilibrium crude oil sorption. Figure 6 shows the smaller the
rubber particle size, the faster and better was the crude oil sorption. This indicates that the
uptake of crude oil was more controlled by combination of kinetics and equilibrium as earlier
stated by Aisien et al. [1, 2], and this is apparent from the results presented in Figure 6. It can
also be seen that the saturated uptake concentration is approximately proportional to the
reciprocal of the particle size of rubber. This is so because the rate of uptake is dependent on
the specific surface area of the rubber particles.
Figure 6. Variation of crude oil absorption at 298K with rubber particle size
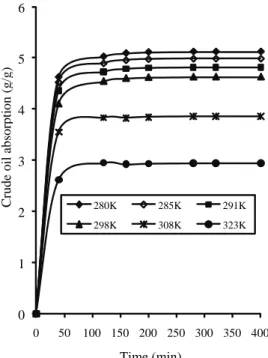
Figures 7 shows the concentration - time profile for different sorption temperatures
(7°C, 12°C, 18°C, 25oC, 35°C and 50°C) using 0.60mm rubber particle size.
0 1 2 3 4 5 6
0 40 80 120 160 200 240 Time (min)
4.00mm 3.35mm
2.00mm 0.50mm
0.212mm 0.075mm
Crude oil
absorption (g
Figure 7. Variation of crude oil absorption a with temperature (0.600mm rubber particle size)
The observed profile in Figures 7 is also similar to that obtained experimentally as
reported by Aisien et al. [1, 2]. The results in Figure 7 substantiate the fact that crude oil
sorption is an exothermic process and is therefore not enhanced by an increase in temperature.
The uptake of crude oil decreases with increasing temperature. This statement has been
clearly explained in the earlier report by Aisien et al. [2]. In conclusion, the results in Figures
6 and 7 show the consistency of the LDF model and the accuracy of predictions was about 68
percent. The smaller the particle size of rubber the larger the concentration of oil absorbed.
Similarly, the lower the sorption temperature, the higher the concentration of oil absorbed.
However, the simulation at different sorption temperatures was better than for different rubber
particle sizes using the first order kinetics model obtained from set of experimental data and
multiple regression analysis.
Conclusion(s)
The following conclusions can be drawn from this study:
• The model based on a linear driving force (LDF) was developed using a set of
experimental data and multiple regression analysis. 0
1 2 3 4 5 6
0 50 100 150 200 250 300 350 400
Time (min)
280K 285K 291K 298K 308K 323K
Crude oil
absor
p
tion
(g
• The crude oil sorption kinetics is a first order.
• The accuracy of the model predictions is about 68 percent and the model predictions were
consistent with experimental results earlier obtained.
• The simulation shows the expected trends of crude oil absorption with respect to rubber
particle size and sorption temperature.
References
1. Aisien F.A., Ebewele R.O., Hymore F.K., Potential Application of Recycled Rubber in
Oil Pollution Control, Environmental Monitoring and Assessment, 2003, 85, p.
175-190.
2. Aisien F.A; Hymore F.K., Ebewele R.O. Comparative Absorption of Crude Oil from
Fresh and Marine Water Using Recycled Rubber Journal of Environmental
Engineering, 2006, 132(9), p. 1078 - 1082.
3. Aisien F.A., Potential applications of recycled rubber from scrap tyres Ph.D thesis,
Department of Chemical Engineering, University of Benin, Benin City, Nigeria, 2003.
4. Lewicke C.K., Cleansing Up Oil Spills Isn’t Simple, Environmental Science and
Technology, 1973, 7(39), p. 400-410.
5. Imevbore A.M.A., Ekundayo J.A., Effect Of crude Oil Effluent Discharge on the Water
Quality and Biological Production in the Niger-Delta, Nigeria. Final Report, Shell
Petroleum Development Company, Nig. Ltd., Lagos, 1987, p. 197-260.
6. Lessard R.R., Wilkinson J. B., Prince R.C., Bragg J. R., Clark J. R., Bioremediation
applications in Clean up of the 1989 Alaska oil spill, ASTM Spec. Tech., 1995, STP
1235 p. 207-225.
7. Labelle R.P., Galt J.A., Tennyson E.T., Mcgrattan K.B., The 1993 oil spill of Tampa
Bay, a scenario for burning; Spill Sci. Technol. Bull., 1994, 1(1), 5-9.
8. Tu S.C., Ravindran V., Den W., Pirbazari M., Predictive membrane transport model for
![Figure 1. Variation absorption time with W*In[1-(C/Ceq)] for linear model](https://thumb-eu.123doks.com/thumbv2/123dok_br/16390222.192643/5.892.323.571.483.816/figure-variation-absorption-time-w-ceq-linear-model.webp)
![Figure 3. Comparison of the experimental concentration with concentration based model predictions [278K, 0.425mm] 01234560510152025 30Time (min.)Experimental concentration Concentration based on linear model](https://thumb-eu.123doks.com/thumbv2/123dok_br/16390222.192643/7.892.293.599.621.1033/comparison-experimental-concentration-concentration-predictions-experimental-concentration-concentration.webp)
![Figure 5. Comparison of the experimental concentration with concentration based model predictions [293K, 0.600mm] 01234560510152025 30Time (min.)Experimental concentration](https://thumb-eu.123doks.com/thumbv2/123dok_br/16390222.192643/8.892.306.585.558.928/figure-comparison-experimental-concentration-concentration-predictions-experimental-concentration.webp)