Differences in pressure and
temperature transitions of
proteins and polymer gels
1Department of Polymer Science and Engineering, Kyoto Institute of Technology,
Matsugasaki, Sakyo, Kyoto, Japan
2Institute for Solid State Physics, Neutron Science Laboratory, University of Tokyo,
Kashiwa, Chiba, Japan
3Department of Molecular Chemistry, Osaka University, Suita, Osaka, Japan
S. Kunugi1, K. Kameyama1,
T. Tada1, N. Tanaka1,
M. Shibayama2
and M. Akashi3
Abstract
Pressure-driven and temperature-driven transitions of two thermore-sponsive polymers, poly(N-isopropylacrylamide) (pNIPAM) and poly(N-vinylisobutyramide) (pNVIBA)), in both a soluble linear poly-mer form and a cross-linked hydro-gel form, were examined by a dynamic light-scattering method and direct microscopic observation, respectively. Their behavior was compared with that of protein sys-tems. Changes in some characteristic parameters in the time-intensity correlation functions of dynamic light-scattering measurement of aqueous solutions of pNIPAM at various pressures and temperatures showed no essential differences during temperature and pressure scanning and, as a whole, the motions of polymers in aqueous solu-tions were similar in two types of transisolu-tions until chain shrinkage occurred. The gels (cross-linked polymer gels) prepared from the thermoresponsive polymers also showed similar volume transitions responding to the pressure and temperature increase. In temperature transitions, however, gels showed drastic volume shrinkage with loss of transparency, while pressure-induced transition showed a slow recovery of transparency while keeping the size, after first transient drastic volume shrinkage with loss of transparency. At a temperature slightly higher than the transition under atmospheric temperature, so-called reentry of the volume change and recovery of the transparency were observed during the pressure-increasing process, which implies much smaller aggregation or non-aggregated collapsed polymer chains in the gel at higher pressures, indicating a certain mechanistic differ-ence of the dehydration processes induced by temperature and pres-sure.
Correspondence
S. Kunugi
Department of Polymer Science and Engineering,
Kyoto Institute of Technology Matsugasaki, Sakyo Kyoto 606-8585 Japan
Fax: +81-75-724-7100 E-mail: [email protected]
Presented at the 3rd International Conference on High Pressure Bioscience and Biotechnology, Rio de Janeiro, RJ, Brazil, September 27-30, 2004.
Received January 17, 2005 Accepted May 5, 2005
Key words •Pressure
•Temperature •Denaturation
•Transition •Proteins
•Thermoresponsive polymers
•Polymer gel
Introduction
Pressure-driven protein transition is simi-lar to temperature-driven transition in many aspects and the formulae for the two pro-cesses are represented by a simple
thermo-dynamic equation (1-4). We have shown many examples of protein denaturation on a universal P-T plane (5-7).
transi-tions of proteins. These reports have de-scribed, in addition to distinct aggregations of proteins through temperature denaturation, a multi-step nature and higher retention of the secondary structures in the pressure tran-sition (8,9).
Several synthetic polymers, including vinyl polymers, are also known to show distinct changes in their molecular level states in solution in response to temperature and pressure, as shown in several examples pub-lished by our group (10-18).
In the present study, we examined the temperature and pressure transitions of two thermoresponsive polymers (poly(N-isopro-pylacrylamide) (pNIPAM) and poly(N-vi-nylisobutyramide) (pNVIBA)) in both a soluble linear polymer form and a cross-linked hydro-gel form, and compared their behavior with that of proteins.
pNIPAM and pNVIBA are isomers; pNVIBA has amide bonds in its side chains in an inverted direction compared to pNIPAM. Both are also chemical isomers of polyleucine, and thus thermoresponsive poly-mers and their gels can be considered to be simple but relevant models of proteins. In-terestingly, polyleucine barely dissolves in aqueous solutions, while both pNIPAM and pNVIBA are readily soluble in water below the temperature of thermal transition.
Thermodynamically the coil for collapse transition of these polymers upon increasing temperature corresponds to the transition from the unfolded protein to the folded struc-ture, namely a model of the inverse process of cold denaturation across the cold renatur-ation temperature.
Material and Methods
The linear polymer pNIPAM was pre-pared from the N-isopropylacrylamide mono-mer (Kojin Co., Tokyo, Japan) by radical polymerization and purified by precipitation
with ethyl alcohol (Mw = 76,000).
A cross-linked hydro-gel of
butyramide was prepared from N-vinyliso-butyramide and a cross-linker
(butylene-bis-N-vinylacetamide: 1/100 in monomer ratio)
also by radical polymerization.
The cloud points for the aqueous solu-tions of the polymer were determined by observing the apparent light scattering using a high-pressure optical cell constructed by Teramecs Co. (Kyoto, Japan) with three sap-phire windows. The cell was incorporated into a conventional spectrofluorophotometer (RF-5300PC, Shimadzu, Kyoto, Japan), and the excitation and emission light wavelength was 400 nm. The experiments were per-formed by either scanning the temperature (T) with an electronic regulator linked to a water circulator (Eyela, Tokyo, Japan) at constant pressure, or by scanning the pres-sure (P) with a compact hand-driven high-pressure pump at constant temperature. The starting points were determined by plotting the logarithms of the scattering intensity against T or P and fitting to two crossing lines after transforming the intensity values to positive values by adding the necessary minimum integer. The T or P values ob-tained were practically insensitive to the choice of this arbitrary and minimum inte-ger.
The dynamic light scattering (DLS) of aqueous polymer solutions was measured with an ALV-5000 SLS/DLS goniometer (Langen, Germany). A helium-neon laser with a wavelength of 6328 Å was used as an incident beam. The scattered photons were measured with an avalanche photodiode sys-tem provided by ALV. A high-pressure sample cell similar to the above mentioned one was settled on the light beam and the scattering was counted at 90º. A 1% aqueous solution of pNIPAM was prepared and fil-tered several times through a 0.45-mm MILLEX-HV filter unit (Millipore, Billerica, MA, USA). Pressure and temperature were controlled as in the cloud point measure-ment.
g(2) (τ) (Equation 1) were analyzed by Equa-tion 2, consisting of a single exponential function corresponding to the transverse motion of a polymer chain (fast mode) and a stretched exponential function expressing the slow transverse motion of a cluster (19,20).
g(2)(τ) = {<I(t;q)I(t + τ;q)>
T}/<I(t;q)>2T (Eq. 1)
where I(t;q) is the scattered intensity
ob-served at time t and at the scattering vector q,
τis the time lag, and <>T denotes the time
average.
g(2)(τ) - 1 ≈ σ2
I{Aexp(-Dfq2τ) + (1-A)exp [-(τ/τs)ß]}2 (Eq. 2)
where σ2
I, A, ß, τs, and Df are the initial light amplitude, ratio of the slow mode, stretched exponent, relaxation time of the slow mode, and the translational diffusion constant, re-spectively.
Microscopic observation of the gel under high pressure was performed using a phase difference microscope (OPTHPHOT-2, Ni-kon, Tokyo, Japan), equipped with a high-pressure microscopic cell (PC-400MS, Teramecs). The images were photographed with an USB microscopic camera (QX3, Intel, Santa Clara, CA, USA). Pressure and temperature were controlled as in the cloud point measurement.
Results and Discussion
In most of the protein denaturation pro-cedures, as shown in a typical example re-garding phosphoglycerate kinase (Figure 1), both the pressure transition and the cold transition proceed in a stepwise manner, while these multiple steps occur almost si-multaneously in the heat denaturation and the total transition seems to be a single step. As for a hypothetical double-domain pro-tein, Murphy and Freire (21) described that
the free energy states and the structural tran-sitions can be classified into three catego-ries, based on the cooperative free energy
between denatured domains (∆gA’,B’)
two-state behavior: 1) both domains are either folded or unfolded, in the case of very large
∆gA’,B’, 2) independent folding/unfolding of
the two domains with very small ∆gA’,B’, and
3) folding/unfolding of interacting domains
with intermediate ∆gA’,B’. Thus, thermal
de-naturation seems to belong to the first cat-egory, but the cold and pressure denatur-ations belong to the second or the third cat-egory.
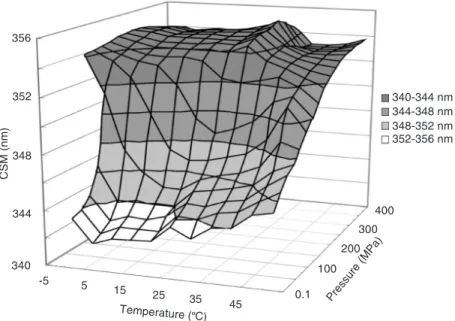
The time-intensity correlation functions of DLS measurement of aqueous pNIPAM solutions at various pressures and tempera-tures were obtained as shown in Figure 2. The apparent cloud point of this polymer is known to show an elliptic diagram on the temperature-pressure plane (10,12), and the T- or P-scanning in the present DLS meas-urements was performed at 25ºC or 0.1 MPa, respectively, up to the point just before the occurrence of clouding and precipitation.
Changes in some basic parameters (ß, A,
340-344 nm
CSM (nm)
356
344-348 nm 348-352 nm 352-356 nm
400 352
348
344
340
-5 5
15 25
35 45 Temperature (º
C)
300
200
100
0.1 Pressure (MPa)
10-3 10-2 10-1 100 101 102 103 1.0
0.8
0.6
0.4
0.2
0.0
g
(
)-1
(2)
Slow mode Temperature ( C)
º
25 30 32.5 32.8 33 33.2 33.4
(ms)
10-3 10-2 10-1 100 101 102 103 1.0
0.8
0.6
0.4
0.2
0.0
g
(
)-1
(2)
Fast mode
Slow mode
Pressure (MPa) 0.1
50 100 140 150 155 160 165 170 175
(ms)
Df, and <τs>) were calculated from these time-intensity correlation functions, and those obtained by T- and P-scanning were compared in Figure 3. No essential differ-ences in the changes in these parameters were observed during temperature and pres-sure scanning. When approaching the transi-tion point, the stretched exponent (ß)
in-creased and the fast mode ratio (A) decreased.
The diffusion constant (Df) also decreased at
higher temperatures or pressures. A differ-ence was observed in the relaxation time of
the slow mode (<τs>) which became very
low at higher temperatures but higher at higher pressures. On the whole, the motions of polymers in aqueous solutions were simi-lar in the two types of transitions until chain shrinkage occurred.
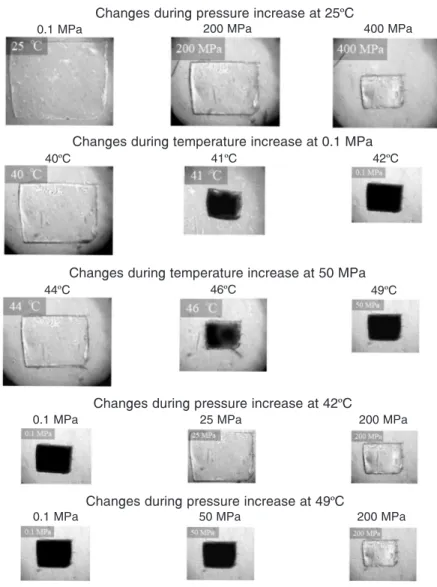
The gels (cross-linked polymer gels) pre-pared from the thermoresponsive polymers are known to show a clear volume transition upon exposure to higher temperature (10), reflecting the characteristics of the nature of the polymer component and gel preparation conditions. They also show similar volume transitions responding to the pressure in-crease. Some examples of microscopic im-ages under various conditions are listed in Figure 4. With increasing pressure, the trans-parent gel at 25ºC gradually shrank and showed a marked volume contraction at
pres-Figure 2. The time-intensity correlation functions of dynamic light scattering measurement of aqueous solutions of poly(N-isopropylacrylamide) (pNIPAM) at various temperatures and 0.1 MPa (A) and at various pressures and 25ºC (B). [pNIPAM] = 1%.
Figure 3. Changes in the stretched exponent (ß), the ratio of fast mode (A), the diffusion constant (Df) and the relaxation
Figure 4. Some examples of microscopic images of the cross-linked poly(N-vinyliso-butyramide) (pNVIBA) gels under various conditions.
sures above 400 MPa, keeping its transpar-ency. The thermal transition at 0.1 MPa induced a sudden shrinkage between 40 and 41ºC, causing clouding of the gel (the image becomes dark under transmitting white light). The changes at 50 MPa were basically simi-lar to those at 0.1 MPa, but the transition occurred at a higher temperature (ca. 45ºC). Thus, when we observed at 42ºC with in-creasing pressure, the clouded and shrunken gel recovered its size and transparency at, e.g., 25 MPa, whereas a further increase in pressure caused the gel to shrink while keep-ing its transparency. At 49ºC, the clouded and shrunken gel became transparent, keep-ing its size when the pressure was increased up to 200 MPa.
The volumes of the gel at various tem-peratures and pressures relative to 25ºC and 0.1 MPa are summarized in the form of contour map in Figure 5. Regarding the vol-ume (or size) of the gel, the figure shows a behavior similar to that of soluble polymers as compared with the transition curves of the soluble pNVIBA illustrated in the same fig-ure. In this respect, P and T transitions seem to be the same.
The transitions of these thermoresponsive polymers and gels occur due to the dehydra-tion process and the strengthening of hydro-phobic interactions among side chains, and due to the structural deformation of water around the hydrophobic groups.
Hydrophobic interactions among alkyl chains show slightly positive volume changes (22). The compressibility of bulk water is greater than that of the water that surrounds the hydrophobic groups; thus, increasing the
Figure 5. The relative volumes of the poly(N-vinyliso-butyramide) (pNVIBA) gel at various temperatures and pressures, presented in the form of a contour map. The reference volume is that at 25ºC and 0.1 MPa. For comparison, the transition curves of the soluble pNVIBA are overlaid: Mw = 11 kDa (dashed line) and = 66 kDa (dotted line; data from Ref. 12).
250
200
150
100
50
0.1
25 30 35 40 45 50
Temperature ( C)º
Pressure (MPa)
Changes during pressure increase at 25ºC
0.1 MPa 200 MPa 400 MPa
Changes during temperature increase at 0.1 MPa
40ºC 41ºC 42ºC
Changes during temperature increase at 50 MPa
Changes during pressure increase at 42ºC
0.1 MPa 25 MPa 200 MPa
44ºC 46ºC 49ºC
Changes during pressure increase at 49ºC
pressure further can invert the situation, and the maximum clouding temperature was ob-served.
However, the appearance of the shrunken gels at elevated pressures was somehow dif-ferent from their appearance at lower pres-sures. At 49ºC, for example, the turbid and shrunken gel became transparent at pres-sures above 100 MPa. This reflects the dif-ferent aggregation states of the polymer chains. Much less aggregated or non-aggre-gated collapsed polymer chains will be formed in the gel at higher pressures. This
implies a certain mechanistic difference of the dehydration processes induced by tem-perature and pressure, although we need further precise investigations of the network structures of the shrunken gels in order to understand the detailed mechanisms. Recent studies using molecular dynamic simulation have reported that peptide dehydration dif-fers in the location of the hydrated chains between temperature- or pressure-induced dehydration, which might be a key to detect the mechanism of the present phenomeno-logical differences (23).
References
1. Hawley SA (1971). Reversible pressure-temperature denaturation of chymotrypsinogen. Biochemistry, 10: 2436-2442.
2. Zipp A & Kauzmann W (1973). Pressure denaturation of metmyoglo-bin. Biochemistry, 12: 4217-4228.
3. Heremans K & Smeller L (1998). Protein structure and dynamics at high pressure. Biochimica et Biophysica Acta, 1368: 353-370. 4. Smeller L (2002). Pressure-temperature phase diagrams of
biomol-ecules. Biochimica et Biophysica Acta, 1595: 11-29.
5. Yamamoto H, Makino M, Tada T et al. (1999). Pressure-assisted cold-denaturation of carboxypeptidase Y. Bulletin of the Chemical Society of Japan,72: 2803-2806.
6. Ikeuchi H, Kunugi S & Oda K (2000). Activity and stability of a neutral protease from Vibrio sp. (vimelysin) in a pressure-tempera-ture gradient. European Journal of Biochemistry, 267: 979-983. 7. Tanaka T, Ikeuchi H, Tanaka N et al. (2004).
Pressure-temperature-induced denaturation of yeast phosphoglycerate kinase, a double-domain protein. Cellular and Molecular Biology, 50: 317-322. 8. Torrent J, Rubens P, Ribo M et al. (2001). Pressure versus
temper-ature unfolding of ribonuclease A: an FTIR spectroscopic charac-terisation of 10 variants at the carboxy-terminal site. Protein Sci-ence, 10: 725-734.
9. Dzwolak W, Kato M & Taniguchi Y (2002). Fourier transform infrared spectroscopy in high-pressure studies on proteins. Biochimica et Biophysica Acta, 1595: 131-144.
10. Kunugi S, Takano K, Tanaka N et al. (1997). Effects of pressure on the behavior of the thermoresponsive polymer poly(N-vinylisobutyr-amide) (PNVIBA). Macromolecules, 30: 4499-4501.
11. Suwa K, Yamamoto K, Akashi M et al. (1998). Effects of salt on the temperature and pressure responsive properties of poly(N-vinyliso-butyramide) aqueous solutions. Colloid and Polymer Science, 276: 529-533.
12. Kunugi S, Yamazaki Y, Takano K et al. (1999). Effects of ionic additives and ionic comonomers on the temperature and pressure responsive behavior of thermoresponsive polymers in aqueous so-lutions. Langmuir, 15: 4056-4061.
13. Kunugi S, Tada T, Yamazaki Y et al. (2000). Thermodynamic stud-ies on coil-globule transitions of
poly(N-vinylisobutyramide-co-vinylamine) (pNVIBA-co-VAm) in aqueous solutions. Langmuir, 16: 2040-2042.
14. Yamazaki Y, Tada T & Kunugi S (2000). Effects of acrylic acid incorporation on pressure-temperature behavior and calorimetric properties of pNIPAM in aqueous solutions. Colloid and Polymer Science, 278: 80-83.
15. Tamura T, Yamaoka T, Kunugi S et al. (2000). Effects of tempera-ture and pressure on the aggregation properties of an engineered elastin model polypeptide in aqueous solution. Biomacromolecules, 1: 552-555.
16. Kunugi S, Yoshida D & Kiminami H (2001). Effects of pressure on the behavior of (hydroxypropyl)cellulose in aqueous solution. Col-loid and Polymer Science, 279: 1139-1143.
17. YamaokaT, TamuraT, SetoY et al. (2003). Mechanism for the phase transition of a genetically engineered elastin model peptide (VPGIG)40 in aqueous solution. Biomacromolecules, 4: 1680-1685.
18. Seto Y, Kameyama K, Tanaka N et al. (2003). High pressure studies on the coacervation of copoly(N-vinylformamide-vinylacetate) and copoly(N-vinylacetylamide-vinylacetate). Colloid and Polymer Sci-ence, 281: 690-694.
19. Martin JE, Wilcoxon J & Odinek J (1991). Decay of density-fluctua-tions in gels. Physical Review A, 43: 858-872.
20. Okamoto M, Norisuye T & Shibayama M (2001). Time-resolved dynamic light scattering study on gelation and gel-melting processes of gelatin gels. Macromolecules,34: 8496-8502.
21. Murphy KP & Freire E (1992). Thermodynamics of structural stability and cooperative folding behavior in proteins. Advances in Protein Chemistry, 43: 313-361.
22. Suzuki K, Taniguchi Y & Watanabe T (1973). Effect of pressure on the dimerization of carboxylic acids in aqueous solution. Journal of Physical Chemistry, 77: 1918-1922.