http://www.uem.br/acta ISSN printed: 1806-2563 ISSN on-line: 1807-8664
Doi: 10.4025/actascitechnol.v36i4.19887
Chisquaremax rotation criterion in factor analysis: a Monte Carlo
assessment of the effect of outliers
Tiago Martins Pereira1*, Marcelo Ângelo Cirillo2 and Fernando Luiz Pereira de Oliveira1
1
Departamento de Estatística, Universidade Federal de Ouro Preto, Rua Diogo Vasconcelos, 328, 35400-000, Ouro Preto, Minas Gerais, Brazil.
2
Departamento de Ciências Exatas, Universidade Federal de Lavras, Lavras, Minas Gerais, Brazil. *Author for correspondence. E-mail: [email protected]
ABSTRACT. Recently Knüsel (2008) proposed a new method of orthogonal rotation based on chi-square statistic, the Chisquaremax criterion. However, its performance has not yet been evaluated for the effect of outliers. Thus, we assessed the factorial model with Chisquaremax criterion for the effect of outliers using Monte Carlo simulation techniques in different scenarios. The efficiency of covariance matrix estimator provided by the factorial model using either Chisquaremax or Promax criteria was not affected by the presence of outliers. The orthogonal factorial model using Chisquaremax criterion showed better goodness of fit than the results obtained with Promax criterion.
Keywords: orthogonal, oblique, factors, efficiency, residues.
Critério de rotação chisquaremax em análise fatorial: uma avaliação Monte Carlo sobre o
efeito de outliers
RESUMO. Recentemente, Knüsel (2008) propôs um novo método de rotação ortogonal, denominado por critério Chisquaremax,baseado na estatística qui-quadrado, o desempenho desse critério não foi avaliado em relação ao efeito de outliers. Frente à esta questão, este trabalho teve por objetivo estudar o modelo fatorial utilizando o critério de rotação Chisquaremax em relação ao efeito de outliers, servindo-se de técnicas de simulação Monte Carlo em diferentes cenários. Concluiu-se que a eficiência do estimador da matriz de covariância proporcionada pelo modelo fatorial utilizando o critério Chisquaremax e Promax não foi afetada pela presença de outliers. O modelo fatorial ortogonal aplicando o critério Chisquaremax apresentou melhores índices de qualidade de ajuste em comparação aos resultados obtidos para o critério Promax.
Palavras-chave: ortogonal, oblíquo, fatores, eficiência, resíduos.
Introduction
Factorial model is frequently applied in many areas of research, since it is a multivariate technique that allows prediction of latent variables called factors or constructs, whose interpretation leads to information on both behavioral and psychological study of individuals showing these variables.
Determination of constructs requires calculating factor loadings. For this purpose, the factorial model provides several alternatives regarding different rotation criteria, such as Varimax and Quartimax procedures.
The Varimax procedure finds the orthogonal transformation of the loading matrix that maximizes the sum of those variances, summing across all m rotated factors, while the Quartimax procedure performs the same transformation across all p variables. However, as a method of maximum likelihood is used for estimating the model parameters, it is plausible to assume that violation of the assumption of multivariate
normality is related to the presence of outliers in the sample, which either compromises or hinders the maximization of likelihood function.
It is important to highlight that the criteria of rotation Varimax and Quartimax produce uncorrelated factors. In the case of Promax is a non orthogonal transformation that is not rotation and can produce correlated factors.
Due to the focus on factor orthogonality and non orthogonal, researchers frequently overlook fundamental differences between rotation criteria, including how different rotation criteria influence the factor structure. Various correlation matrices were used to illustrate how different factor loading structures are affected by the choice of rotation criterion (SASS; SCHMITT, 2010; SCHIMITT; SASS, 2011). Thus, Knüsel (2008) proposed a new method of factorial rotation based on chi-square statistic, the Chisquaremax criterion.
According to Knüsel (2008), Chisquaremax overcomes the major disadvantages of orthogonal criteria, such as the commonly used Varimax and Quartimax procedures. However, since Chisquaremax is relatively new and has not yet been addressed in the literature, the performance of a factorial model submitted to this method should be assessed and compared with other non-orthogonal criteria, considering samples both with different correlation degrees and contaminated with outliers. The motivation for this study is given by Cudeck and O’Dell (1994) when they state that sample size, estimation method and total amount of variance explained by the individual factor loadings influence the factor loading stability and accuracy; they also demonstrated that these assumptions are often violated. For this purpose, Liu and Zumbo (2007) recommend using the Monte Carlo simulation technique, in which contaminated samples can be generated from mixtures of distributions. Thus, we evaluated the factorial model using Chisquaremax rotation criterion compared to the criteria for orthogonal rotation (Varimax) and non orthogonal (Promax) for the effect of outliers with Monte Carlo simulation techniques. For this purpose, we simulated different scenarios and measured statistics related to efficiency and goodness of fit.
This paper is organized as follows. In Section 2 we describe the methodology; Section 2.1 - Chisquaremax rotation criterion; Section 2.2 - Methodological procedure and description of the assumptions used in the Monte Carlo simulation. In Section 3 we discuss the results of this study. Finally, in Section 4, some concluding remarks are given.
Materail and methods
Chisquaremax rotation criterion
Following the notation proposed by Knüsel (2008), the theoretical foundation of this new criterion defines the matrix of factor loadings by (1)
2 2
i ij
Λ
=
λ
= f
(1)where:
fir, i=1,…,p; r=1,…,k are the frequencies found in
a contingency table with p rows and m columns. Thus, the chi-square statistic is calculated by (2) with the quantities (2) - (6).
2ir ir
2 i,r
ir
f e χ =
e
(2)i. .r ir
f f e =
n (3)
k k
2
i. ir ir
r 1 r 1
f = λ f
(4)p p
2
.r ir ir
i 1 i 1
f = λ f
(5)ir i,r
n =
f (6)Based on this statistic, Knüsel (2008) presents a decomposition using concepts by Cramérm (1961) and shows that maximizing (2) is equivalent to maximizing the quantity (7)
2 ir
C i,r
i. .r
f X =
f f
(7)Thus, the author suggests an iterative procedure to find the maximum likelihood solution where matrices (8) represent the unrotated loading matrix; (9) corresponds to the orthogonal rotation matrix; and (10) is the rotated loading matrix
T
0 ir p k 0 1 p k p
Λ = ;Λ = ,..., (8)
1 k k k
M= m ,..., m (9)
0 ir k p
Λ M= λ
= (10)
In summary, the procedure consists of finding the maximum XC subject to the restriction that
matrix M is orthogonal, i.e. MMt=MtM=I m. For
this, an iterative procedure was presented by Knüsel (2008), that maximizes XC redefined by (11), in
which the criterion of rotation chisquaremax is generated.
However, we draw attention that the solution obtained in the convergence process in the numerical resolution of the system MA = B. Thus, the steps required in the algorithm are described sequentially 1-4:
1. Assume the initial values defined in (12); 2. Compute (13);
T
4 4i r ir
C i,r i,r i r i r
m
λ
X = w
c d c d
p k
2 2
i ir r ir
r 1 i 1
where c λ and d λ
(11)
0 ir p k 1 k
Λ = ; M I (12)
1 0 1 ir 1 ir
Λ =Λ M λ ; C c w
4 3
jr T
ir
ir 2 j ir 1 0 1
i r r j
λ
λ 1
where c λ ; B C
c d 2d c
Λ(13)
3. Compute the singular value decomposition de B1=UΔVt where U and V are orthogonal, and
Δ=diag (δ1,…,δk) and assume A1=VΔVt e M2=UVt,
M2 is orthogonal and symmetric and positive
definite, so that M2 A1=B1.
4. Repeat the procedure with M2 in place of M1
until convergence takes place.
Methodological procedure and description of the assumptions used in the Monte Carlo simulation
Given the objectives of the study, the oblique and orthogonal factor models using Chisquaremax and Promax were considered, respectively. Then the maximum likelihood method were used to compute the factor loadings using the Varimax criterion (10), which are subsequently used as argument of the iterative procedure described in the previous section proposed to obtaining the factor loadings of chisquaremax criteria argument.
Concerning the generation of multivariate samples via Monte Carlo, are assumed that the correlation structure defined by (14) and the vector of means whose components were equal to zero.
1 1 R= 1 (14)
With the purpose of evaluating the criterion of rotation chisquaremax in relation to the effect of the
degree of correlation between variables arbitrarily, it remained fixed in the parametric values ρ = 0.2 and 0.8. Thus, the samples were generated under different scenarios, described in Table 1.
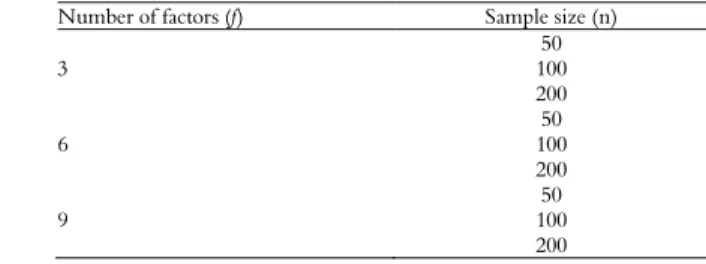
Table 1. Simulation scenarios used in simulating orthogonal and oblique factor model based on the number of factors and sample size.
Number of factors (f) Sample size (n)
50 3 100 200 50 6 100 200 50 9 100 200
Given the number of factors, the number of variables was fixed at p= 18 so that all cases were evaluated satisfying the condition (p - f) 2 ≥ p + f
given by Peña (2003), which relates number of variables (p) to number of factors (f). Based on both correlation matrix structure (14) and described parameters (Table 1), it was possible to deduce sample covariance matrix ∑. Thus, multivariate samples with outliers were generated in contaminated multivariate normal distribution, and outlier percentage was specified in multivariate t-distribution by mixing probability δ, proportions 0.05, 0.10 and 0.15. Thus, the multidimensional random variable G was generated according to equation (15),
n×p p p p k p p
G =δN 0, 1-δ t , 5 (15)
where:
ν is the number of degrees of freedom in the Student’s t-distribution.
Given the rotation criteria of interest to our study, i.e. Chisquaremax and Promax, and the amount of outliers in the generated sample, goodness-of-fit was evaluated in both models using the root mean square residual measure (RMSR in our study) suggested by Sharma (1996), following equation (16).
p n 2 ij ij i=1 j=1 ˆ σ σ RMSRp(p-1) / 2
(16)where:
the factorial model. As proposed by Jhun and Choi (2009) were also calculated, in each scenario, the relative efficiency RE of the estimator of matrix ∑ given by ˆ LLˆ ˆt , Lˆ being the vector of factor
loadings, Ψ the matrix of variances, ˆ the covariance matrix adjusted by the factor model and
the sample covariance matrix.
1 p
ˆ ER ,
ˆ
(17)
The two measures were submitted to both original and rescaled data by a transformation of variables considering the ratio between each sample observation subtracted from the median of each variable and the median absolute deviation. For further details, see Filzmoser et al. (2008).
All calculations and simulations proposed in this study were perfomed using the Software R (R DEVELOPMENT CORE TEAM, 2009). A program was developed based on the method and 3000 Monte Carlo simulations were performed to generate empirical distributions of measures (16) and (17), incorporating the function that estimates the factor loadings using chisquaremax available in Knüsel (2008). Then the values expected for each measure were analyzed and the results interpreted.
Results and discussion
In line with the study objectives, our results matched the expected values of goodness of fit index defined in (16) by RMSR in all 3000 Monte Carlo simulations in the mentioned scenarios (Table 1). Thus, the results described in Table 2 show that, when considering original data in the scenario of low correlation between variables (ρ = 0.2) with Chisquaremax criterion, goodness-of-fit decreases with increasing proportion of outliers in the sample, represented by δ. However, given the increasing number of factors (f) and sample size (n) this deleterious effect on RMSR index decreased to values closer to zero, which was considered as a criterion for high goodness-of-fit results.
When using Promax criterion we found that in all scenarios the expected values of RMSR index were higher than the ones obtained with Chisquaremax criterion. When using rescaling procedure, however, goodness-of-fit results were
more promising since the values were closer to zero with Chisquaremax. Thus, reproduction of sample covariance matrix through factorial model is more accurate with Chisquaremax than with Promax.
Table 2. Mean values of Root Mean Square Residual, obtained through simulation recital number of factors (f) and factorial model obtained with the criteria Chisquaremax and Promax rotation.
ρ = 0.2 Original data
Chisquaremax Criterion Promax Criterion
n δ f f
3 6 9 3 6 9
50
0.05 0.1033 0.0819 0.0664 0.1724 0.1806 0.1943 0.10 0.1207 0.1055 0.0961 0.1826 0.1898 0.2013 0.15 0.1375 0.1230 0.1180 0.1935 0.1981 0.2078
100
0.05 0.0754 0.0614 0.0532 0.1606 0.1742 0.1860 0.10 0.0892 0.0805 0.0755 0.1703 0.1795 0.1908 0.15 0.1034 0.0951 0.0919 0.1774 0.1863 0.1949
200
0.05 0.0567 0.0475 0.0415 0.1534 0.1702 0.1815 0.10 0.0682 0.0633 0.0627 0.1608 0.1748 0.1856 0.15 0.0766 0.0738 0.0735 0.1660 0.1786 0.1892
Rescaled data
Chisquaremax Criterion Promax Criterion
n δ f f
3 6 9 3 6 9
50
0.05 0.0776 0.0479 0.0255 0.1537 0.1697 0.1884 0.10 0.0775 0.0474 0.0251 0.1498 0.1685 0.1905 0.15 0.0776 0.0473 0.0250 0.1458 0.1679 0.1906
100
0.05 0.0565 0.0352 0.0187 0.1460 0.1660 0.1816 0.10 0.0567 0.0350 0.0185 0.1445 0.1664 0.1816 0.15 0.0576 0.0351 0.0185 0.1412 0.1625 0.1803
200
0.05 0.0408 0.0256 0.0134 0.1414 0.1635 0.1775 0.10 0.0416 0.0259 0.0136 0.1404 0.1612 0.1779 0.15 0.0428 0.0262 0.0136 0.1381 0.1587 0.1774
Since degree of correlation between variables increased, when assuming ρ = 0.8 the expected values for RMSR described in Table 3 decreased when compared to the previous situation (Table 2) with Chisquaremax in both original and rescaled data. Promax criterion, however, provided more discrepant results with much higher values than the null value. Thus, Promax may provide important results, e.g. factor loadings and specific variances, which are subject to errors involving reproduction of sample covariance matrix. This statement agrees with the review by Treiblmaier and Filzmoser (2010), which show subtle differences in rotation criteria that corroborate the researcher’s choice of criterion. The authors note that depending on the chosen procedure, complexity of matrix factors, interpretation of correlations between factors and factor loadings can vary substantially in the presence of outliers or due to data heterogeneity.
structure, since orthogonal rotations assume that extracted factors are independent of one another, i.e. they are not inter-correlated. In addition, oblique rotations allow factor correlation, thus implying that communalities depend not only on factor loadings but also on covariances of the common factor vector (FERREIRA, 2008). Oblique rotation is desirable in many practical situations, as it allows extraction of factors that reveal groups of inter-correlated variables.
Table 3. Mean values of Root Mean Square Residual obtained through simulation recital number of factors (f), and factorial model obtained with the criteria Chisquaremax and Promax rotation.
ρ = 0.8 Original data
Chisquaremax Criterion Promax Criterion
n δ f f
3 6 9 3 6 9
50
0.05 0.0307 0.0259 0.0232 0.4847 0.6172 0.6788 0.10 0.0392 0.0364 0.0350 0.4864 0.6148 0.6730 0.15 0.0478 0.0444 0.0432 0.4893 0.6129 0.6722
100
0.05 0.0231 0.0212 0.0189 0.4727 0.6050 0.6749 0.10 0.0303 0.0281 0.0273 0.4774 0.6053 0.6706 0.15 0.0359 0.0348 0.0342 0.4822 0.6029 0.6670
200
0.05 0.0180 0.0157 0.0152 0.4683 0.5898 0.6572 0.10 0.0230 0.0218 0.0203 0.4746 0.5906 0.6573 0.15 0.0268 0.0272 0.0244 0.4776 0.5909 0.6546
Rescaled data
Chisquaremax Criterion Promax Criterion
n δ f f
3 6 9 3 6 9
50
0.05 0.0196 0.0121 0.0065 0.4832 0.6164 0.6776 0.10 0.0197 0.0120 0.0063 0.4829 0.6121 0.6711 0.15 0.0199 0.0120 0.0063 0.4823 0.6071 0.6683
100
0.05 0.0142 0.0089 0.0047 0.4713 0.6036 0.6740 0.10 0.0144 0.0089 0.0047 0.4734 0.6023 0.6678 0.15 0.0148 0.0089 0.0047 0.4758 0.5981 0.6630
200
0.05 0.0103 0.0064 0.0034 0.4670 0.5886 0.6564 0.10 0.0105 0.0065 0.0034 0.4712 0.5880 0.6563 0.15 0.0109 0.0066 0.0036 0.4720 0.5856 0.6510
Sass and Schmitt (2010) state that researchers often arbitrarily select either an oblique or orthogonal rotation criterion, mostly choosing Varimax because it is the most cited in the literature. Regarding criterion choice, the results of our study show that using RSMR help researchers make better decisions with rescaled data, as simulation studies showed that RSMR favors obtention of residues near the null value, thus indicating high goodness-of-fit.
In terms of nature of outlier observations related to degree of symmetry, Liu and Zumbo (2012) found that outliers generated by symmetrical distribution did not affect correlation matrix estimate. Thus, we argued whether outlier impact would affect efficiency of estimators of the covariance matrix produced by the factorial model
in relation to the sample covariance matrix estimator. When maintaining a low correlation (ρ = 0.2) between variables, Chisquaremax criterion presented a quadratic trend regarding the effect of sample size.
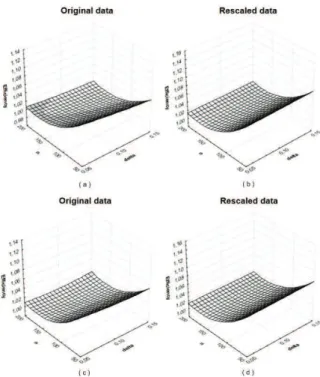
As outlier proportion increased, efficiency showed constant effect. This characteristic was observed in both original (Figure 1a) and rescaled data (Figure 1b). Similarly, we found the same behavior when considering degree of correlation between variables ρ = 0.8, referring respectively to original data (Figure 1c) and rescaled data (Figure 1d). Therefore, the efficiency of covariance matrix estimator for Chisquaremax is robust to the effects of outliers regardless of whether variables have low or high correlation.
Figure 1. Mean values of Relative Efficiency of estimator obtained through the orthogonal factor model considering the criterion of rotation Chisquaremax and different sample sizes (n); likelihood mixture (δ) in correlation ρ = 0.2 (a and b) and ρ = 0.8 (c and d).
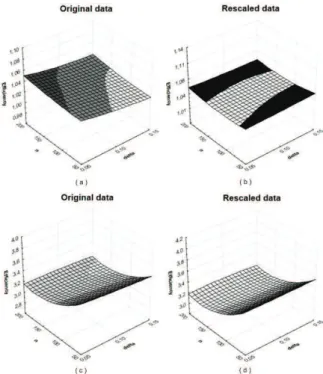
Chisquaremax for both original (Figure 2c) and rescaled data (Figure 2d).
According to the results, it is important to emphasize that a priori knowledge of the researcher about the nature of the study is a key factor for selecting the rotation criterion. This statement can be exemplified by Costello and Osborne (2005) who reported that, despite the widespread use of orthogonal criteria, especially Varimax, its results in psychology research tend to be inconsistent.
Figure 2. Mean values of Relative Efficiency of estimator obtained through factorial design considering the oblique Promax rotation criterion and different sample sizes (n); likelihood mixture (δ) in correlation ρ = 0.2 (a and b) and ρ = 0.8 (c and d).
Conclusion
According to the simulated scenarios we concluded that:
The efficiency of covariance matrix estimator provided by the factorial model using either Chisquaremax or Promax criteria was not affected by the presence of outliers;
The orthogonal factor model using Chisquaremax criterion showed better goodness-of-fit than the results obtained with Promax criterion;
Rescaling procedure was adequate for quality improvement of the factorial model in both rotation criteria analyzed in the study.
In future work we intend to apply the chisquaremax criterion in the analysis of multivariate data through exploratory factor analysis. In the case of a
methodological research, there is interest in developing other criteria of rotation based on the statistics used in the analysis of categorical data.
References
COSTELLO, A. B.; OSBORNE, J. W. Best practices in exploratory factor analysis: Four recommendations for getting the most from your analysis. Practical Assessment, Research and Evaluation, v. 7, n. 10, p. 1-9, 2005.
CRAMÉRM, H. Mathematical methods of statistics. 9th ed. [S.l.]: Princeton University Press, 1961.
CUDECK, R.; O’DELL, L. L. Applications of standard error estimates in unrestricted factor analysis: Significance tests for factor loadings and correlations. Psychological Bulletin, v. 115, n. 3, p. 475-487, 1994.
FERREIRA, D. Estatística multivariada. Lavras: UFLA, 2008.
FILZMOSER, P.; MARONNA, R.; WERNER, M. Outlier identification in high dimensions. Computational Statistics and Data Analysis, v. 52, n. 3, p. 1694-1711, 2008.
HENSON, R. K.; ROBERTS, J. K. Use of exploratory factor analysis in published research: Common errors and some comment on improved practice. Educational and Psychological Measurement, v. 66, n. 3, p. 393-416, 2006.
JHUN, M.; CHOI, I. Bootstrapping least distance estimator in the multivariate regression model.
Computational Statistics and Data Analysis, v. 53, n. 12, p. 4221-4227, 2009.
KNÜSEL, L. Chisquare as a rotation criterion in factor analysis. Computational Statistics and Data Analysis, v. 52, n. 9, p. 4243-4252, 2008.
LIU, Y.; ZUMBO, B. D. The impact of outliers on Cronbach’s coefficient alpha estimate of reliability: Visual analogue scales. Educational and Psychological Measurement, v. 67, n. 4, p. 620-634, 2007.
LIU, Y.; ZUMBO, B. D. Impact of outliers arising from unintended and unknowingly included subpopulations on the decisions about the number of factors in exploratory factor analysis. Educational and Psychological Measurement, v. 72, n. 3, p. 388-414, 2012.
PEÑA, D. Análisis de datos multivariantes. Madrid: Mc-Graw Hill, 2003.
R DEVELOPMENT CORE TEAM. R: a language and environment for statistical computing. Viena: R Development Core Team, 2009.
SASS, D. A.; SCHMITT, T. A. A Comparative investigation of rotation criteria within exploratory factor analysis.
Multivariate Behavioral Research, v. 45, n. 1, p. 37-41, 2010.
SHARMA, S. Applied multivaiate techniques. New York: John Wiley and Sons, 1996.
TREIBLMAIER, H.; FILZMOSER, P. Exploratory factor analysis revisited: How robust methods support the detection of hidden multivariate data structures in IS research. Information and Management, v. 47, n. 4, p. 197-207, 2010.
Received on February 22, 2013. Accepted on February 24, 2014.