Published online 23 June 2008 in Wiley InterScience (www.interscience.wiley.com) DOI: 10.1002/jrs.2043
Disorder-induced symmetry lowering
in Ba(Y
1/2
Nb
1/2
)O
3
ceramics probed
by Raman spectroscopy
Anderson Dias,
1∗Rodrigo G. S ´a
2and Roberto L. Moreira
31Departamento de Qu´ımica, UFOP, Ouro Preto-MG, 35400-000, Brazil 2DEMET, UFMG, Belo Horizonte-MG, 30160-030, Brazil
3Departamento de F´ısica, UFMG, C.P. 702, Belo Horizonte-MG, 30123-970, Brazil
Received 23 February 2008; Accepted 15 May 2008
This work investigates the evolution of the crystal structure of microwave-hydrothermal synthesized Ba(Y1/2Nb1/2)O3 powders as a function of firing temperature by Raman spectroscopy. The samples were
produced at 200°C and fired at temperatures ranging from 600 to 1600°C. Raman spectra were obtained
at room temperature for all samples and the results showed that materials fired at 1600°C exhibited
tetragonal (I4/m orC5
4h) structure, whereas those fired at lower temperatures exhibited the triclinic (P1
orC1
i) structure. The results were compared with those observed for ceramics obtained by conventional solid-state methods. It is believed that the lowering of the symmetry verified in materials fired below 1600°C is a consequence of the local disorder of Y+3and Nb+5ions in octahedral sites. Copyright2008
John Wiley & Sons, Ltd.
KEYWORDS:microwave-hydrothermal; Raman spectroscopy; ceramics; microwave dielectrics; rare earth; triclinic
INTRODUCTION
Mobile phones are dominating the telecommunication mar-kets around the world. These devices are associated with base stations that connect cell to cell via antennas. Each base sta-tion contains hundreds of microwave resonators employed to carry signals and filter spurious signals and sidebands.1For
high-selectivity applications (narrow bandwidth), ceramic materials such as Ba⊲RE1/2Nb1/2⊳O3 (RE D rare-earth
ele-ments, In or Y) complex perovskites can be used as dielectric resonators. These compounds have been studied in the past by many research groups in attempts to understand their crystal structure as a function of chemical substitu-tion, which is intimately related to their performance in service. Only very recently conclusive results on this subject were achieved by using X-ray diffraction (XRD) as well as Raman and Fourier-transform infrared spectroscopies.2 In
this respect, the polar optical phonons determine the high-frequency dielectric response, which in turn depends on the sample structure (intrinsic contributions) together with extrinsic contributions coming from space charges, domain walls and imperfections linked to the sample morphology.2 – 5
ŁCorrespondence to: Anderson Dias, Departamento de Qu´ımica, ICEB II, Sala 67, UFOP, Ouro Preto-MG, 35400-000, Brazil. E-mail: anderson [email protected]
Thus, these ceramic materials are very sensitive to the pro-cessing conditions (powder synthesis and sintering), which affect directly the three key properties for applications as dielectric resonators: permittivity, temperature coefficient of the resonant frequency, and dielectric loss.
There is increasing interest in evaluating new methods for the synthesis of microwave materials.6Hydrothermal
meth-ods present the highest technological potential to prepare materials in environmentally friendly conditions, producing ultrafine, crystalline powders in a single step.3 – 8In previous
works, Dias et al.4,5 showed that Ba⊲Mg
1/3Nb2/3⊳O3
com-plex perovskites with different long-range order parameters (critical for minimum dielectric losses) could be obtained by heating the samples at increasing temperatures, starting from the hydrothermal powders produced under mild tempera-tures. For these samples, the Raman spectra did not show any structural change, but exhibited an increasing degree of ordering through the narrowing of the phonon modes for increasing heating temperatures. For Ba⊲RE1/2Nb1/2⊳O3
A previous work in Ba⊲Y1/2Nb1/2⊳O3 ceramics, which
is a member of the Ba⊲RE1/2Nb1/2⊳O3 family, showed that
the fully ordered ceramic produced by conventional solid-state route exhibits a tetragonal structure.2 This conclusive
result was possible only through the comparative analysis between XRD and Raman scattering. Although the structure of fully ordered samples is well established, no information regarding the structure of Ba⊲Y1/2Nb1/2⊳O3 ceramics from
powders obtained at mild temperatures is available. Also, the heating effects on the crystal structure from lower temperatures up to the sintering temperatures frequently employed in conventional routes are unknown. In view of that, this work expands the previous one (Ref. 2) by studying Ba⊲Y1/2Nb1/2⊳O3 ceramics, henceforth BYN,
synthesized through the microwave-hydrothermal method and fired at different temperatures. The goal is to investigate the structural evolution by XRD and Raman spectroscopy, besides group theory tools, and therefore to contribute to a better understanding of the crystalline structure of BYN as a function of heating temperature.
EXPERIMENTAL
BaCl2Ð2H2O (> 99.9%, Fluka-Switzerland), YCl3Ð6H2O
(>99.9%, Fluka-Switzerland) and NH4H2⊲NbO⊲C2O4⊳3⊳Ð
3H2O (>99%, CBMM-Brazil) were used as the starting
materials. The salts were dissolved separately in deionized water (18.2 Mcm) and mixed in stoichiometric proportions. The niobium ammonium oxalate was previously treated with a NaOH solution maintained at pH>13 and washed. After mixing, precipitation occurred and the pH was controlled and adjusted to 13.5. Microwave-hydrothermal syntheses were performed using a Milestone MLS-1200 MEGA microwave digestion system (100 mL teflon-lined flasks, 2.45 GHz).3 The syntheses occurred at 200°C in 2 h,
and the resulting powders were repeatedly washed with deionized water and dried at 80°C. The materials were fired
in air (conventional furnace) at temperatures ranging from 600 to 1600°C, for 2 h.
XRD analyses were carried out in a Philips PW1710 diffractometer with graphite-monochromated Cu K˛ radia-tion (40 kV, 30 mA, Ni filtered) in the 15–100°2range (0.01°
2step size and 5 s/step). A scanning electron microscope (SEM-JEOL 5410) was employed to study the morphological features of the BYN powders after processing. Micro-Raman scattering spectra were collected at room temperature using a triple-monochromator Dilor XY spectrometer, equipped with a liquid-N2-cooled charge-coupled-device detector and
an Olympus microscope (100ðobjective). The measurements were carried out in the backscattering geometry using the 415.6, 488 or 632.8 nm lines of an argon-krypton ion or a helium–neon laser as excitation sources. The accumulation times were typically 10 collections of 20 s and the spectral res-olution was better than 2 cm1. Better results were obtained
for the helium–neon laser line.
RESULTS AND DISCUSSION
Crystalline, single-phase BYN perovskite powders were pro-duced after microwave-hydrothermal processing at 200°C
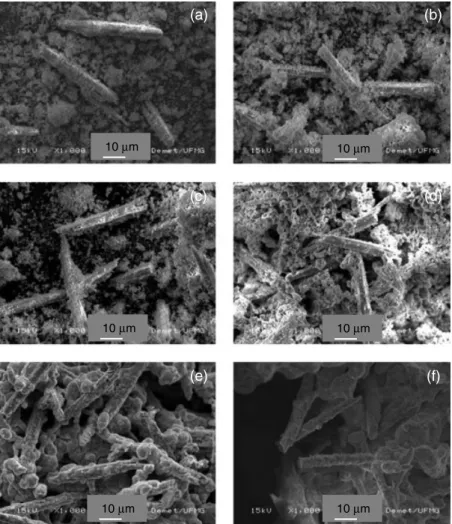
(ICDD card # 24–1042). Figure 1 shows the morphological features of the microwave-hydrothermal-processed samples as obtained (Fig. 1(a)), and after firing at 600, 800, 1000, 1200 and 1400°C (Fig. 1(b) to (f)). Large, needle-shaped (ca
50µm long) and very fragile (under manipulation) materi-als were produced, as previously reported for the complex Ba⊲Mg1/3Nb2/3⊳O3ceramics.3Fig. 1 also shows that the
solid-state sintering starts above 1000°C (Fig. 1(d–f)), with the
presence of solid contacts (bridges) between the needles. Figure 2 presents the results from the XRD analysis for the materials fired at different temperatures (800, 1000, 1200 and 1600°C). As can be seen, the ceramics remain in single phase
after firing without any secondary phases or impurities. All materials were indexed as cubic (ICDD 24–1042), although some faint peaks could be interpreted as indication of a lower symmetry, particularly the tetragonal phase I4/m.2
The inset in Fig. 2 shows in detail the superstructure (111) peak, observed only in the sample fired at 1600°C, which
indicates that this sample presents a fully ordered B-site arrangement.9,10
Despite this particular (111) peak, no additional infor-mation could be obtained from the diffractograms shown in Fig. 2. Thus, it was concluded that XRD analysis was not able to distinguish any significant difference between the structures of our fired samples. Barneset al.9 studied BYN
ceramics by neutron diffraction and XRD techniques and obtained ‘nearly equivalent’ goodness-of-fit parameters for both cubic (Fm3m) and tetragonal (I4/m) structures. Studying similar samples by Raman spectroscopy, Diaset al.2showed
that a tetragonal (I4/m, C5
4h) structure is compatible with
the observed phonon modes for samples sintered at high temperatures. For BYN materials, the tolerance factor can be determined by:
tD p RBaCRO
2
RYCRNb
2
CRO
⊲1⊳
whereRBa,RY,RNb andROare the ionic radii of Ba, Y, Nb
and O ions, respectively. A tolerance factor of 0.986 was calculated, which means that the NbO6 and YO6 octahedra
are slightly tilted and Ba ions (located in the A-site) have enough space for vibrations. On the basis of previous results in Ba⊲Mg1/3Nb2/3⊳O3 ceramics,4 it is believed that the BYN
samples fired at temperatures below 1600°C could present a
(a)
10 µm
(b)
10 µm
(c)
10 µm
(d)
10 µm
(e)
10 µm
(f)
10 µm
Figure 1.SEM photographs for the powders after microwave-hydrothermal processing (a) and fired at (b) 600°C; (c) 800°C;
(d) 1000°C; (e) 1200°C; and (f) 1400°C.
factors, the vibrational spectra are affected not only by the distribution of the atomic species but also by the different atomic interactions.
As mentioned above, BYN ceramics were described as belonging to theC5
4h(I4/m) group, with four motifs per unit
cell (ZD4) but only two for the primitive one (ZpD2). In this
structure, Ba atoms occupy 4dsites (S4symmetry), Y and Nb
ions occupy respectively 2a and 2b sites (C4h symmetry),
and the oxygen atoms are in 8h (Cs symmetry) and 4e
(C4 symmetry) sites. Then, using the site group method
of Rousseau et al.11 it is possible to obtain the following
distribution of the phonon modes at the Brillouin zone center in the irreducible representations of theC4hpoint group:
D3AgC5AuC3BgCBuC3EgC6Eu ⊲2⊳
Excluding the acoustic (AuCEu) and silent (Bu) modes,
18 optical vibrational modes remain, 9 being Raman active (3AgC3BgC3Eg) and 9 infrared active (4AuC5Eu). While
the Raman-active modes are only due to vibrations of Ba and O atoms (Ag,BgandEg), the infrared active phonons include
the vibrations of ions in the B-sites (YC3 and NbC5
ions for
Au and Eu vibrational modes).2,4,5 However, for complex
perovskites with 1 : 1 ordering, infrared measurements fail to study crystal structures because of the proximity of transverse and longitudinal phonons, which makes difficult the identification and assignment of the modes.2
Micro-Raman spectroscopic investigations were carried out in samples fired in temperatures ranging from 600 to 1600°C. Figure 3 presents the spectra for the microwave
ceramics fired at (a) 800, (b) 1000, (c) 1200 and (d) 1600°C.
For the samples fired at 1600°C (Fig. 3(d)), nine bands are
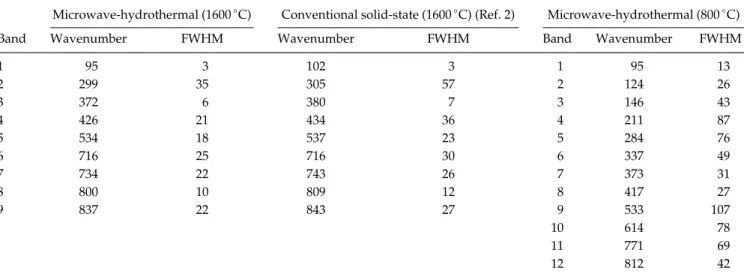
clearly identified, in good agreement with conventional solid-state-reacted BYN materials presented in a previous work.2The fitting parameters, wavenumbers and full-width
at half maxima (FWHM) are given in Table 1. We noticed that our microwave-hydrothermal BYN presents narrower Raman bands (about 30%) than the sample produced by conventional routes (Ref. 2), also displayed in Table 1 for comparison (both materials were fired at 1600°C). This
10 20 30 40 50 60 70 80 90 100 800°C
2 Theta (°) 1200°C
1000°C
Intensity
1600°C
17.0 17.5 18.0 18.5 19.0
(111) 1600°C
Figure 2.XRD for the samples produced by
microwave-hydrothermal processing and fired at (a) 800°C;
(b) 1000°C; (c) 1200°C; and (d) 1600°C.
applications, this is an interesting result, since narrower phonon modes would indicate larger quality factors for the
150 300 450 600 750 900
8
9 7 6 5 4 3
2 1
(d)
(c)
(b)
(a)
Raman Intensity
Wavenumber (cm-1)
Figure 3.Raman spectra for the BYN ceramics fired at (a) 800°C; (b) 1000°C; (c) 1200°C; and (d) 1600°C. Numbers
indicate the bands observed for the sample fired at 1600°C.
hydrothermal BYN, as previously discussed by our research group in recent publications.2,4,5,12It was observed that BYN
samples fired at lower temperatures exhibited a higher number of broader phonon modes, which could be due to lattice distortions indicating lower-symmetry structures. Thus, for samples fired at temperatures lower than 1600°C,
Table 1. Raman fitting parameters (in cm1) for the BYN ceramics fired at 1600 and 800°C. The numbers correspond to those
shown in Figs 3 and 4
Microwave-hydrothermal (1600°C) Conventional solid-state (1600°C) (Ref. 2) Microwave-hydrothermal (800°C)
Band Wavenumber FWHM Wavenumber FWHM Band Wavenumber FWHM
1 95 3 102 3 1 95 13
2 299 35 305 57 2 124 26
3 372 6 380 7 3 146 43
4 426 21 434 36 4 211 87
5 534 18 537 23 5 284 76
6 716 25 716 30 6 337 49
7 734 22 743 26 7 373 31
8 800 10 809 12 8 417 27
9 837 22 843 27 9 533 107
10 614 78
11 771 69
a careful analysis was conducted to examine the possible origins for the observed behavior.
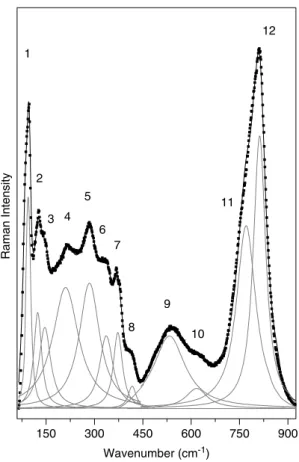
Figure 4 shows the Raman spectrum of the BYN ceramic fired at 800°C fitted by using Lorentzian lines. Broad bands
can be visualized, in a larger number than expected for BYN materials with tetragonal structure (in fact, 12 bands were identified in Fig. 4). The fitting parameters (wavenumbers and FWHM) are also shown in Table 1. Comparing the bands identified in Fig. 4 for the sample fired at 800°C with
those for ceramics fired at 1600°C (Fig. 3), one can observe
that the peaks are weakened and broadened. Besides the nine predicted modes for tetragonal BYN ceramics, samples fired below 1600°C present three additional bands. These
bands could originate from local symmetry breaking or from the activation of infrared or silent modes due to the B-site disorder.7,12The last hypothesis was investigated by
accessing the additional material published in Ref. 2. Infrared modes (TO/LO branches) appear around 117/138, 215/285, 317/398 and 528/713 cm1. These wavenumbers, valid for
the solid-state sample studied in Ref. 2, do not match with those presented in Table 1 (microwave-hydrothermal BYN fired at 800°C, last column), showing that the infrared modes
were not activated in our BYN samples fired below 1600°C.
The intensities and wavenumbers of all modes varied with the sintering temperature, indicating that the Raman
150 300 450 600 750 900
12
11
10 9
8 7 6 5
4 3 2 1
Raman Intensity
Wavenumber (cm-1)
Figure 4.Raman spectroscopic data (squares) for the sample fired at 800°C. Fitting (black line) was carried out by a sum of
Lorentzian lines (gray lines).
spectra are sensitive to the changes produced by the annealing of the samples. Therefore, the hypothesis of a structural change at lower firing temperatures was investigated by Raman spectroscopy. The data obtained for the sample fired at 800°C (Fig. 4) was studied in detail at
the light of the group-theory approach. For this sample, our assumption is that a distorted, tilted perovskite with lower symmetry than the tetragonal structure occurs. It is well known that perovskites of the A2BB0O6-type present 1 : 1
B-site cation ordering and, in the absence of octahedral tilting, belongs to the parentFm3m space-group symmetry.13 For
these materials, it has been shown by group-theory methods that 11 different structures are possible as a consequence of lowering the symmetry by octahedral tilting.13The possible
group-subgroup relationships were obtained and are used in the present work to describe the phase transformation in the Ba2YNbO6 system. Starting from the space group Fm3m (cubic, untilted), the derived subgroups by loss of symmetry elements (due to possible octahedral tiltings) are
Pn3,P42/nnm,P4/mnc,I4/m,C2/mandR3.11Among the six
subgroups listed above, only the tetragonal space groupI4/m
describes the BYN ceramics fired at 1600°C, as previously
discussed here and in Ref. 2.
The space group I4/m (a0a0c) in turn is correlated
(by group-subgroup relationships) with the subgroups
P42/n (C44h, tetragonal), C2/c (C62h, monoclinic) andP1 (C1i,
triclinic).13 The first subgroup includes two additional
in-phase tilting (aCaCc), while the third subgroup presents
two additional anti-phase tilting (abc). On the other
hand, the subgroupC2/c presents only one additional in-phase distortion (a0bCc). Lufaso et al.14 showed that the
structuresC2/candP42/nhold only when multiple cations
are present in A-site, which does not apply for our BYN ceramics. Moreover, by using the site group method of Rousseauet al.11one would expect a total of 24 Raman-active
bands for the monoclinicC2/cstructure, and 35 bands for the tetragonalP42/n space group, which are much higher
than the 12 observed bands for our materials. These results demonstrated that bothP42/n andC2/c structures are not
compatible with our system.
Again, Lufaso et al.14 showed that the space group P1
(withZD2) is possible for a single A-site cation. Besides, the results of Howardet al.13for a group-subgroup relationship
between tetragonal and triclinic structures lead us to consider this possibility for a lower-symmetry structure for BYN ceramics fired below 1600°C. For a factor-group analysis, the
atomic positions must be considered and Wyckoff symbols for BYN materials in the triclinic group would be as follows: the Ba atoms should occupy three 4i sites of general C1
symmetry, Y and Nb ions would sit on 2aand 2gpositions (Ci symmetry), and the oxygen atoms would be in three 4i
sites (C1 symmetry). Then, using the site-group method of
Rousseau et al.11 it is possible to obtain the Raman active
phonon modes at the Brillouin zone center for this C1
i
for this group). As can be visualized in Fig. 4, the spectrum for the BYN samples fired at 800°C was fitted with 12
Lorentzian lines, in perfect agreement with the present assumption.
Ayala et al.15 and Oliveira et al.16 studied different
pyrochlores (CsInMgF6 and NaCaMg2F7) by spectroscopic
techniques. For these materials, a large number of vibrational bands were observed, which could not be explained by factor-group analyses for the cubic structures determined by single-crystal XRD. For both fluorides, a disorder-induced symmetry lowering was responsible for the observed phonon mode behaviors. In a deeper analysis, the symmetry lowering mechanism in the pyrochlore family originates from the loss of the equivalence of neighboring polyhedra in the disordered network. In the present work, a similar situation holds for samples fired at temperatures below 1600°C. On
the basis of our XRD results, we can assume that partially disordered BYN ceramics are formed at lower temperatures (no superlattice reflections were observed in samples fired below 1600°C). If some B-cation disorder occurs, it is
important to analyze the first-neighbor coordination of the atomic species in order to understand the effect of the disorder on the BO6 octahedra and on the local
symmetry. Indeed, oxygen atoms always surround YC3
and NbC5 ions and their coordination octahedra are not affected by B-site occupational disorder. However, the first neighbors of the oxygen atoms are always the partially disordered YC3and NbC5 ions. As a consequence, disorder-induced symmetry breakdown results only from these sites.
As explained above for a tetragonal I4/m structure, oxygen anions are located at sites withC4andCssymmetries,
while Ba atoms present the S4 symmetry. Any disorder
in the B-sites leads to a complete loss of the symmetry elements, which reduces their symmetries toC1(or absence
of symmetry). The loss of symmetry elements of Ba and O ions is, of course, accompanied by small displacements of these ions from their original atomic positions and, then, to additional octahedral tiltings. Therefore, although the first neighbors of NbC5 and YC3 maintain the local inversion symmetry, theC4 symmetry element of their sites is lost by
the octahedral tiltings. It is worth noticing thatC4h groups
are formed by the tensorial product ofC4andCi groups.17
The disorder-induced loss of theC4 element by the ions of
BYN would then lead the system to the lower symmetry groupCi, in agreement with the Raman features discussed
above. Therefore, we conclude that BYN ceramics fired at low temperatures present a highly distorted structure, as a result of stresses due to B-site disorder. These stresses destroy the symmetry elementC4observed in the tetragonal I4/m phase. The remaining symmetry element (Ci) agrees
well with the spectra observed towards aP1 space group. The more symmetric tetragonal phase will be achieved only by increasing the order of the material by heating it at very high temperatures.
CONCLUSIONS
Raman spectroscopy was employed to study the optical phonons of BYN ceramics as a function of the firing temperature. The samples were produced by microwave-hydrothermal method at 200°C and fired at temperatures
from 600 to 1600°C. XRD showed that all samples are
cubic or nearly cubic in symmetry, while Raman spectra indicated that a structural change occurred in ceramics fired in temperatures below 1600°C. Lower-symmetry structures
were investigated in the light of the group theory analysis. Ceramics obtained at 1600°C showed nine Raman active
bands, in perfect agreement with theoretical predictions and previous works for a tetragonal (I4/m) structure. The results indicate that Raman spectra are sensitive to the variations produced by the annealing of the samples. Materials fired below 1600°C exhibit rather a structure belonging to theP1
space group, with 12 Raman active bands. It is believed that the local disorder verified in ceramics fired at temperatures lower than 1600°C suppresses theC4 symmetry operation
and transforms theI4/mgroup into itsP1 subgroup. Group theory analysis based on thisP1 subgroup gives the correct number of observed vibrational bands observed through Raman spectroscopy.
Acknowledgements
The authors acknowledge the financial support from MCT/CNPq, FINEP and FAPEMIG. Special thanks are due to Prof. M. A. Pimenta (UFMG) for his hospitality during Raman experiments.
REFERENCES
1. Reaney IM, Iddles D.J. Am. Ceram. Soc.2006;89: 2063.
2. Dias A, Khalam LA, Sebastian MT, Paschoal CWA, Moreira RL. Chem. Mater.2006;18: 214.
3. Dias A, Ciminelli VST.Chem. Mater.2003;15: 1344.
4. Moreira RL, Matinaga FM, Dias A.Appl. Phys. Lett.2001;78: 428. 5. Dias A, Bijumon PV, Sebastian MT, Moreira RL.J. Appl. Phys.
2003;94: 3414.
6. Byrappa K, Yoshimura M.Handbook of Hydrothermal Technology. William Andrew Publishing: New York, 2001.
7. Rabenau A.Angew. Chem. Int. Ed.1985;24: 1026. 8. Adam D.Nature2003;421: 571.
9. Barnes PW, Lufaso MW, Woodward PM.Acta Crystallogr.2006;
B62: 384.
10. Molodetsky I, Davies PK.J. Eur. Ceram. Soc.2001;21: 2587. 11. Rousseau DL, Bauman RP, Porto SPS.J. Raman Spectrosc.1981;
10: 253.
12. Dias A, Ciminelli VST, Matinaga FM, Moreira RL.J. Eur. Ceram. Soc.2001;21: 2739.
13. Howard CJ, Kennedy BJ, Woodward PM.Acta Crystallogr.2003;
B59: 463.
14. Lufaso MW, Barnes PW, Woodward PM.Acta Crystallogr.2006;
B62: 397.
15. Ayala AP, Paschoal CWA, Guedes I, Paraguassu W, Freire PTC, Mendes Filho J, Moreira RL, Gesland J-Y.Phys. Rev.2002;B66: 214105.
16. Oliveira EA, Guedes I, Ayala AP, Gesland J-Y, Ellena J, Moreira RL, Grimsditch M.J. Solid State Chem.2004;177: 2943. 17. Tinkham M.Group Theory and Quantum Mechanics. McGraw-Hill: