Letter to the Editors
Eect of grain-boundaries on uranium and oxygen diusion in
polycrystalline UO
2
A.C.S. Sabioni
a,*, W.B. Ferraz
b, F. Millot
c aUniversidade Federal de Ouro Preto, Departamento de Fõsica/ICEB, 35400-000 Ouro Preto, MG, Brazil
bCentro de Desenvolvimento da Tecnologia Nuclear, CDTN/CNEN, 30161-970 Belo Horizonte, MG, Brazil cCentre de Recherches sur les Mat
eriauxaHaute Temperatures/CNRS, 47071 Orleans, France
Received 24 June 1999; accepted 1 October 1999
Abstract
The in¯uence of grain-boundaries on uranium and oxygen diusion in polycrystalline UO2 has been investigated.
Our results show that between 1498°C and 1697°C, in H2 atmosphere, uranium diusion in UO2 grain-boundaries is
about ®ve orders of magnitude greater than uranium volume diusion, in the same experimental conditions. Between 605°C and 750°C, in H2/N2/H2O atmosphere, the oxygen diusion coecients measured in polycrystalline and single
crystalline UO2are similar, and correspond to the volume diusion. Ó 2000 Elsevier Science B.V. All rights reserved.
1. Introduction
Uranium-dioxide is a material of great technological interest due to its utilization as nuclear fuel in power reactors. Uranium and oxygen diusion have been ex-tensively studied in this material due to their importance for the nuclear fuel fabrication and in-pile performance analysis. Uranium is the slowest mobile atomic specimen, and its diusion controls the kinetics of processes such as sintering, creep, grain growth, in-pile densi®cation among others. The knowledge of oxygen diusion, which diuses faster than uranium, is important, principally, in nuclear fuel oxidation and reduction processes.
Most previous works on uranium diusion in UO2
dealt with the determination of volume diusion coe-cients in single crystalline and polycrystalline samples, and, in general, the results show poor agreement. These results have been reviewed in Refs. [1±3].
There are only two works [4,5] concerned with ura-nium diusion in nearly stoichiometric UO2
grain-boundaries and, even so, their results are questionable as shown by Matzke in Ref. [6]. Therefore more
grain-boundary diusion experiments must be performed to provide reliable data for uranium diusion in UO2
grain-boundaries.
Recently, Sabioni et al. [3] measured uranium volume diusion coecients in UO2 single crystals through an
original methodology based on utilization of the isotope
235U as tracer and depth pro®ling by secondary ion mass
spectrometry (SIMS).
This new methodology is used in this work to mea-sure uranium grain-boundary diusion coecients in UO2 polycrystals. The knowledge of uranium
inter-granular diusion in UO2is important, because the UO2
nuclear fuels used in power reactors are polycrystalline, and the intergranular diusion may become signi®cant in diusion controlled processes, principally, at lower temperatures.
In this paper the possible eect of the grain-bound-aries on oxygen diusion in UO2 is also investigated.
Marin et Contamin [7] proposed that oxygen diusion in UO2 polycrystals has no dependence on grain size,
which means that the grain-boundaries should not play any important role on oxygen diusion in UO2.
In order to check these previous results related to the oxygen diusion, new measurements of oxygen diusion were performed in UO2single crystals and polycrystals,
in the same experimental conditions, using modern techniques for this type of study.
www.elsevier.nl/locate/jnucmat
*Corresponding author.
E-mail address: [email protected] (A.C.S. Sabioni).
The eect of the grain-boundaries on oxygen and uranium diusion in UO2was determined by comparing
the uranium and oxygen diusivities measured in poly-crystalline samples with those measured in single crys-talline samples, in the same experimental conditions.
2. Experimental procedures
2.1. Material
Sample fabrication. The uranium dioxide used as nuclear fuel in nuclear reactors has a density of ca. 95% of its theoretical value. The volumetric porosity of 5% in this material unables it inadequate to be used in diu-sion experiments, because the porosity is a fast path for the penetration of the tracer, which aects the diusion pro®le.
Therefore, UO2 samples of high density were
spe-cially fabricated for this work at CDTN/CNEN Labo-ratories (Brazil). The high density UO2 samples were
fabricated by using UO2 powder prepared by sol±gel
method, cold pressing of the powder and sintering at 1700°C, for 2 h in H2atmosphere.
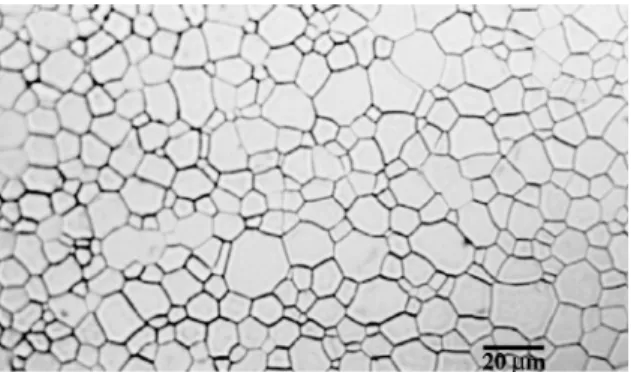
Characterisation of the samples. The density of the sintered UO2 polycrystals was ca. 99.3% of the
theo-retical value and the average grain size was about 12lm.
A typical microstructure of the UO2 polycrystals is
shown in Fig. 1.
The chemical analysis of the UO2 polycrystals
showed about 200 ppm of metallic impurities with the following distribution: Ni (12), Fe (70), Si (31), Al (15), Mg (14), Cr (43), Co (<3), Mo (<30).
The UO2 single crystalline samples used in the
oxy-gen diusion experiments were supplied by the IPN Groupe de Radiochimie, Universite Paris XI (Orsay, France). These single crystalline samples were identical to those used for the determination of the uranium volume diusion [3]. The impurity content of the single
crystals is similar to that of the polycrystals. The char-acteristics of the single crystals are described in Ref. [3].
2.2. Diusion experiments
Sample preparation. The UO2polycrystals and single
crystals were cut with the dimensions 2 mm´5 mm´
5 mm, polished with diamond paste, and submitted to a pre-annealing in order to equilibrate the samples with the temperature and atmosphere to be used in the dif-fusion annealings.
Oxygen diusion. Oxygen diusion experiments were performed by means of the gas±solid isotopic exchange method, using the isotope 18O as oxygen tracer. The
diusion experiments were performed from 605°C to
750°C, in an atmosphere of the gaseous mixture: 98.4%
N2: 1% H2: 0.6% H182 O, where the water vapor was
en-riched with the isotope 18O (40% l8O). Detailed
de-scription of the solid±gas exchange apparatus used in our experiments is given in Ref. [8].
Uranium diusion. In the uranium diusion experi-ments, the UO2polycrystalline samples were placed in a
UO2 powder in an alumina crucible. The uranium of
the powder was enriched with the isotope235U (18.5%)
used as uranium tracer. This powder was supplied by Comiss~ao Nacional de Energia Nuclear/Brazil.
The diusion annealings were performed from 1498°C to 1697°C, in H2atmosphere, in a molybdenum
resistance furnace. The annealing times ranged from 4.8 to 240 h.
After the diusion annealings, the samples were re-moved from the powder, cleaned, and carefully exam-ined to be sure that the surfaces had no powder particles.
2.3. Depth pro®ling by secondary ion mass spectrometry (SIMS)
The uranium and oxygen diusion pro®les were de-termined by SIMS. The SIMS analyses were performed by using a CAMECA 4F apparatus at Laboratoire de Physique des Solides±CNRS/Meudon-Bellevue, France. The analyses of the uranium isotopes were performed by using a primary ion beam of O with energy of 10 keV, while the analyses of the oxygen isotopes were performed with a primary ion beam of Cswith 10 keV energy.
The diusion pro®le of the isotope 235U was
deter-mined through the expression
C 235Uÿ I 235Uÿ
I 234Uÿ I 235Uÿ I 238Uÿ
where the Is represent the signals of the ions 234Uÿ,
235Uÿ and238Uÿ. The diusion pro®les of the isotopes
18O were determined by using the following expression: Fig. 1. Typical microstructure of a UO2polycrystal used in this
C 18O I 18Oÿ I 18Oÿ I 16Oÿ
where the Is represent the signals of the ions16Oÿ and
18Oÿ.
In all cases, the SIMS analyses were performed on an area of 250lm´250lm. The signals of the ions235Uÿ,
234Uÿ and238Uÿ for the case of the uranium, and the signals of the ions18Oÿand16Oÿin the oxygen analysis, were collected from a central zone of the crater of 62lm
in diameter.
The depth pro®les were obtained assuming a con-stant sputtering rate and measuring the depths of the craters by means of a pro®lometer Tencor.
3. Results and discussion
3.1. Uranium diusion in UO2grain-boundaries
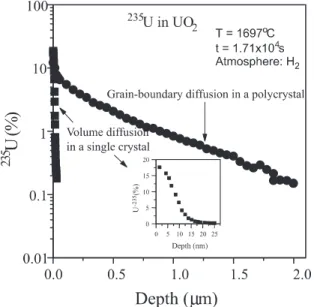
Fig. 2 shows a diusion pro®le of 235U in a
poly-crystalline UO2 after diusion at 1697°C, during
1.71´104s, in hydrogen atmosphere. In the same ®gure,
it is shown, for comparison, the diusion pro®le of the isotope 235U in a single crystalline UO
2 [3] obtained in
the same experimental conditions. In the detail of Fig. 2 the diusion pro®le of the235U in the single crystalline
UO2 in a more appropriate scale to be visualized is
shown.
Fig. 2 shows an evident dierence between the dif-fusion pro®les measured in single crystalline and poly-crystalline samples in the same experimental conditions.
The depth penetration of the tracer in the polycrystal is much greater than in the single crystal. The long tail of the pro®le in the polycrystal is a characteristic of the diusion in the grain-boundaries.
In our experimental conditions, the uranium diu-sion in UO2grain-boundaries corresponds to the B-type
intergranular diusion, which, according to HarrisonÕs conditions [9], is de®ned by the relation
Fig. 3. Comparison of uranium diusion pro®les obtained in UO2at 1498°C for dierent annealing times.
Fig. 4. Uranium diusion in UO2polycrystal at 1697°C.
Fig. 2. Comparison of uranium diusion pro®les obtained in UO2 single crystal and polycrystal in the same experimental
d Dt1=2<U=2
where dis the grain-boundary width, D is the volume
diusion coecient,tis the diusion time, andUis the
grain size.
In B-type integranular diusion experiments it is not possible to determine the grain-boundary diusion co-ecient (D0), but only the productD0d. Le Claire [10]
showed that the productD0dmay be calculated through the following expression:
D0d0:661
ÿo olnx6=C5
ÿ5=3 4D
t
1=2
: 1
Figs. 3 and 4 show other diusion pro®les of 235U in
polycrystalline UO2, but in plots of lnC versus x6=5,
which enable the calculation of the gradient d(lnC)/dx6=5
used in Eq. (1).
Fig. 3 shows two diusion pro®les of 235U in
poly-crystalline UO2 at 1498°C. The dierence between these
pro®les is due to the dierent diusion times used in these experiments (48 and 240 h).
In order to determine the product D0d, through Eq. (1), we have used D-values previously measured in UO2 single crystals [3], in the same experimental
con-ditions of this work.
The experimental conditions used in our experiments and the results obtained for the uranium diusion in UO2 grain-boundaries are listed in Table 1. The
simi-larity of the data obtained at 1498°C, for diusion times
of 48 and 240 h, shows the consistency of our results. In the Arrhenius diagram of Fig. 5 the uranium volume diusion coecients (D) determined by Sabioni et al. [3] in UO2 single crystals [3] are compared to the
uranium grain-boundary diusion coecients (D0) de-termined in this work. In this comparison, it was as-sumed a typical value of 1 nm fordin Eq. (1).
The data of Table 1 and the Arrhenius diagram of Fig. 5 show that the uranium grain-boundary diusion coecients in UO2are ca. 5 orders of magnitude greater
than the volume diusion coecients [3] in the same experimental conditions.
Fig. 5 also shows that the grain-boundary diusion coecients determined in this work are comparable to most of volume diusion coecients previously
Fig. 5. Comparison of grain-boundary diusion coecients determined in this work with volume diusion coecients measured in UO2 single crystals [3] and in UO2 polycrystals
[4,5,11±13] (pcpolycrystal, scsingle crystal). Table 1
Experimental conditions and results obtained for uranium grain-boundary diusion in UO2polycrystals
T(°C) t(s) D(cm2/s) D0(cm3/s) D0/Da
1498 1.737´105 2.7´10ÿ19 2.9´10ÿ21 1.1´105
1498 8,640´105 2.7´10ÿ19 5.9´10ÿ21 2.2´105
1600 7.560´104 1.3´10ÿ18 4.2´10ÿ20 3.2´105
1697 1.710´104 4.9´10ÿ18 1.4´10ÿ19 2.8´105 a
Usingd1 nm.
determined in polycrystalline UO2 [4,5,11±13]. It agrees
with Reimann and Lundy [14] who have already shown that the volume diusion coecients determined in Refs. [5,11,12] are not representative of the true volume dif-fusion, but they correspond to the apparent values due to some short-circuiting mechanism.
Fig. 6 compares uranium grain-boundary diusion coecients, measured in this work, with the previous results determined by Alcock et al. [4], and by Yajima et al. [5]. Our results are lower than those of the previous works. This dierence was expected, because the grain-boundary diusion coecients determined in the previ-ous works [4,5] were calculated using very high values for the volume diusion coecients (apparent values), as shown in Fig. 5.
3.2. Oxygen diusion in UO2 polycrystals and single
crystals
In Fig. 7 diusion pro®les of oxygen in a UO2 single
crystal and in a UO2 polycrystal, obtained in the same
experimental conditions, are compared. The diusion pro®le in the polycrystalline UO2 does not show the
typical tail that characterizes the grain-boundary diu-sion such as that shown in Fig. 2 for uranium diudiu-sion. Therefore, Fig. 7 shows the similarity between the oxy-gen diusion in polycrystalline and single crystalline samples of UO2.
The oxygen diusion coecients in single crystalline and polycrystalline UO2 were determined through a
solution of the diusion equation, for diusion in a semi-in®nite medium from a constant surface concen-tration. This solution is given by [15]
CsÿC CsÿC0erf
x
2pDt
; 2
whereCsis the concentration of the tracer at the surface,
Cis the concentration as a function of position,C0is the
natural abundance of tracer in the UO2 (0.204%),x is
the depth,Dis the diusion coecient,tis the annealing time, and erf is the error function.
Fig. 7. Comparison of oxygen diusion pro®les measured in polycrystalline and single crystalline UO2.
Fig. 8. Arrhenius diagram for oxygen diusion in UO2single
crystals and polycrystals.
Table 2
Results obtained for oxygen diusion in UO2
Sample Type T(°C) t(s) D(cm2/s)
1 Single crystal 605 6.060´104 7.91´10ÿ14
2 Single crystal 700 3.841´103 1.69´10ÿ12
3 Single crystal 750 1.860´103 3.61´10ÿ12
4 Polycrystal 605 6.060´104 8.92´10ÿ14
5 Polycrystal 700 3.841´103 1.84´10ÿ12
Fig. 7 also shows the ®tting of Eq. (2) to the exper-imental diusion pro®les of 18O measured in
polycrys-talline and single cryspolycrys-talline UO2, in the same
experimental conditions. As Eq. (2) is only applied for volume diusion, and as it ®ts well to the oxygen diu-sion pro®le in polycrystalline UO2, it shows that the
oxygen diusion in UO2 polycrystal essentially
corre-sponds to the volume diusion.
The experimental conditions used in this work, as well as the results obtained for the oxygen diusion coecients in UO2, are listed in Table 2.
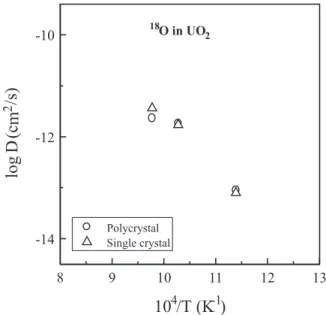
The Arrhenius diagram of Fig. 8 shows that oxygen diusion coecients measured in polycrystalline and single crystalline UO2 are similar in the same
experi-mental conditions. It means that the grain-boundaries are not preferential ways for oxygen diusion in UO2.
This result agrees with previous work of Marin et Contamin [7].
It is worth noting, by comparing Figs. 5 and 8, that oxygen diusion coecients in UO2 are much greater
than the uranium volume diusion coecients extrapo-lated to the temperature range used in the oxygen dif-fusion experiments.
4. Conclusions
Uranium and oxygen diusion coecients were de-termined in uranium dioxide by using modern tech-niques. The aim of this study was to establish the role of the grain-boundaries on the uranium and oxygen diu-sion in UO2.
Between 1498°C and 1697°C, in H2 atmosphere,
uranium diusion in UO2 grain-boundaries is ca. ®ve
orders of magnitude greater than uranium volume dif-fusion, in the same experimental conditions. These re-sults show that grain-boundaries are fast ways for uranium diusion in polycrystalline UO2.
The uranium grain-boundary diusion coecients determined in this work are comparable to most of uranium volume diusion coecients previously deter-mined in polycrystalline samples, which con®rms that most of previous data of uranium volume diusion
coecients determined in UO2 polycrystals are in fact
apparent diusion coecients due to some short-cir-cuiting diusion mechanism.
Between 605°C and 750°C, in H2/N2/H2O
atmo-sphere, the oxygen diusion coecients measured in polycrystalline and single crystalline UO2 are similar,
and correspond to the volume diusion. It means that the UO2grain-boundaries do not play an evident role on
oxygen diusion processes in UO2.
Acknowledgements
This work was supported by FAPEMIG, CNPq, and CNEN (Brazil). The authors are grateful to Professor Michel Genet who provided the UO2single crystals, and
to C. Dolin (CNRS-France) for the SIMS analysis.
References
[1] J. Belle, J. Nucl. Mater. 30 (1969) 3.
[2] Hj. Matkze, J. Chem. Soc. Faraday Trans. 2 (83) (1987) 1121.
[3] A.C.S. Sabioni, W.B. Ferraz, F. Millot, J. Nucl. Mater. 257 (1998) 180.
[4] G.B. Alcock, R.J. Hawkins, A.W.D. Hills, P. McNamara, Paper SM-66/36, IAEA, Simp. Thermodynamics, Vienna, 1965.
[5] S. Yajima, H. Furuya, T. Hiroi, J. Nucl. Mater. 20 (1966) 162.
[6] Hj. Matzke, in: R.P. Argawala, (Ed.), Diusion Processes in Nuclear Materials, Elsevier, Amsterdam, 1992, p. 9. [7] J.F. Marin, P. Contamin, J. Nucl. Mater. 30 (1969) 16. [8] A.C.S. Sabioni et al., Philos. Mag. 66 AA (1992) 251. [9] L.G. Harrison, Trans. Faraday Soc. 57 (1961) 1191. [10] A.D. Le Claire, Brit. J. Appl. Phys. 14 (1963) 351. [11] A.B. Auskern, J. Belle, J. Nucl. Mater. 3 (1961). [12] R. Lindner, F. Schmitz-, Z. Naturforsch. 16A (1961) 1373. [13] H. Assmann, H. Stehle, Nucl. Eng. Design 48 (1978) 49. [14] D.K. Reimann, T.S. Lundy, J. Nucl. Mater. 28 (1968)
218.
![Fig. 5. Comparison of grain-boundary diusion coecients determined in this work with volume diusion coecients measured in UO 2 single crystals [3] and in UO 2 polycrystals [4,5,11±13] (pc polycrystal, sc single crystal).](https://thumb-eu.123doks.com/thumbv2/123dok_br/15752858.638295/4.816.428.749.675.997/comparison-boundary-determined-measured-crystals-polycrystals-polycrystal-crystal.webp)