Letter to the Editors
First study of uranium self-diusion in UO
2
by SIMS
A.C.S. Sabioni
a,*, W.B. Ferraz
b, F. Millot
ca
Universidade Federal de Ouro Preto, Departamento de Fõsica, 35400-000, Ouro Preto, Brazil b
Centro de Desenvolvimento da Tecnologia Nuclear/CNEN, 30161-970, Belo Horizonte, Brazil cCentre de Recherche sur la Physique des Hautes Temperatures/CNRS, 45071 Orl
eans, France
Received 3 May 1998; accepted 21 July 1998
Abstract
Uranium self-diusion coecients were measured in UO2single crystals through an original methodology based on
the utilization of 235U as tracer and depth pro®ling by secondary ion mass spectrometry (SIMS). The values of the self-diusion coecients measured in this work, between 1498 and 1697°C, in H2 atmosphere, can be described by the following Arrhenius relation:D(cm2/s)8.54´10ÿ7exp[
)4.4(eV)/kT], and are lower than those previously determined
by other authors in `nearly stochiometric' UO2in the same temperature range. Ó1998 Elsevier Science B.V. All rights
reserved.
1. Introduction
UO2 is a material which presents a great
technolog-ical interest because of its utilization as nuclear fuel. The properties of this material have been intensively studied in the last few decades. In particular, uranium self-dif-fusion has been the object of a number of investigations. The interest in uranium diusion in UO2has lain in the
fact that many important processes like, for example, sintering, creep, grain growth in-reactor densi®cation and others, are controlled by uranium diusion. Many methods ± direct and indirect ± have been used for the determination of cation self-diusion in UO2. All the
direct methods have applied radioactive techniques, while the indirect methods are based on data from sintering kinetics. In general, the published results present a signi®cative spread. Reviews about uranium diusion in UO2 have been made in previous papers
[1,2].
The present work deals with new measurements of uranium diusion in UO2 single crystals through an
original methodology based on the utilization of235U as
tracer and depth pro®ling by secondary ion mass spec-trometry (SIMS). The results of these measurements are
described, and compared to earlier results obtained by other authors.
2. Experimental procedures
The crystals were supplied by IPN Groupe de Ra-diochimie, Universite de Paris-Sud(Orsay±France). The metallic impurities were (in ppm) Fe(70), Ca(45), Cr(43), Al(15), Mg(14), Ni(12), Mo(<30) and Co (<3). Samples of 424 mm3 were polished with diamond paste,
pre-annealed under the same conditions of temperature and atmosphere of the diusion annealing, and then packed in a UO2 powder into alumina crucible. The
uranium of the UO2 powder was enriched (18.5%)
with the isotope 235U. This powder was supplied by
Comissao Nacional de Energia Nuclear/Brazil~ .
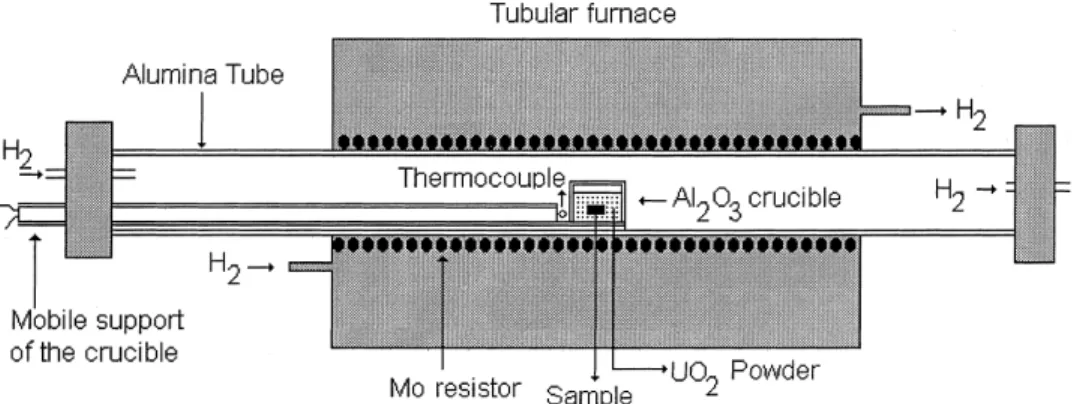
The diusion experiments were performed from 1498C to 1697C, in a H
2 atmosphere. The diusion
times varied between 4.4 and 48.3 h. The schematic of the heat-treatment arrangement used for the diusion experiments is shown in Fig. 1. After the diusion annealings the samples were carefully cleaned in order to ensure that no powder remained in contact with the surface of the samples. The polished surface was not damaged during the diusion annealing.
The depth pro®les of235U were determined by means
of a SIMS-Cameca 4F using a 10 keV primary ion beam
*Corresponding author. Fax: +55-31 551 1689; e-mail:
of O. These analysis were performed onLaboratorie de Physique des Solides/CNRS (Meudon/Bellevue, France). The analysis were performed at an area of 250lm250lm, and the signals of the ions 235Uÿ, 234Uÿ and238Uÿ were taken from a zone of 62lm in
diameter. The concentration of 235U was determined
through the expression
C 235U I
235
Uÿ
I 234Uÿ I 235Uÿ I 238Uÿ:
The penetration depths were obtained assuming a constant sputtering rate and measuring the depth of the crater by means of a Tencor pro®lometer or by laser interferometry in the case of shallow craters of a few nanometers depth.
3. Results and discussion
The concentration of 235U at the surface of the
samples was similar to that of the 235U in the UO 2
powder. Therefore, the following Ficks' second law so-lution has been used for the determination of the diu-sion coecients [3]
CsÿC
CsÿCo
erf x 2
Dt p
; 1
whereCsis the concentration of the tracer at the surface,
Cis the concentration as a function of position,Cois the
natural abundance of tracer in sample,xis the depth,D
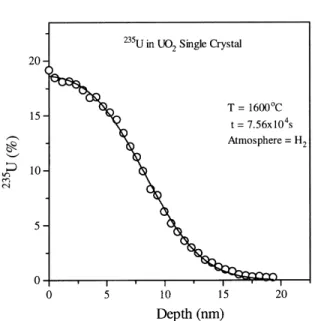
is the diusion coecient, andtis the annealing time. Eq. (1) has been ®tted very well to the diusion pro®les obtained at 1498C as shown in Fig. 2, but, for
higher temperatures, the diusion pro®les have not corresponded to those given by Eq. (1). The shape of the pro®les has indicated that some matter had been de-posited on the surface. Evaporation±condensation from the powder to the crystal surface may be responsible for the shape of the pro®les, a point that is discussed in
Appendix A. In such cases, the diusion coecients were estimated using Fick's second law solution derived for the case of an evaporating medium and given by [4]
C x0;t 12Css erfc
x0vt
2 Dt p
exp ÿvx D
erfc x
0ÿvt
2 Dt p
; 2
whereCssis the concentration at the separation surface
between the sample and the involving medium,x0 is the
depth from the new surface, and v is the evaporating velocity.
In Eq. (2), v>0 for the loss of material from the sample and v<0 for the deposit of material on the surface, the latter being the case here. In plot of Fig. 3 is shown a ®tting of Eq. (2) to a diusion pro®le at
Fig. 2. Diusion pro®le for the isotope 235U in UO 2 single
crystal at 1498C.
1600C. The variation of v with the temperature is
il-lustrated in Fig. 4, and can be described by the following relation:
v nm=s 2:31010exp
ÿ5:4 eV=kT: 3
The new methodology used in this work was able to measure uranium diusion coecients as small as 1:9110ÿ19cm2=s at 1498C. The diusion coecients
measured in the present work, between 1498 and 1697C, can be described by the following Arrhenius
relation
D cm2=s 8:5410ÿ7exp
ÿ4:4 eV=kT: 4
Fig. 5 shows an Arrhenius diagram, that contains the uranium diusion coecients measured in this work and those determined by other authors in `nearly stoi-chiometric' UO2[2,5±9] and also in ThO2 [10]. The
ac-tivation energies for uranium volume diusion in UO2of
the earlier works have ranged from 3.0 to 5.6 eV. (Our value is 4.4 eV.) Activation energy for uranium diusion obtained by Jackson et al. [11], using theoretical calcu-lations, is 12.5 eV, and, consequently, very dierent from those obtained experimentally.
The order of magnitude of the uranium self-diusion coecients measured in this work seems to be well es-tablished. Our results for uranium diusion in UO2 are
lower than those of previous works, but they are in reasonable agreement with those for uranium diusion in ThO2 [10]. The reliability of the present data can be
corroborated by the following arguments:
· Our single crystalline samples had no defect (porosi-ty, breaks,. . .). So, the artifact contribution to the dif-fusion pro®les were eliminated.
· The results of the diusion coecients were repro-ducible.
· The values obtained for the ®tted parameters had correct physical meaning.
· Very low diusion of U in UO2 is not surprising. Matzke [12], for example, using data of Marin et al. [13], has roughly estimated the `true' uranium diu-sion coecient, at 1500C, as 10ÿ19cm2=s, which is
similar to the present data.
Fig. 4. Variation of the parametervas a function of the tem-perature.
Fig. 5. Arrhenius diagram comparing the present data with results previously published for uranium diusion in UO2and
ThO2(sc single crystal; pc polycrystal).
Fig. 3. Diusion pro®le of235U in UO
Finally, according to some authors [14,15] cation self-diusion in ¯uorite-structure materials
UO2;ThO2;CaF2;HfO2;. . . should be similar in a
normalized Arrhenius diagram ( logD versus Tm=T,
whereTmmelting temperature in kelvin). As shown in
Fig. 6, the values of the present work fall inside the re-gion de®ned by the extrapolation of the results for Ca self-diusion in CaF2 [14±16].
In the discussion above, our UO2 samples were
as-sumed to be stoichiometric. Other authors have also performed diusion experiments in hydrogen atmo-sphere, and have assumed a stoichiometric behavior for the UO2[2,5±8]. But, it is expected that uranium dioxide
may be hypostoichiometric at high temperature, in a reducing atmosphere. This possible deviation from the stoichiometry of the UO2 was estimated for our
exper-imental conditions, and its in¯uence on the results is discussed below.
In the diusion annealings, pure hydrogen was used, and the amount of H2O in the gas, according to the
supplier, was less than 5 ppm. In order to discuss the eect of a possible deviation from stoichiometry on the uranium diusion in UO2, we have assumed 5 ppm of
H2O in the H2 atmosphere. Probably, there was no
penetration of oxygen from outside to inside the alu-mina tube, during the diusion annealings, because it was also externally involved by hydrogen as shown in Fig. 1.
Using thermodynamical data of Pattoret et al. [17], and considering that the oxygen partial pressure is de-®ned by the amount of the water impurity in H2, values
ofxwere estimated for UO2ÿx. Thesex-values and also
the calculated uranium-defect concentration in stoic-hiometric and hypostoicstoic-hiometric UO2, between 1500C
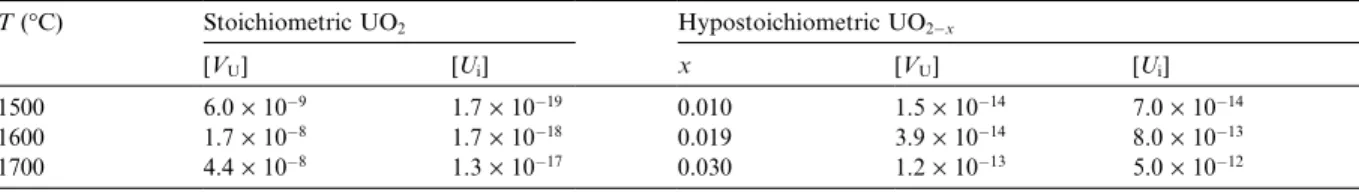
and 1700C, are shown in Table 1. The point-defect
concentration was calculated using Lidiard Model [18,19] for the defect structure of UO2x.
Table 1 shows that uranium vacancy is the predom-inant metal-defect in stoichiometric UO2;while the total
amount of uranium defects (vacancies and interstitials) in hypostoichiometric UO2ÿx is much lower than the
uranium vacancy concentration in stoichiometric UO2.
It means that uranium diusion in UO2ÿx should be
much lower than in UO2in the same temperature range.
So, an hypostoichiometric behavior of the UO2 may
have aected the present results, but it is not the only reason able to explain why our results are lower than those of previous works. It is worth remembering that several of the previous works were also performed in H2
atmosphere [2,5±8], sometimes even at higher tempera-tures, and the samples used may eventually have had an hypostoichiometric behavior.
In fact, it is not very simple to explain the scattering of the earlier results, and the dierence between them and the results of the present work. Besides the possible deviation from stoichiometry, which is very sensitive to small variations of the oxygen pressure, many other parameters should be considered, such as, for example, the nature and amount of the impurities, the charac-teristics of the samples, and the experimental procedures and techniques used to measure the diusion coe-cients. New experiments are planned in order to study the uranium diusion in UO2as a function of the oxygen
pressure, or in other words, as a function ofxin UO2x.
Only such a study may allow us to draw a conclusive interpretation of the uranium diusion mechanism in uranium dioxide and to establish how the deviation from the stoichiometry aects the magnitude of the diusion coecients.
Fig. 6. Arrhenius diagram comparing the cation self-diusion in dierent ¯uorite-structure materials.
Table 1
Calculated uranium-defect concentrations for uranium dioxide
T(°C) Stoichiometric UO2 Hypostoichiometric UO2ÿx
[VU] [Ui] x [VU] [Ui] 1500 6.0´10ÿ9 1.7´10ÿ19 0.010 1.5´10ÿ14 7.0´10ÿ14
1600 1.7´10ÿ8 1.7´10ÿ18 0.019 3.9´10ÿ14 8.0´10ÿ13
Acknowledgements
This Project was supported by CNPq and FAPE-MIG (Brazil). The authors are grateful to Professor Michel Genet who provided the UO2 single crystals,
Professor J. Philibert for his comments and suggestions, and to C. Dolin for the SIMS analysis.
Appendix A
The deposition of235U enriched UO
2 on the surface
of the sample during the diusion experiments for the higher temperatures of this study implies that some transport mechanism of UO2 is operative during the
diusion mechanism which allow transferring matter from the UO2 powder to the UO2 single crystal.
Esti-mation of UO2 transport from the powder to the single
crystal by an evaporation±condensation mechanism based on dierent vapor pressures at the surfaces of the UO2powder and single crystal can be made by using the
Gibbs±Thompson relation given by
RT lnppowder
pcrystal
2cV
r; 5
wherec600 dyne=cm is a mean surface tension value
for UO2[20],Vis the molar volume of UO2, andris the
mean radius of the hypothetically spherical powder (r1:25lm).
With these numbers, we have ppowder=pcrystal
1:0016C, at 1600C, and this dierence of pressure
induces a net ¯ux of gaseous uranium bearing species from powder to crystal
JU ÿDUrCUDU
ppowderÿpcrystal
rRT ; 6
where the interdiusion coecient, DU, of uranium
gaseous species in hydrogen could be of the order of 1 cm2=s. Although approximative, this value is
reason-able on account of the empirical comparisons among various experimental cases (see for instance Ref. [21]).
The rate of increase of the thickness vof the UO2
single crystal is therefore
vaVJU; 7
whereais the percentage of surface porosities measured
on a plane cut into the powder (a0:5 can be chosen
for an uncompacted powder).
In order to estimate the value ofv, we need an input value of the vapour pressure of UO 2gas, the only gaseous
specie able to realize an approximate congruent trans-port. From Pattoret et al.'s work [17], we have at 1600C; p1:3510ÿ8 atm, and, consequently,
v1:410ÿ13 m=s. This value is in a reasonable
agreement with that given by Eq. (3), viz. 8:510ÿ14m=s on account of the approximations
in-volved in the model. The temperature dependence ofvis related to its activation energy (Ev5:4 eV, see Eq. (3))
and is comparable with the enthalpy of vaporization of UO 2gas (6.1 eV following Ref. [17]). On account of the
previous calculations, the transport of UO2 from
pow-der to crystal by the gas phase seems a reasonable hy-pothesis which comforts the choice of Eq. (2) to describe the diusion experiments.
References
[1] J. Belle, J. Nucl. Mater. 30 (1969) 3.
[2] Hj. Matzke, J. Chem. Soc. Faraday Trans. 2 (83) (1987) 1121.
[3] J. Philibert, Diusion et transport de matiere dans les solides, Les Editions de Physique, 1985.
[4] T.I. Kucher, Sov. Phys. Solid State 3 (2) (1961) 401. [5] A.B. Auskern, J. Belle, J. Nucl. Mater. 3 (1961) 267. [6] R. Lindner, F. Schmitz, Z. Naturforsch. 169 (1961) 1373. [7] G.B. Alcock, R.J. Hawkins, A.W.D. Hills, P. McNamara,
Paper SM-66/36, IAEA, Simp. Thermodynamics, Vienna, 1965.
[8] D.K. Reimann, T.S. Lundy, J. Am. Ceram. Soc. 52 (9) (1969) 511.
[9] S. Yajima, H. Furuya, T. Hiroi, J. Nucl. Mater. 20 (1966) 162.
[10] Hj. Matzke, J. Phys. (Paris) Colloque C7, supplement au no. 12, Tome 37, Decembre 1976.
[11] R.A. Jackson, A.D. Murray, J.H. Harding, C.R.A. Catlow, Philos. Mag. 53 (1986) 27.
[12] Hj. Matzke, J. Nucl. Mater. 30 (1969) 26.
[13] J.F. Marin, H. Michaud, P. Contamin, Comp. Rend. Ac. Sci. Paris 264 (1967) 1633.
[14] Hj. Matzke, R. Lindner, Z. Naturforsch. 19A (1964) 1178. [15] M.F. Berard, J. Am. Ceram. Soc. 54 (1971) 144. [16] A.D. King, J. Moerman, Phys. Stat. Sol. A 22 (1974) 455. [17] A. Pattoret, J. Drowart, S. Smoes, Thermodynamics of
Nuclear Materials 1967, LAEA Vienna, 1968, p. 613. [18] A.B. Lidiard, J. Nucl. Mater. 19 (1966) 106. [19] Hj. Matzke, Canadian Report AECL-2585, 1966. [20] P.S. Maiya, J. Nucl. Mater. 40 (1971) 57.