Article
J. Braz. Chem. Soc., Vol. 22, No. 8, 1470-1477, 2011. Printed in Brazil - ©2011 Sociedade Brasileira de Química 0103 - 5053 $6.00+0.00
A
*e-mail: [email protected]
#Present address: Unidade Acadêmica de Serra Talhada, Universidade
Federal Rural de Pernambuco, 56900-000 Serra Talhada-PE, Brazil
Evaluation of a PVC Sensing Phase for Determination of Chlorinated Hydrocarbons
in Water by Mid-Infrared Spectroscopy
Andréa Monteiro S. Silva,#,a Eduardo de Araujo Viana,b Maria Fernanda Pimentel,b
Yeda M. B. Almeidab and Ivo M. Raimundo Jr.*,c
aDepartamento de Química Fundamental, Universidade Federal de Pernambuco,
50670-901 Recife-PE, Brazil
bDepartamento de Engenharia Química, Universidade Federal de Pernambuco,
50740-521 Recife-PE, Brazil
cInstituto de Química, Universidade Estadual de Campinas, CP 6154,
13083-970 Campinas-SP, Brazil
Neste trabalho, a espectroscopia no infravermelho médio foi utilizada para investigar o efeito da quantidade (25 ou 40%) e do tipo de plastiicante (di-2-etilhexil ftalato (DOP), di-2-etilhexil sebacato (DOS) e 2-nitrofenil octil éter (NPOE)) na resposta analítica de uma fase sensora de poli(cloreto de vinila) (PVC) para a determinação de hidrocarbonetos clorados (clorobenzeno (ClB), tricloroetileno (TCE) e triclorobenzeno(TCB)) em água. Foi observado que os ilmes com 40% de plastiicante geraram maior sensibilidade e menores limites de detecção que aqueles preparados com 25%, embora esses últimos sejam de manipulação mais fácil. Um comportamento similar foi também observado para fases sensoras preparadas com os plastiicantes NPOE e DOS. Com o uso da fase sensora de PVC-DOS e um tempo de extração de 60 min, foram obtidos limites de detecção de 0,3, 0,6 e 0,5 mg L-1 para clorobenzeno, tricloroetileno e triclorobenzeno, respectivamente.
In this work, mid-infrared spectroscopy has been employed to investigate the effect of amount (25 or 40%) and type of plasticiser (di-2-ethylhexyl sebacate (DOS), di-2-ethylhexyl phthalate (DOP) and 2-nitrophenyl octyl ether (NPOE)) on the analytical response of a poly(vinylchloride) (PVC) sensing phase for the determination of the chlorinated hydrocarbons (chlorobenzene (ClB), trichloroethylene (TCE) and trichlorobenzene (TCB)) in water. It was observed that ilms with 40% of plasticiser provided higher sensitivity and lower limits of detection than those with 25%, although the later ilms are easier to handle. A similar behaviour was also observed for sensing phases prepared with the plasticisers NPOE and DOS. By employing a DOS-based PVC sensing phase and extraction time of 60 min, limits of detection of 0.3, 0.6, and 0.5 mg L-1 were obtained
for chlorobenzene, trichloroethylene and trichlorobenzene, respectively.
Keywords: optical sensor, chlorinated hydrocarbons, PVC, mid infrared
Introduction
Chlorinated hydrocarbons are a serious threat to the environment, as they are resistant to degradation. In addition, these compounds have a tendency to bioaccumulate in animals, making their identiication and determination in water of great concern.1 Their indiscriminate and uncontrolled use is associated
with innumerable environmental problems caused by agrochemicals and other substances which contain chlorine.2
As a consequence of their simplicity, expeditiousness and low cost, screening methods have been widely employed as alternative strategies to verify whether a particular area is contaminated. The goal of a screening procedure is to collect analytical data for a subsequent evaluation of the contamination degree of a speciic area, as well as to guide forthcoming plans for monitoring and recovery/ remediation.8,9 Among analytical screening methods, chemical and physical sensors represent an emerging technology which can be important for the identiication and quantiication of harmful compounds. Their use is still not fully developed, requiring basic research to enable the development of simple and eficient methods for in situ applications. However, some optical sensors based on mid-infrared spectroscopy have been successfully applied for detection of chlorinated hydrocarbons in water.10-12
Analytical methods that employ mid-infrared spectroscopy, developed for the determination of hydrocarbons in water, are based on strategies that remove water from the spectral measurement, as this compound has a wide and intense absorption band which interferes in the direct determination of many analytes.13 These pollutants are usually present in water in very small quantities, impairing their direct detection and quantification. However, if they are transferred to and concentrated in a solid phase (e.g., a polymer), their identiication and determination are substantially facilitated.14 This strategy, known as solid-phase microextraction (SPME),15 is usually employed in gas chromatography and consists of concentrating the environmental contaminants for later analysis. In the infrared region, SPME is employed associated with attenuated total relectance (ATR),16-20 transflectance13 and transmittance measurements.21-23 Recently, Pejcic et al.24 reviewed the application of MIR-ATR sensing for monitoring organic pollutants in water, addressing the effects of membrane type, ilm thickness and conditioning on the sensor response. Considering the determination of chlorinated hydrocarbons, different membranes have been investigated, such as polyisobutylene (PIB),17,18,25-28 ethylene/propylene copolymer (EcoP),17,18,28,29 low density polyethylene,18 polydimethylsiloxane,30 trichlorooctadecylsilane,30 poly(ether-esteramide).30 In addition, parailm M31,32 and polydimethylsiloxane32 have been also used for determination of these compounds based on transmittance measurements.
In this context, the main objective of this work is evaluate polymeric ilms of poly(vinylchloride) as sensing phases for determination of chlorinated hydrocarbons in water by employing mid-infrared spectroscopy. For this purpose, the effects of the quantity of plasticizer (25 or 40%) and its type (2-ethylhexyl sebacate (DOS),
di-2-ethylhexyl phthalate (DOP) and 2-nitrophenyl octyl ether (NPOE)) in the PVC sensing phase were evaluated using three chlorinated hydrocarbons of environmental interest: clorobenzene (ClB), tichloroethylene (TCE) and trichlorobenzene (TCB).
Experimental
Reagents and solutions
Chlorobenzene (Merck), trichloroethylene (Merck), trichlorobenzene (Vetec), methanol (Vetec), THF (Vetec) and sodium chloride (F. Maia) were used as purchased. Distilled-deionised water was used to prepare the contaminated water samples. PVC powder was supplied by Tiletron, while DOP (di-2-ethylhexyl phthalate) and Tinuvin P (2-(2-hydroxy-5-tert-octylphenyl)benzotriazol) were supplied by Ciba-Geigy. DOS (di-2-ethylhexyl sebacate) and NPOE (2-nitrophenyl octyl ether) were supplied by Sigma-Aldrich and used as received.
Stock solutions of each chlorinated hydrocarbon were prepared in methanol (50000 mg L-1) which were then properly diluted to obtain aqueous reference solutions from 0 to 80 mg L-1. The methanol concentration in all solutions, including the blanks, was maintained at 3.2% (v/v), except for trichlorobenzene, where it was 16% (v/v).
Sensing phase preparation
Films were prepared from a mixture containing 0.3% (m/m) stabiliser, 25% (m/m) or 40% (m/m) plasticiser and enough PVC to obtain a total mass of 2.0 g. This mixture was dissolved in 40 mL of THF and the solution was spread on a Petri dish (10 cm diameter) and dried for 5 days at ambient temperature (22 ± 2 oC), producing ilms with thicknesses of 150 ± 20 µm, evaluated by means of a micrometer (Mitutoyo). The stabiliser Tinuvin P was used to slow down the photodegradation process of the PVC, thus increasing the lifetime of the sensor.
Procedure
Spectra were obtained with a Perkin-Elmer FTIR Spectrum GX spectrophotometer, in the range from 3100 to 650 cm-1, with a resolution of 8 cm-1 and as an average of 8 scans. Before the extraction procedure, the spectrum of the sensing phase was taken for reference, providing the I0 intensities for absorbance calculations.
an aqueous sample solution containing the chlorinated hydrocarbon and kept under stirring for ixed time intervals. Afterwards, the sensing phase was removed from the vial, dried with a soft tissue and placed in the optical path of the spectrophotometer with the aid of a home-made holder.22 Sodium chloride was used in order to improve the extraction eficiency, due to the salting out effect.21,22 Except where mentioned, extraction time was set at 60 min, as this interval of time provided signals intense enough to demonstrate the feasibility of the proposed method.
Standard solutions were used to estimate the igures of merit. Analytical curves were constructed for different wavenumbers by employing derivative spectra (first derivative Savitsky-Golay ilter with an 11-point window). The repeatability, expressed as the relative standard deviation (RSD), was estimated by means of four repetitions (different extractions with different sensing phases) using solutions of each analyte with concentrations of 40 mg L-1. The limit of detection (LOD) was calculated by 3 SDblank/S, where SDblank is the standard deviation of the blank (a 3.2% (v/v) methanol aqueous solution) and S is the slope of the analytical curve.
In order to evaluate the interference of water, an attenuated total relection probe (ATR, Axion Analytical, model DIPPER-210) was employed. The measurement was made directly in the aqueous solution containing 80 mg L-1 chlorobenzene, employing the spectrum of water as reference.
Results and Discussion
One limitation to the determination of chlorinated hydrocarbons in water by infrared spectroscopy is related to the high absorbance of the O–H group of water.33 As depicted in Figure 1, the spectrum of a 80 mg L-1 chlorobenzene in aqueous solution, obtained with the use of the ATR dipper, presents very low intensity, while an evident spectrum is obtained with transmittance measurements through the PVC sensing phase, after performing an extraction for 60 min according to the experimental conditions mentioned. The essential role of the sensing phase in the extraction and pre-concentration of the analyte is easily observed in the bands at 740, 700 and 683 cm-1, which are characteristic for the chlorobenzene molecule.
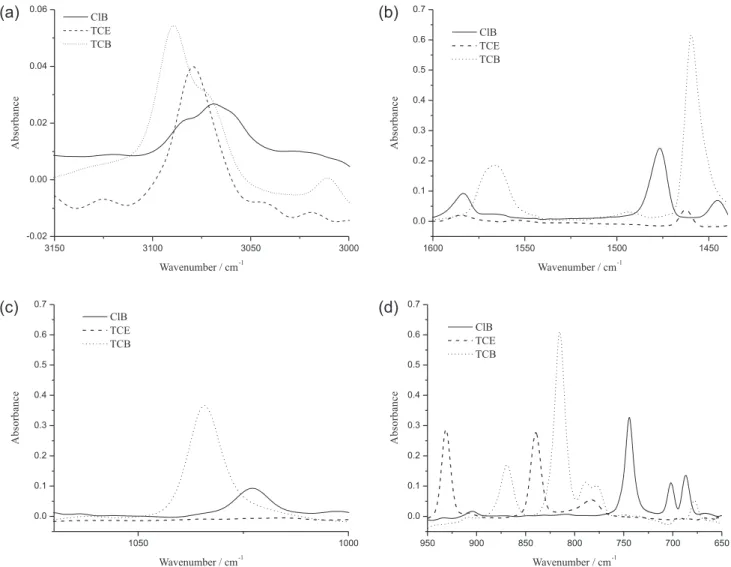
Figure 2 shows the characteristic peaks of chlorobenzene (ClB), trichloroethylene (TCE) and trichlorobenzene (TCB) in different regions of the spectrum, which were obtained with the use of the sensing phase. Except for the region around 3100 cm-1, the bands of the three analytes are not completely overlapped. Trichlorobenzene presents high intensity peaks in all selected regions. In general,
the C–H stretching bands found above 3000 cm-1 result from aromatic, heteroaromatic and alkene vibrations, whose frequency and intensity depend on the substitution pattern, as shown in Figure 2a. The C–C stretching bands of the aromatic skeletal are found in the regions from 1585 to 1600 cm-1 and from 1400 to 1500 cm-1, as shown in Figure 2b. Trichloroethylene presents no bands in the 1000-1100 cm-1 region, where absorption bands due to C–H aromatic in-plane bending appear,33 as depicted in Figure 2c. Finally, Figure 2d shows the ingerprint region of the spectrum, where the C–H aromatic out-of-plane bending as well as the C–Cl stretching bands for all the chlorinated hydrocarbons can be observed. The most intense band occurs at 819 cm-1 for trichlorobenzene.
It is important to emphasize that the analytes used in the present study were individually evaluated, although in a contamination issue all of them can be present in the water sample, including other types of hydrocarbons (chlorinated, aromatic, etc.) that would absorb in the same region of the spectrum. For instance, the fingerprinting region is adequate for individually determine chlorobenzene, trichloroethylene and trichlorobenzene (Figure 2d) as well as for determination of BTEX.23 However, a mixture of chlorinated and aromatic hydrocarbons requires multivariate analyses for their determination, due to interferences and interaction effects.23 These aspects extrapolate the objectives of the present work, which is focused on the evaluation of a PVC sensing phase for determination of chlorinated hydrocarbons, which, to the best of our knowledge, has not been applied to this task yet. The properties of the sensing phase are strongly affected by the kind of plasticiser used and its concentration. Figure 3 shows the effect of the DOP plasticiser concentration on
Figure 1. Comparison of the spectra of water, 80 mg L-1 chlorobenzene
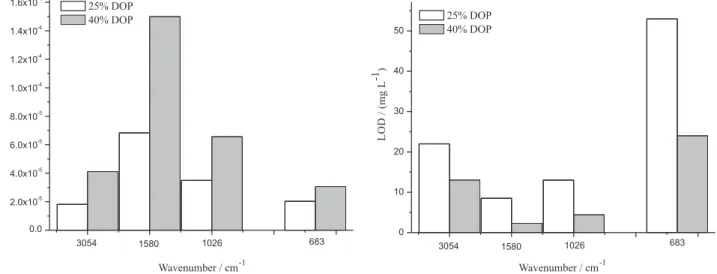
the absorption spectrum of chlorobenzene. For each region investigated, it can be easily observed that the signal increases with the concentration of plasticiser in the PVC. Figure 4 summarises the effect of the DOP concentration on the sensitivity and on the limit of detection for chlorobenzene in different spectral regions. Although these igures of merit are improved as the concentration of plasticiser is increased from 25 to 40%, the polymeric ilm became excessively lexible, making its handling very dificult. For this reason, the investigation of the effects of plasticiser on the PVC sensing phase was performed using concentrations of 25%.
The type of plasticiser also affects the signal intensity, as it changes the extraction eficiency and rate. Figure 5 shows the extraction proiles provided by DOP, DOS and NPOE-based sensing phases for a 80 mg L-1 chlorobenzene aqueous solution. As it can be seen, compared to DOS and DOP, NPOE causes enhancement of the extraction rate as well as of the eficiency due to its higher polarity (dielectric
constant of 24). This result demonstrates the important role of the plasticiser, as DOS is more appropriate for extraction of benzene, toluene, ethylbenzene and xylenes from water.22 In other words, the polarities of the plasticiser and of the analytes must be matched in order to improve the performance of the sensing phase. Independent of the plasticiser used to prepare the sensing phase, the saturation time was around 80 min, for measurements performed according to the procedure described in the experimental section.
Considering the strategy employed for transmittance measurements, which consists of removing the sensing phase from the aqueous solution and drying with a soft tissue before being placed in the holder, the evaporation rate of the extracted analytes must be investigated in order to demonstrate the feasibility of the method. Figure 6 indicates that the sensing phase prepared with DOS has the most rapid loss of chlorobenzene as a function of time, as it is the least polar plasticiser. However, the evaporation
Figure 2. Spectra of chlorobenzene (ClB), trichloroethylene (TCE) and trichlorobenzene (TCB) after their extraction from an 80 mg L-1 aqueous solution
rate is still low, enabling the measurements to be performed without impairing the precision and the accuracy of the method. In addition, the sensing phase prepared with this
plasticiser is easier to handle than that prepared with NPOE, indicating its use for subsequent studies with the analytes. Figure 7 shows the evaporation proiles for the chlorinated
Figure 3. Effect of DOP content in the PVC sensing phase on the spectrum of chlorobenzene (ClB). (a) 3100-2900 cm-1 region, (b) 1600-1470 cm-1 region,
(c) 1040-1000 cm-1 region and (d) 780-675 cm-1 region.
Figure 5. Extraction proiles of DOP, DOS and NPOE-based sensing phases (25% of plasticiser) for an 80 mg L-1 chlorobenzene aqueous
solution (irst derivative signal at 1481 cm-1).
Figure 6. Evaporation proiles of chlorobenzene after its extraction from an 80 mg L-1 aqueous solution for DOP, DOS and NPOE-based sensing
phases (irst derivative signal at 1481 cm-1).
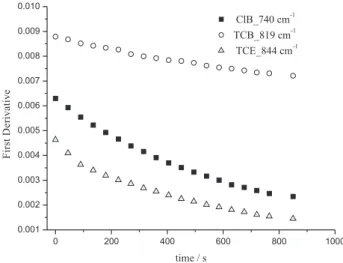
Figure 7. Evaporation proiles of chlorobenzene (ClB), trichloroethylene (TCE) and trichlorobenzene (TCB) after their extraction from an 80 mg L-1
aqueous solution for DOS-based sensing phase.
Figure 8. Effect of methanol content in the aqueous solution on the extraction of trichlorobenzene (80 mg L-1).
hydrocarbons previously extracted by the DOS-based sensing phase, indicating that trichlorobenzene evaporates more slowly than the other two analytes, as it presents the lowest vapour pressure.
The composition of the sample solution also affects the extraction eficiency of the sensing phase. For example, due to its low solubility in water, the aqueous trichlorobenzene solutions were prepared with the addition of 16% (v/v) of methanol, which allowed dissolution of up to 80 mg L-1 of the analyte. Figure 8 shows the effect of the amount of methanol in the aqueous solution on the extraction of trichlorobenzene by the sensing phase. As it can be noted, the signal intensity decreases as the concentration of methanol increases, since it enhances the solubility of the chlorinated hydrocarbon in water, therefore impairing the extraction eficiency.
The igures of merit were evaluated by using analytical curves, which were constructed at several wavenumbers. Initially, the effect of the type of plasticiser was investigated, by employing chlorobenzene as the analyte. Table 1 summarises the results obtained, where it can be observed that NPOE and DOS provide analytical curves with similar slopes and correlation coeficients. However, the highest relative standard deviations of the blank solution were obtained with the NPOE-based sensing phase, probably due to the interference of the absorption bands of this plasticiser. For example, the band at 740 cm-1 for chlorobenzene provided RSD of 20%, 13% and 5% with the use of NPOE, DOP e DOS, respectively. As a consequence, the sensing phase prepared with DOS allowed obtaining the best limits of detection, as shown in Table 1.
Table 1. Effect of DOP, NPOE and DOS plasticisers used to prepare the PVC sensing phases on the igures of merit for determination of chlorobenzene Wavenumber /
cm-1
DOP NPOE DOS
R2 Slope /
(L mg -1)
LOD /
(mg L-1) R2
Slope / (L mg -1)
LOD /
(mg L-1) R2
Slope / (L mg -1)
LOD / (mg L-1)
3054 0.94 1.9 ×10⁻⁵ 24.7 0.997 3.5 ×10⁻⁵ 2.9 0.98 3.0 ×10⁻⁵ 7.9
1580 0.98 8.0 ×10⁻⁵ 11.1 0.997 8.8 ×10⁻⁵ 22.3 0.994 1.0 ×10⁻⁴ 1.3
1481 0.98 1.6 ×10⁻⁴ 2.8 0.996 2.5 ×10⁻⁴ 10.4 0.98 2.3 ×10⁻⁴ 2.1
1026 0.98 3.9 ×10⁻⁵ 6.7 0.995 6.5 ×10⁻⁵ 28.1 0.98 5.4 ×10⁻⁵ 4.7
740 0.998 6.9 ×10⁻⁵ 25.2 0.96 1.1 ×10⁻⁴ 14.3 0.994 1.1 ×10⁻⁴ 1.4
683 0.996 2.9 ×10⁻⁵ 23.4 0.96 4.0 ×10⁻⁵ 49.9 0.97 3.8 ×10⁻⁵ 9.7
Table 2. Figures of merit obtained in the determination of TCE and TCB with the DOS-based PVC sensing phase (extraction time of 60 min) Wavenumber /
cm-1
Trichloroethylene (TCE) Wavenumber / cm-1
Trichlorobenzene (TCB)
R2 Slope / (L mg-1) LOD / (mg L-1) R2 Slope / (L mg-1) LOD / (mg L-1)
3067 0.98 5.3 ×10⁻⁵ 9.7 3098 0.94 6.6 ×10⁻⁵ 6.3
1590 0.993 1.6 ×10⁻⁵ 18.5 1575 0.992 1.0 ×10⁻⁴ 2.9
935 0.97 8.5 ×10⁻⁵ 5.4 1038 0.98 1.4 ×10⁻⁴ 3.2
844 0.98 5.8 ×10⁻⁵ 2.0 874 0.991 2.8 ×10⁻⁵ 4.3
790 0.97 3.9 ×10⁻⁶ 25.3 819 0.994 1.1 ×10⁻⁴ 0.8
Table 3. Comparison of PVC with other polymers employed as sensing phases for determination of chlorinated hydrocarbons employing mid infrared spectrometry
Sensing Phases Infrared Method Reference
Analyte
Extraction time (min) / LOD (mg L-1)
ClB TCE TCB
PIB ATR 26 20 / 0.163 20 / 0.485
-27 20 / 0.256 20 / 0.681
-17 5 / 1.5 -
-EcoP ATR 19 10 / 0.0855 10 / 0.122 10 / 0.0167
PDMS Transmittance 32 - 60 / 2.7
-Parailm M Transmittance 32 - 300 / 1.6
-Transmittance 31 30 / 0.439 -
-PVC (25% DOS) Transmittance This paper LODnoise 60 / 0.3* 60 / 0.6* 60 / 0.5*
LOD 60 / 1.4* 60 / 2.0* 60 / 0.8*
*values obtained at 1580, 844 and 819 cm-1 for ClB, TCE and TCB, respectively.
and trichlorobenzene, whose results are listed in Table 2. Although the extraction of TCB is impaired due to the high concentration of methanol in the solution, a limit of detection better than that for TCE was usually obtained, a result that can be explained based on the fact that the absorption bands of the plasticiser do not overlap the band of TCB. This overlap impacts the RSD values, which were lower than 15% and 8% for TCE and TCB, respectively.
Table 3 compares the performance of the PVC sensing phase proposed in the present work with others described in the literature for the determination of chlorinated hydrocarbons in water. It is important to emphasize that the limits of detection reported in the literature are based on the IUPAC criteria, which employ the standard deviation of the baseline noise rather than the standard deviation estimated by the blank measurements.31,34 The former approach provides
chlorinated hydrocarbons in water, as it allows simpler operational procedures.
Conclusions
The effects of different plasticisers and their quantities in a PVC sensing phase for determination of chlorinated hydrocarbons were investigated by employing a simple strategy of extraction and transmission measurements in the mid-infrared region. Higher concentrations of plasticiser improved the sensitivity as well as the limits of detection, although films with lower concentrations facilitate manipulation and the extraction procedure. Among the plasticisers investigated, DOS provided sensing phases with better analytical performance than those made with DOP and NPOE. By employing DOS-based PVC sensing phases and extraction times of 60 min, limits of detection of 0.3, 0.6, and 0.5 mg L-1 were obtained for chlorobenzene, trichloroethylene and trichlorobenzene, respectively. Comparing these results with those obtained by employing other polymeric ilms (PDMS, PIB and Parailm M), the PVC sensing phase demonstrates better performance with respect to extraction time and limits of detection when transmittance measurements are employed.
Acknowledgments
The authors are grateful to CAPES/PROCAD, FINEP/CTPETRO, FACEPE and CNPq for financial supports. This is a contribution of the National Institute of Advanced Analytical Science and Technology - INCTAA (CNPq - proc. No. 573894/2008-6 and FAPESP proc. No. 2008/57808-1). Professor Carol H. Collins is also kindly acknowledged for manuscript revision.
References
1. Suwalsky, M.; Rodriguez, C.; Villena, F.; Sotomayor, C. P.;
Food Chem. Toxicol.2005, 43, 647.
2. Almeida, F. V.; Centeno, A. J.; Bisinoti, M. C.; Jardim, W. F.;
Quim. Nova2007, 30, 1976.
3. Martinez, E.; Lacorte, S.; Lobet, I.; Viana, P.; Barceló, D.;
J. Chromatogr., A2002, 959, 181.
4. Florez Menendez, J. C.; Fernandez Sanchez, M. L.; Sanchez Uria, J. E.; Fernandez Martinez, E.; Sanz-Medel, A.; Anal. Chim. Acta2000, 415, 9.
5. Wang, Z.; Li, K.; Fingas, M.; Sigouin, L.; Menard, L.;
J. Chromatogr., A2002, 971, 173.
6. Penton, Z.; J. High Resolut. Chrom. 1992, 15, 834.
7. Alonso, A.; Fernandez-Torroba, M. A.; Tena, M. T.; Pons, B.;
Chromatographia2003, 57, 369.
8. Compton, H.; Proceedings: RCRA Corrective Action Stabilization Technologies;USEPA, 1992, EPA/625/R-92/014,
http://www.epa.gov/epawaste/hazard/correctiveaction/index.htm. 9. Serrano, A.; Gallego, M.; J. Chromatogr., A2004, 1045, 181. 10. Pejcic, B.; Eadington, P.; Ross, A.; Environ. Sci. Technol.2007,
41, 6333.
11. Mizaikoff, B.; Anal. Chem.2003, 75, 258
12. Jakusch, M.; Mizaikoff, B.; Kellner, R.; Katzir, A.; Sens. Actuators, B 1997, 83, 38.
13. Albuquerque, J. S.; Pimentel, M. F.; Silva, V. L.; Raimundo Jr., I. M.; Rohwedder, J. J. R.; Pasquini, C.; Anal. Chem.2005, 77, 72. 14. Jonsson, J. A.; Mathiasson, L.; J. Chromatogr., A 2000, 902,
205.
15. Valente, A. L. P.; Augusto, F.; Quim. Nova2000, 23, 523. 16. Murphy, B.; Kirwan, P.; Mcloughlin, P.; Vib. Spectrosc. 2003,
33, 75.
17. Gobel, R.; Krska, R.; Kellner, R.; Seitz, R. W.; Tomellini, S. A.;
Appl. Spectrosc.1994, 48, 678.
18. Gobel, R.; Seitz, R. W.; Tomellini, S. A.; Krska, R.; Kellner, R.;
Vib. Spectrosc.1995, 8, 141.
19. Roy, G.; Mielczarski, J. A.; Water Res.2002, 36, 1902. 20. Lin, W; Li, Z.; Anal. Chem. 2010, 82, 505.
21. Lima, K. M. G.; Raimundo Jr., I. M.; Pimentel, M. F.; Sens. Actuators, B2007, 125, 229.
22. Silva, A. M. S.; Pimentel, M. F.; Raimundo Jr., I. M.; Almeida, Y. M. B.; Vib. Spectrosc.2008, 46, 39.
23. Silva, A. M. S.; Pimentel, M. F.; Raimundo Jr., I. M.; Almeida, Y. M. B.; Sens. Actuators, B 2009, 139, 222.
24. Pejcic, B.; Myers, M.; Ross, A.; Sensors2009, 9, 6232. 25. Howley, R.; Maccraith, B. D.; O`dwyer, K.; Kirwan, P.;
Mcloughlin, P.; Vib. Spectrosc.2003, 31, 271. 26. Yang, J.; Tsai, S. S.; Anal. Chim. Acta 2002, 462, 235. 27. Yang, J.; Ramesh, A.; Analyst2005, 130, 397.
28. Dobbyn, V.; Howley, R.; Kirwan, P.; McLoughlin, P.; Int. J. Environ. Anal. Chem.2003, 83, 643.
29. Kraft, M.; Mizaikoff, B.; Int.J. Environ. Anal. Chem.2000, 78, 367.
30. Heinrich, P.; Wyzgol, R.; Schrader, B.; Hatzilazaru, A.; Lubbers, D. W.; Appl. Spectrosc. 1990, 44, 1641.
31. Heglund, D.; Tilotta, D. C.; Environ. Sci. Technol.1996, 30, 1212. 32. Merschman, S. A.; Lubbad, S. H.; Tilotta, D. C.; J. Chromatogr., A
1998, 829, 377.
33. Silverstein, R. M.; Webster, F. X.; Spectrometric Identiication of Organic Compounds, 6th ed., John Willey & Sons, Inc.: New
York, 1998.
34. Stahl, D. C.; Tilotta, D. C.; Environ. Sci. Technol.1999, 33, 814
Submitted: November 29, 2010
Published online: April 19, 2011