Genetic divergence of rubber tree estimated by multivariate techniques
and microsatellite markers
Lígia Regina Lima Gouvêa
1, Luciana Benchimol Rubiano
2, Alisson Fernando Chioratto
2,
Maria Imaculada Zucchi
2and Paulo de Souza Gonçalves
11
Programa Seringueira, Instituto Agronômico, Campinas, SP, Brazil.
2
Centro de Pesquisa e Desenvolvimento de Recursos Genéticos Vegetais, Instituto Agronômico,
Campinas, SP, Brazil.
Abstract
Genetic diversity of 60Hevea genotypes, consisting of Asiatic, Amazonian, African and IAC clones, and pertaining to the genetic breeding program of the Agronomic Institute (IAC), Brazil, was estimated. Analyses were based on phenotypic multivariate parameters and microsatellites. Five agronomic descriptors were employed in multivariate procedures, such as Standard Euclidian Distance, Tocher clustering and principal component analysis. Genetic vari-ability among the genotypes was estimated with 68 selected polymorphic SSRs, by way of Modified Rogers Genetic Distance and UPGMA clustering. Structure software in a Bayesian approach was used in discriminating among groups. Genetic diversity was estimated through Nei’s statistics. The genotypes were clustered into 12 groups ac-cording to the Tocher method, while the molecular analysis identified six groups. In the phenotypic and microsatellite analyses, the Amazonian and IAC genotypes were distributed in several groups, whereas the Asiatic were in only a few. Observed heterozygosity ranged from 0.05 to 0.96. Both high total diversity (HT’= 0.58) and high gene differenti-ation (Gst’= 0.61) were observed, and indicated high genetic variation among the 60 genotypes, which may be useful for breeding programs. The analyzed agronomic parameters and SSRs markers were effective in assessing genetic diversity amongHevea genotypes, besides proving to be useful for characterizing genetic variability.
Key words:genealogy, genetic diversity,Hevea brasiliensis,multivariate analysis, SSRs.
Received: May 12, 2009; Accepted: December 17, 2009.
Introduction
TheHeveagenus belongs to the Euphorbiaceae fam-ily and comprises 11 species native to the Amazon region
(Pireset al., 2002).Hevea brasiliensis(Willd. ex Adr. de
Juss.) Muell-Arg. is the only cultivated species and the main source of natural rubber.
Until about 1913, Brazil was the major producer of natural rubber, which was obtained from wild rubber trees growing in the rain forest of the Amazon basin. However, with the introduction of the Wickham material in 1876, Southeast Asia has gradually become the major producer of natural rubber accounting for more than 90% of the total production worldwide. There are approximately 7 to 8 mil-lion hectares of rubber plantations in the rubber areas of Asia and Africa. Genetic improvement through mass selec-tion and modified recurrent selecselec-tion has resulted in the production and release of elite clones, especially from Ma-laysia, over the past 60 years (Onokpise, 2004). Currently,
Hevea brasiliensis is cultivated in several tropical coun-tries, most of which have active plant-breeding programs (Sedgley and Attanayake, 1988).
In the past, there were limited numbers of H.
brasiliensisclones suitable for use as parents in breeding programs, most of those available having already been se-lected according to phenotypic performance. They were crossed in many possible combinations, with posterior se-lection of the most promising families and progenies. Now-adays, an increased number of potential parents are available as a result of substantial breeding efforts and the exchange of clones among research institutions. Conse-quently, a wide range of crosses can now be attempted, this requiring additional resources for the effective exploitation and wise choice of parental clones.
Estimates of genetic divergence, through multivariate analysis of both agronomic characters and molecular mark-ers, should provide valuable data for parent-choice in breeding programs. Multivariate analysis based on pheno-typic data has been used to assess genetic diversity of rub-ber tree (Paiva, 1994; Omokhafe and Alika, 2003), as has also occurred with many other plant species, such as the
as-www.sbg.org.br
Send correspondence to Luciana Benchimol Rubiano. Centro de Pesquisa e Desenvolvimento de Recursos Genéticos Vegetais, Instituto Agronômico, Campinas, Caixa Postal 28, 13012-970 Cam-pinas, SP, Brazil. E-mail: [email protected].
sai palm (Oliveira et al., 2007), coffee (Fonseca et al.,
2006) and bean (Chioratoet al., 2007). More recently,
mo-lecular markers have proved to be useful in estimating ge-netic diversity in a wide range of species and populations. Among molecular markers, microsatellites or SSRs (Sim-ple Sequence Repeats) have received special attention. These, besides being codominant and multi-allelic, are widely distributed throughout genomes, and thus can be
highly polymorphic (Chinet al., 1996). Of particular
inter-est to geneticists and breeders, the SSR markers have been successfully used to infer about genetics, pedigree, phylog-eny, and/or identity of various traits and/or germplasm
ac-cessions (McCouchet al., 2001). SSR markers have been
used to determine genetic diversity in several species,
in-cluding maize (Laborda et al., 2005), rice (Kwon et al.,
2002), common beans (Benchimolet al., 2007) and rubber
trees (Lekawipatet al., 2003; Fenget al., 2009).
The present study reports the suitability of H.
brasiliensis microsatellite markers, developed from the GenBank database, for evaluation of genetic diversity in rubber tree clones. Furthermore, the estimates of molecular genetic divergence were compared with multivariate phe-notypic analysis with the objective of exploring the feasi-bility of using SSRs for identifying superior crosses in breeding programs.
Materials and Methods
SixtyHevea genotypes (Table 1) from the Rubber
Tree Program of the Agronomic Institute (IAC, Campinas, SP, Brazil) were chosen at advanced evaluation phases within genetic breeding programs. The selected genotypes consisted of Asiatic, African, Amazonian and IAC clones. Several of the Asiatic genotypes were derived from the Wickham collection originally introduced into Asia in 1876, and which are known as Wickham clones. The Ama-zonian clones were derived from selection and crossings carried out in Brazil by Ford and The North Agronomic In-stitute. They are the result of crossings among Amazonian and highly productive Asiatic genotypes, with the excep-tion of the RO 45 clone, which was derived from a native plantation exploited for rubber extraction in the state of Rondônia (Brazil). The IAC clones resulted from con-trolled crossings and open pollinations performed in this re-search institute.
Phenotypical multivariate statistical analysis
Average values of five agronomical descriptors, each based on three replicates, were subjected to multivariate analysis. They comprised average of seven years of girth growth increment at juvenile immature phase before tap-ping, average of three years of girth growth increment in adult trees on tapping, average of three years of dry rubber yielding, virgin bark thickness in opened panel tapping; and the total number of latex vessel rings. These data were
col-lected over a period of ten years. Measurements were taken
as described by Gonçalveset al.(2006).
Multivariate procedures consisted of Standard Eu-clidian Distance (SED), Tocher Clustering and Principal Component Analysis (PCA). The contribution of each vari-able to genetic divergence was calculated by the criteria of Singh (1981). Statistical analyses were performed using the Genes software (Cruz, 2006).
SSR development and characterization
Total genomic DNA samples were extracted from powdery lyophilized leaf tissues using the 2% CTAB
method (Hoisingtonet al., 1994) with few modifications. A
total of 470 reads from GenBank were evaluated in the
de-velopment and characterization ofHevea microsatellites.
Redundancies were identified using BLASTN software
search utilities in GenBank (Altschulet al., 1990). The SSR
motifs in the sequences were identified, counted and local-ized by using SSRIT (Simple Sequence Repeat Identifica-tion Tool_ software. A total of 80 primer pairs (Table S1) were developed using Primer Select software from the Lasergene program (DNASTar, Inc.).
PCR amplifications were carried out in a 25mL
vol-ume containing 100 ng of DNA, 1 UTaqDNA polymerase,
1.5 mM MgCl2, 200 mM of a total dNTP mixture and
0.8mM of each forward and reverse primer. Each SSR was
characterized on a gradient amplification profile, by
vary-ing the annealvary-ing temperature (Ta) at a difference of up to
10 °C. After an initial denaturing step of 1 min at 94 °C, the PCR amplification was performed in 30 cycles of 1 min at
94 °C, 1 min at the specificTaand 1 min at 72 °C, followed
by a final extension at 72 °C for 5 min and then kept at 15 °C. Alternatively, some SSRs could only be amplified by Touchdown. Amplification products were resolved on 6% (w/v) denaturing polyacrylamide gels and silver
stained, according to Cresteet al.(2001).
Polymorphism analysis, genetic distances and SSR clustering
Data on the presence (1) or absence (0) of SSR bands were transformed into genotypic data in order to identify loci and alleles. The Polymorphism Information Content (PIC) value for each locus was calculated using the PIC
for-mula = 1 2 2 2 2
1 1 1 1 - -= + =
-=
å
å
å
fi f fi jj i n i n i n
, in whichnis the number
of alleles; andfiandfjare the frequencies of theithandjth
al-leles, respectively (Botsteinet al.1980).
program (Coelho, 2002). The cophenetic coefficients be-tween the genetic distance matrix and the dendrogram de-rived matrix were performed using the NTSYS-pc computer package. The significance of cophenetic correla-tions was tested by applying Mantel correspondence analy-sis. Principal Coordinate Analysis (PCO, Gower 1966) was performed using MRD distance matrix. Genetic diversity
among genotypes was estimated by way of Nei statistics us-ing FSTAT Software.
The SED and MRD dissimilarity matrices were corre-lated using the Genes software (Cruz, 2006). Both the t- and Mantel tests were employed with 10,000 simulations to attribute significance values to the data. Intra- and inter-group correlations were performed using pair-wise genetic
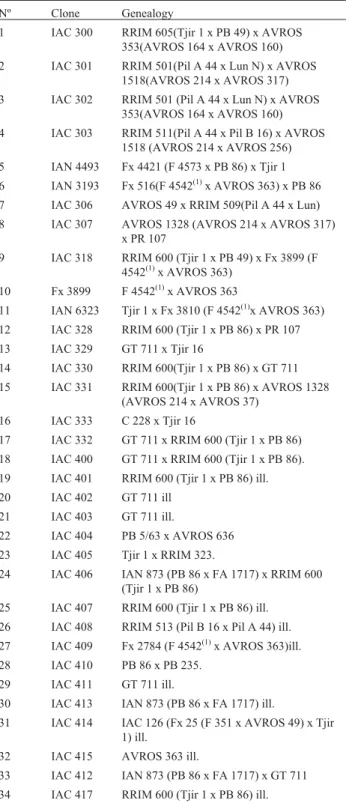
Table 1- Sixty rubber tree genotypes selected in the breeding program of the Instituto Agronômico (IAC) and their respective genealogy.
Nº Clone Genealogy
1 IAC 300 RRIM 605(Tjir 1 x PB 49) x AVROS
353(AVROS 164 x AVROS 160)
2 IAC 301 RRIM 501(Pil A 44 x Lun N) x AVROS
1518(AVROS 214 x AVROS 317)
3 IAC 302 RRIM 501 (Pil A 44 x Lun N) x AVROS
353(AVROS 164 x AVROS 160)
4 IAC 303 RRIM 511(Pil A 44 x Pil B 16) x AVROS
1518 (AVROS 214 x AVROS 256)
5 IAN 4493 Fx 4421 (F 4573 x PB 86) x Tjir 1
6 IAN 3193 Fx 516(F 4542(1)x AVROS 363) x PB 86
7 IAC 306 AVROS 49 x RRIM 509(Pil A 44 x Lun)
8 IAC 307 AVROS 1328 (AVROS 214 x AVROS 317)
x PR 107
9 IAC 318 RRIM 600 (Tjir 1 x PB 49) x Fx 3899 (F
4542(1)x AVROS 363)
10 Fx 3899 F 4542(1)x AVROS 363
11 IAN 6323 Tjir 1 x Fx 3810 (F 4542(1)x AVROS 363)
12 IAC 328 RRIM 600 (Tjir 1 x PB 86) x PR 107
13 IAC 329 GT 711 x Tjir 16
14 IAC 330 RRIM 600(Tjir 1 x PB 86) x GT 711
15 IAC 331 RRIM 600(Tjir 1 x PB 86) x AVROS 1328
(AVROS 214 x AVROS 37)
16 IAC 333 C 228 x Tjir 16
17 IAC 332 GT 711 x RRIM 600 (Tjir 1 x PB 86)
18 IAC 400 GT 711 x RRIM 600 (Tjir 1 x PB 86).
19 IAC 401 RRIM 600 (Tjir 1 x PB 86) ill.
20 IAC 402 GT 711 ill
21 IAC 403 GT 711 ill.
22 IAC 404 PB 5/63 x AVROS 636
23 IAC 405 Tjir 1 x RRIM 323.
24 IAC 406 IAN 873 (PB 86 x FA 1717) x RRIM 600
(Tjir 1 x PB 86)
25 IAC 407 RRIM 600 (Tjir 1 x PB 86) ill.
26 IAC 408 RRIM 513 (Pil B 16 x Pil A 44) ill.
27 IAC 409 Fx 2784 (F 4542(1)x AVROS 363)ill.
28 IAC 410 PB 86 x PB 235.
29 IAC 411 GT 711 ill.
30 IAC 413 IAN 873 (PB 86 x FA 1717) ill.
31 IAC 414 IAC 126 (Fx 25 (F 351 x AVROS 49) x Tjir
1) ill.
32 IAC 415 AVROS 363 ill.
33 IAC 412 IAN 873 (PB 86 x FA 1717) x GT 711
34 IAC 417 RRIM 600 (Tjir 1 x PB 86) ill.
Nº Clone Genealogy
35 IAC 418 RRIM 600 (Tjir 1 x PB 86) ill.
36 IAC 420 IAN 873 (PB 86 x FA 1717) ill.
37 IAC 421 IAC 157 [Fx 505(F 4542(1)x AVROS 363) x
Fx 25 (F351 x AVROS 49) ill.
38 IAC 422 RRIM 513 (Pil B 16 x Pil A 44) ill.
39 IAC 423 IAC 90 [RRIM 507(Pil B 84 x Pil A 44) x Fx
25(F 351 x AVROS 49) ill.
40 IAC 424 RRIM 600 (Tjir 1 x PB 86) ill.
41 IAC 425 RRIM 600 (Tjir 1 x PB 86) ill.
42 IAN 3156 Fx 516 (F 4542(1)x AVROS 363) x PB 86
43 RO 45 Primary clone
44 IAC 40 RRIM 608 (AVROS 33 x Tjir 1) x AVROS
1279 (AVROS 156 x AVROS 374)
45 RRIM 701 44/553 x RRIM 501 (Pil A 44 x Lun N)
46 PB 235 PB 5/51 x PB S/78
47 GT 1 Primary clone
48 IAN 873 PB 86 x FA 1717
49 RRIM 600 Tjir 1 x PB 86
50 IRCA 130 PB 5/51 X IR 22
51 IAC 15 RRIM 504 (Pil A 44 x Lun N) x RRIM 600
(Tjir 1 x PB 86)
52 IAC 35 Fx 25 (F 351 x AVROS 49) x RRIM 600
(Tjir 1 x PB 49)
53 IAC 41 RRIM 608 (AVROS 33 x Tjir1) x AVROS
1279 (AVROS 256 x AVROS 374)
54 IAC 44 IAN 2325[PB 86 x Fx 3933 (F4542(1)x
AVROS 363)] x AVROS 1328(AVROS 214 x AVROS 3170]
55 PR 255 Tjir 1 X PR 107
56 PR 261 Tjir 1 X PR 107
57 PB 217 PB 5/51 X PB 69
58 IAN 3703 Fx 4371 [Fx 3472(F 4542(1)x PB 86) x PB
86] x PB 86
59 IRCA 111 PB 5/51 x RRIM 600 (Tjir 1 x PB 49)
60 PB 28/59 PBIG seedling
(1)
Primary clone ofHevea benthamiana.
distances within and among groups, separated according to the group association pattern observed in the dendrogram (Figure 1).
The Bayesian approach of Pritchardet al.(2000)
im-plemented by Structure software 2.2, was utilized alterna-tively to infer clustering. The number of clusters was
defined fromK= 3 toK= 20, and ten runs of eachKwere
conducted using the admixture model and correlated allele frequencies, a 200,000 burn-in period and 500,000 MCMC.
Ad hocstatistics was related to rate changes in the log
prob-ability of data according to the number ofKs proposed by
Evanoet al.(2005), withDKbeing used as a predictor of the
ideal number of clusters. In addition, the ideal number according to Pritchard and Wen (2004) was used as the cri-terion for defining the number of groups (k). The most trustworthy value was estimated based on the lowest nega-tive number of Ln (the log-likelihood of the data) and the lowest standard deviation found during statistical analysis.
Results
Phenotypic analysis
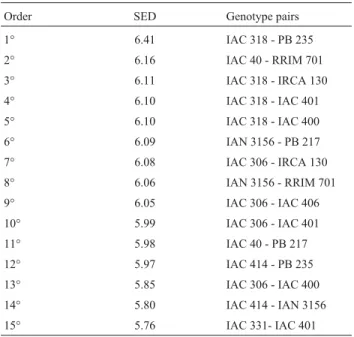
The 15 most divergent genotype pairs identified by
the SED matrix are listed in Table 2.Hevea benthamiana
was a common ancestor for seven of the 15. The most di-vergent genotype pair was IAC 318 - PB 235.
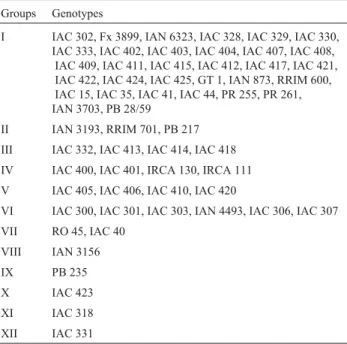
Through Tocher analysis, the 60 rubber-tree geno-types were clustered into 12 groups (Table 3). Among these, the eight Amazon genotypes (IAN 6323, IAN 3156, RO 45, IAN 4493, IAN 3193, IAN 873, IAN 3703 and Fx 3899) were distributed into five groups (I, II, VI, VII, VIII), and the 42 IAC genotypes into nine (I, III, IV, V, VI, VII, X, XI, XII). These results indicate high genetic diversity in the IAC and Amazon genotypes. Diversity in the eight Asiatic genotypes (RRIM 701, GT 1, PR 255, PB 217, RRIM 600, PR 261, PB 28/59 and PB 235) was low, with the majority, except for PB 235, PB 217 and RRIM 701, being allocated to group 1. The two African genotypes (IRCA 111 and IRCA 130) were clustered into one and the same group (IV). In Group 1, 56% of the genotypes proved to have ei-ther of the Indonesian clones, Tjir 1 or GT 711, in their an-cestry. Notwithstanding, ancestry was not considered to be a suitable criterion for characterizing most of the groups.
PCA for phenotypic data accounted for 80.88% of the total variation in the first three principal components. The average dry rubber yield was the variable that contributed
Figure 1- UPGMA cluster analysis of Modified Rogers Genetic
Dis-tances based on data from 68 SSRs, used in the evaluation of the 60 rub-ber-tree genotypes. Bootstrap node support, represented in percentages, shows clustering stability. Numbers (%) on the branches correspond to bootstrap values above 40% (10,000 replications). (Cophenetic va-lue = 0.78).
Table 2- Fifteen pairs of the most divergent genotypes according to
Stan-dard Euclidian Distance (SED), estimated for 60 rubber-tree genotypes and considering five agronomic descriptors.
Order SED Genotype pairs
1° 6.41 IAC 318 - PB 235
2° 6.16 IAC 40 - RRIM 701
3° 6.11 IAC 318 - IRCA 130
4° 6.10 IAC 318 - IAC 401
5° 6.10 IAC 318 - IAC 400
6° 6.09 IAN 3156 - PB 217
7° 6.08 IAC 306 - IRCA 130
8° 6.06 IAN 3156 - RRIM 701
9° 6.05 IAC 306 - IAC 406
10° 5.99 IAC 306 - IAC 401
11° 5.98 IAC 40 - PB 217
12° 5.97 IAC 414 - PB 235
13° 5.85 IAC 306 - IAC 400
14° 5.80 IAC 414 - IAN 3156
15° 5.76 IAC 331- IAC 401
the most in the estimation of the genetic divergence among the 60 genotypes. The number of latex vessel rings was the least important variable, and so could be discarded.
Molecular analysis
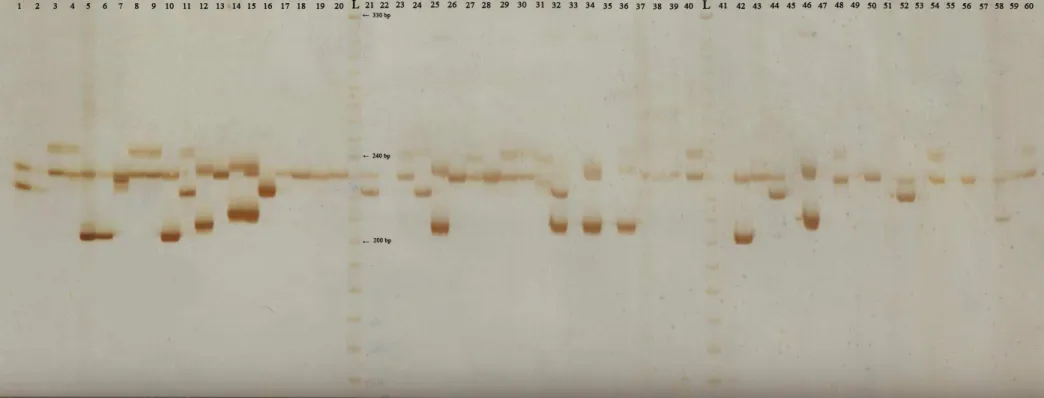
Of the 80 characterized SSRs (Table S1) 68 were polymorphic and informative. In the SSR IAC-Hv34 geno-type, two distinct bands were amplified and considered as two distinct loci (Hv34a, Hv34b). Thus, 69 polymorphic and informative SSR loci were identified and character-ized. The electrophoretic profile obtained with SSR IAC--Hv72 can be observed in Figure S1. Polymorphic information content varied from 0.11 to 0.87, with an aver-age of 0.57. The mean allele number per locus was 5.88, ranging from 2 to 13, the extremes being attributed to SSR IAC-Hv36 and SSR IAC-Hv20, respectively.
Six SSRs (Hv67, Hv68, Hv76, IAC-Hv44, IAC-Hv69 and IAC-Hv66) were efficient at
ampli-fying Hevea pauciflora, and showed transferability in
relation toHevea brasiliensis, using the same PCR
amplifi-cation procedure.
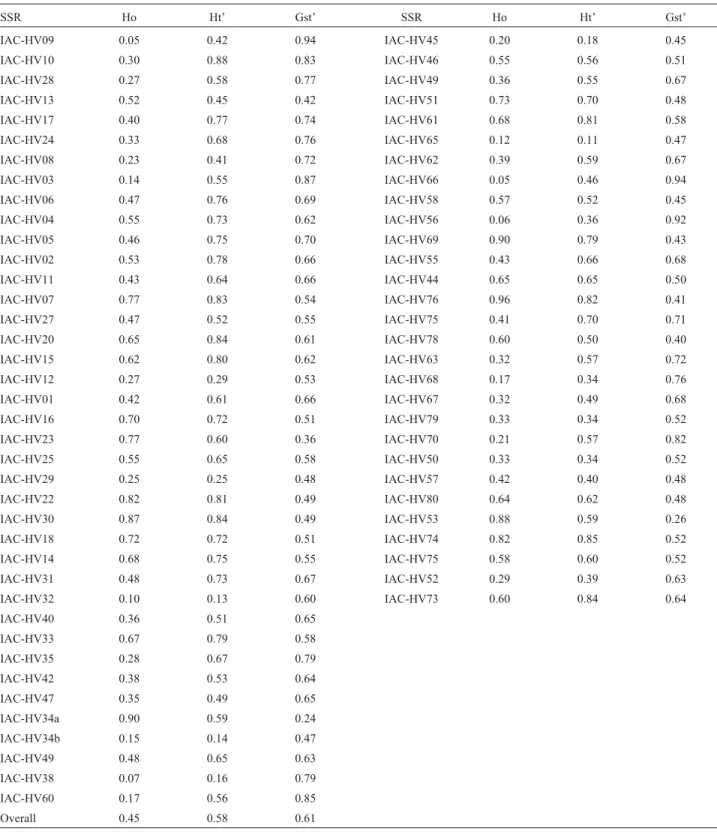
Observed heterozygosity (Ho) based on Nei’s
esti-mates varied from 0.05 to 0.96, with an average of 0.45
(Ta-ble 4). Extreme Hovalues were encountered in SSR
IAC-HV09, IAC-HV66 and IAC-HV76. High total diversity
(HT’= 0.58) and high gene differentiation (Gst’= 0.61) were
observed among all the 60 genotypes. SSR PCO accounted for 19.66% of the total variation in the first three axes. When selecting the most divergent pairwise distance in the Rogers modified genetic distance matrix (Table 5), IAC 414 appeared in eight of the pairwise distances. Den-drogram analyses (Figure 1) revealed six distinct groups. The eight Asiatic genotypes (RRIM 701, GT 1, PR 255, PB 217, RRIM 600, PR 261, PB 28/59 and PB 235) were dis-tributed in only two groups (II, V). The African genotypes (IRCA 111 and IRCA 130) were clustered in group II. On the other hand, all the IAC genotypes were distributed among four groups (I, II, III and VI) while the eight evalu-ated Amazonian genotypes (IAN 873, IAN 6323, IAN 4493, IAN 3193, Fx 3899, IAN 3156, RO 45 and IAN 3709) were distributed in groups I, II, III and IV.
Bootstrap analysis expressed high statistical node support for genotypes with shorter distances (Figure 2). The cophenetic correlation was r = 0.78 (p < 0.002). Groups were clearly distinguished, with several clusters being sup-ported by high bootstrap values. Bootstrap analysis and cophenetic correlations indicated that SSR dendrogram clustering accurately depicted estimated genetic distances among rubber-tree genotypes. Group 1 contained all the ge-notypes derived from the AVROS clones. Group 2 com-prised genotypes with either the GT 711 or RRIM 600 clone in their ascendancy. All the GT 711 derived geno-types were clustered in Group 2, and all the RRIM 600, but one (IAC 318), in Group 1. The IAC 400 genotypes were clustered in Group 2, except for two that were positioned in Group 6. The Amazonian genotypes IAN 4493, IAN 3193 and Fx 3899 were clustered in Group 3. Group 4 included the other three Amazonian clones IAN 3156, RO 45 and IAN 3703. The Wickham clones RRIM 701, GT1, PR 255 and PB 217 were gathered in Group 5. The IAC 414 and IAC 422 clones, placed in Group 6, were the only ones of the IAC 400 series outside Group 2.
A total of six groups were identified byDKas being
the ideal number of groups, as previously proposed by
Evanoet al.(2005), and according to criteria indicated by
Pritchard and Wen (2004). In an investigation of correspon-dence between the dendrogram and structure groups
Figure 2- Representation of the number of ideal clusters identified by
Structure software according to the methodology of Evanoet al.(2005).
The analysis was based on 68 SSRs utilized in the evaluation of the 60 rub-ber-tree genotypes.
Table 3- Clustering of 60 rubber-tree genotypes by the Tocher method
and based on dissimilarity estimated by Standard Euclidian Distance (SED), using five agronomic descriptors.
Groups Genotypes
I IAC 302, Fx 3899, IAN 6323, IAC 328, IAC 329, IAC 330,
IAC 333, IAC 402, IAC 403, IAC 404, IAC 407, IAC 408, IAC 409, IAC 411, IAC 415, IAC 412, IAC 417, IAC 421, IAC 422, IAC 424, IAC 425, GT 1, IAN 873, RRIM 600, IAC 15, IAC 35, IAC 41, IAC 44, PR 255, PR 261, IAN 3703, PB 28/59
II IAN 3193, RRIM 701, PB 217
III IAC 332, IAC 413, IAC 414, IAC 418
IV IAC 400, IAC 401, IRCA 130, IRCA 111
V IAC 405, IAC 406, IAC 410, IAC 420
VI IAC 300, IAC 301, IAC 303, IAN 4493, IAC 306, IAC 307
VII RO 45, IAC 40
VIII IAN 3156
IX PB 235
X IAC 423
XI IAC 318
XII IAC 331
(Figure 3), group 1 of the dendrogram corresponded entirely to Structure group 1, and included genotypes derived from crosses of enhanced clones from the Rubber Research Insti-tute of Malaysia (RRIM) and Algemene Verneiging Rubber
planters Oostkust Sumatra of Indonesia (AVROS). Group 2 in the dendrogram corresponded to Structure groups 2, 3 and 5. Dendrogram group 3 corresponded to Structure group 4, and was characterized by Amazonian clones. Dendrogram group
Table 4- Gene diversity analysis of 60 rubber tree genotypes of the breeding program of the Instituto Agronômico (IAC) estimated by SSRs.
SSR Ho Ht’ Gst’ SSR Ho Ht’ Gst’
IAC-HV09 0.05 0.42 0.94 IAC-HV45 0.20 0.18 0.45
IAC-HV10 0.30 0.88 0.83 IAC-HV46 0.55 0.56 0.51
IAC-HV28 0.27 0.58 0.77 IAC-HV49 0.36 0.55 0.67
IAC-HV13 0.52 0.45 0.42 IAC-HV51 0.73 0.70 0.48
IAC-HV17 0.40 0.77 0.74 IAC-HV61 0.68 0.81 0.58
IAC-HV24 0.33 0.68 0.76 IAC-HV65 0.12 0.11 0.47
IAC-HV08 0.23 0.41 0.72 IAC-HV62 0.39 0.59 0.67
IAC-HV03 0.14 0.55 0.87 IAC-HV66 0.05 0.46 0.94
IAC-HV06 0.47 0.76 0.69 IAC-HV58 0.57 0.52 0.45
IAC-HV04 0.55 0.73 0.62 IAC-HV56 0.06 0.36 0.92
IAC-HV05 0.46 0.75 0.70 IAC-HV69 0.90 0.79 0.43
IAC-HV02 0.53 0.78 0.66 IAC-HV55 0.43 0.66 0.68
IAC-HV11 0.43 0.64 0.66 IAC-HV44 0.65 0.65 0.50
IAC-HV07 0.77 0.83 0.54 IAC-HV76 0.96 0.82 0.41
IAC-HV27 0.47 0.52 0.55 IAC-HV75 0.41 0.70 0.71
IAC-HV20 0.65 0.84 0.61 IAC-HV78 0.60 0.50 0.40
IAC-HV15 0.62 0.80 0.62 IAC-HV63 0.32 0.57 0.72
IAC-HV12 0.27 0.29 0.53 IAC-HV68 0.17 0.34 0.76
IAC-HV01 0.42 0.61 0.66 IAC-HV67 0.32 0.49 0.68
IAC-HV16 0.70 0.72 0.51 IAC-HV79 0.33 0.34 0.52
IAC-HV23 0.77 0.60 0.36 IAC-HV70 0.21 0.57 0.82
IAC-HV25 0.55 0.65 0.58 IAC-HV50 0.33 0.34 0.52
IAC-HV29 0.25 0.25 0.48 IAC-HV57 0.42 0.40 0.48
IAC-HV22 0.82 0.81 0.49 IAC-HV80 0.64 0.62 0.48
IAC-HV30 0.87 0.84 0.49 IAC-HV53 0.88 0.59 0.26
IAC-HV18 0.72 0.72 0.51 IAC-HV74 0.82 0.85 0.52
IAC-HV14 0.68 0.75 0.55 IAC-HV75 0.58 0.60 0.52
IAC-HV31 0.48 0.73 0.67 IAC-HV52 0.29 0.39 0.63
IAC-HV32 0.10 0.13 0.60 IAC-HV73 0.60 0.84 0.64
IAC-HV40 0.36 0.51 0.65
IAC-HV33 0.67 0.79 0.58
IAC-HV35 0.28 0.67 0.79
IAC-HV42 0.38 0.53 0.64
IAC-HV47 0.35 0.49 0.65
IAC-HV34a 0.90 0.59 0.24
IAC-HV34b 0.15 0.14 0.47
IAC-HV49 0.48 0.65 0.63
IAC-HV38 0.07 0.16 0.79
IAC-HV60 0.17 0.56 0.85
Overall 0.45 0.58 0.61
Ho: observed heterozygosity. Ht’: total heterozygosity.
5 and 6 corresponded to Structure group 6, and included four clones of the Wickham collection.
An interesting clustering aspect, as revealed by the structure program, was the distribution of the Amazonian and IAC genotypes into several groups, viz., I, III, IV, V and I, II, III, IV, V, VI, respectively, whereas the Asiatic genotypes (RRIM 701, GT 1, PR 255, PB 217, RRIM 600, PR 261, PB 28/59, PB 235) were distributed into only two groups (III, VI). This distribution pattern is in agreement with the data obtained through Tocher analysis of pheno-typic data and the UPGMA dendrogram based on SSRs.
Matrix correlation between both kinds of genetic dis-tances was significant by t-test and Mantel test (r = 0.13, p < 0.01). Genetic distances estimated from phenotypic and molecular traits were correlated. Pair-wise distances within and among groups were separated in the dendrogram ac-cording to the respective group association pattern (Figu-re 1). Significant values we(Figu-re found for intra-Group 2 correlations (r = 0.165, p < 0.01) and for inter-Group 1x3 correlation (r = 0.565, p < 0.01); inter-Group 1x5 (r = 0.547, p < 0.01) and inter-Group 1x6 (r = 0.620, p < 0.05).
Discussion
Phenotypic analysis
Standard Euclidian Distances (SED) detected higher divergence between the clone IAC 318 and the Asiatic clone PB 235, the latter having been derived from a cross-ing between two Malayan clones. This dissimilarity possi-bly occurred through IAC 318 has the clone Fx 3899 as
male parental, which is an interspecific hybrid of H.
benthamiana x H. brasiliensis (Table 1). Among the 15
pairs of most divergent genotypes (Table 2), H.
benthamianaappears as the ancestor in seven pairs. Hy-bridization may have several evolutionary consequences, these possibly including increased intra-specific genetic di-versity (Rieseberg, 1997).
Total variance (80.8%), as explained by the three principal components of the phenotypic data, was expres-sive. However, it was less than that described by Paiva (1994), consisting of 94.76% and 97.49% data variance in the first three components with eight and seven descriptors, respectively. The number and nature of variables certainly have to be taken into consideration on comparing relative final variance.
Molecular analysis
Polymorphic information content was high for SSR loci, and indicated a substantial genetic information content in the clones analyzed with microsatellites. Microsatellite
Figure 3- Distribution of the 60 rubber-tree genotypes in groups according to Structure analysis (k = 6), based in 68 SSRs used in the evaluation of the 60 rubber-tree genotypes. The individuals were represented by vertical bars, each color being associated to a different group. Genotype identification is re-ferred to in Table 1.
Table 5- Fifteen pairs of the most divergent rubber-tree genotypes
ac-cording to Modified Rogers Genetic Distance (MRD) estimated among 60 rubber-tree genotypes evaluated with 68 SSRs.
Order MRD Genotype Pairs
1st 0.74 IAC 328 - PB 217
2nd 0.73 IAC 414 - IAC 41
3rd 0.73 IAC 414 - PB 217
4th 0.72 IAC 418 - RRIM 701
5th 0.72 IAC 330 - RRIM 701
6th 0.72 Fx 3899 - PB 217
7th 0.72 IAC 328 - IAC 414
8th 0.71 Fx 3899 - PR 255
9th 0.71 IAC 408 - IAC 414
10th 0.71 IAC 422 - IRCA 130
11th 0.71 IAC 401 - IAC 414
12th 0.70 IAC 333 - RRIM 701
13th 0.70 IAC 331 - IAC 414
14th 0.70 IAN 4493 - IAC 414
15th 0.70 IAC 414 - PR 261
marker analysis is very efficient when examining genetic
diversity (Labordaet al., 2005; Sahaet al., 2005). PIC
val-ues for SSR loci were superior to those observed by Fenget
al. (2009) when using EST-SSRs to analyze cultivated
clones in rubber trees. Accordingly, PIC values ranged from 0 to 0.684 and averaged 0.383. As expected, EST-SSRs have been reported as being less polymorphic than genomic SSRs in crop plants due to DNA sequence
conser-vation in transcribed regions (Scottet al., 2000; Eujaylet
al., 2001). The mean allele number found in this study was
5.88, varying from 2 to 13. This result was similar to the previously reported 5.92, which varied from 3 to 10, in a set
of cultivated genotypes (Lekawipatet al., 2003), and higher
than the average of 2.47 alleles observed by Fenget al.
(2009), when using EST-SSRs.
Gene differentiation (GST’ = 0.61) was high,
indicat-ing 61% of total variation to be exploited among the avail-able genotypes. A total of 52 SSRs presented high
coefficients of genetic differentiation (GST’ > 0.50). This
value was higher than that observed for other open polli-nated species belonging to the same family as rubber trees,
such as cassava (Fregeneet al., 2003; Lokkoet al., 2006).
Observed heterozygosity was more variable than that
de-scribed by Sahaet al.(2005) in a cultivated rubber tree
ge-notype when using four SSR markers, and therefore considered highly informative. This probably accounts for the lower variation observed.
Genomic transferability of the SSRlocibetweenH.
brasiliensis andH. pauciflora indicated that these SSRs
could be useful for studies of synteny within theHevea
ge-nus. Sahaet al.(2005) also observed that SSRs specifically
developed for H. brasiliensis efficiently amplified H.
benthamianaandH. spruceana, thereby implying the high conservation of flanking microsatellite genomic regions.
More recently, Fenget al.(2009) developed EST-SSRs for
H. brasiliensis, and observed interspecies transferability by
amplifyingH. spruceana,H. nitida,H. benthamianaandH.
pauciflora, and intergenus transferability in castor oil
plants (Ricinus communis L.) and cassava (Manihot
utilissima).
What makes the Bayesian approach interesting in the study of population genetic structures is the facility in de-tection without the need for prior information on individual
origin (Pritchardet al., 2000). When considering all the
in-dividuals and clustering in Structure atK = 6, the
arrange-ment was such as to correspond to dendrogram clustering. The coherence in genotype clusters indicated a non-random distribution of alleles and their frequencies. In fact, clones in most groups were gathered according to ascendancy as previously described. The lack of consistency in various dendrogram clusters could be associated to low bootstrap node support (with 10,000 re-samplings) in some of the ma-jor groups. Low bootstrap nodes could be associated with the lack of genetic structure, and the incapacity of a clearing clustering tendency supported by high cophenetic values.
Phenotypic and Molecular analysis
On comparing phenotypic and molecular clustering patterns (Table 3; Figure 1), molecular markers have proved to be very efficient in group characterization by ge-nealogy. In rubber tree studies using molecular markers
(Vargheseet al., 1997; Fenget al., 2009), genealogy has
also been used as an aid in group characterization, although not always with satisfactory results. In this work, illegiti-mate genotypes derived from open pollination with the same female parental, whereas those legitimate were the re-sult of controlled pollination, with both common parental
belonging to separate groups. According to Vargheseet al.
(1997)Heveabeing a predominantly cross-pollinated tree
species, has F1 hybrids fixed vegetatively while clones are highly heterozygous. As a result of segregation and inde-pendent assortment in these clones, the proportion of mar-ker alleles in the F1 hybrid from each parent can vary considerably. Thus, in highly heterozygous species with a common ancestry, pedigree information may not always re-veal the exact nature of genetic relationships.
In phenotypic and microsatellite analyses, both the Amazonian and IAC genotypes were clustered into several groups, thereby indicating high genetic diversity among these genotypes. On the other hand, Asiatic genotypes were distributed in only a few groups, thus indicating low
diver-sity, with, most certainly, a narrow genetic base (Besseet
al., 1994; Vargheseet al., 1997). Molecular analysis
indi-cated the close relationship between African and Asiatic genotypes, thereby confirming their Asiatic genetic base
(Besseet al., 1994). The data confirmed a narrow genetic
base for the Asiatic and African genotypes and high genetic variability for the Amazonian genotypes. This higher ge-netic variability in wild Amazonian genotypes was ex-pected, although it is not always associated to desirable
agronomic breeding characters. Clément-Demangeet al.
(2001) reported that Amazonian wild genotypes do not al-ways contribute desirable traits to rubber tree genetic breeding. Even though, Amazonian wild genotypes were introduced into rubber tree breeding by crossing, so as to widen the genetic basis of Asiatic clones. The Amazonian genotypes evaluated in this study arose from prior breeding and selection procedures, thereby possibly constituting an interesting genetic background to be exploited in rubber tree breeding programs. Indeed, these clones showed the highest genetic diversity when compared to the other im-proved clones analyzed, and appear to be attractive for rub-ber breeding.
The most divergent genotypes identified in SED anal-ysis (Table 2) differed from those identified through MRD
analysis (Table 5). H. benthamiana was an ancestor in
Asi-atic genotypes ancestry was predominant in the majority of the evaluated rubber tree clones, higher genetic divergence was observed in those genotypes derived from inter-spe-cific crosses performed in the past, as well as those having the Fx 25 clone as ancestor. The data indicated the strong contribution of these two genotypes to genetic divergence as described in this study. Further analysis should be under-taken to confirm these findings.
Although both phenotypic and molecular analysis revealed differences in genotype clustering, they shared several common aspects, such as high diversity between Amazonian and IAC genotypes and low among Asiatic. Most likely, the difference in genotype clustering was due to agronomic descriptors being associated to gene expres-sion and may suffer environmental influence modulating the phenotype. In contrast, molecular markers, including microsatellites, are mostly neutral and consist of either ex-pressed DNA sequences, or non-exex-pressed genomic re-gions such as introns or regulatory sites. In agreement with Moser and Lee (1994), as a result of the complex nature of the relationship between phenotypic and genotypic varia-tion, genotypes that are phenotypically different may vary at only a few loci, and those very similar in appearance or performance may be quite dissimilar genetically. In addi-tion and as reported by Grivet and Noyer (2003), the rela-tionship between neutral polymorphism revealed by mark-ers and the polymorphism of useful morpho-agronomic characters is not clear. Markers revealed sequence similar-ity between individuals in a sample of a locus. Morpho-agronomic characters measure resemblances between indi-viduals based on variables whose level of expression de-pends on the number of potentially epistatic genes.
Despite being significant, matrix correlation for all genetic distances of different marker systems exhibited poor association, which was also observed by Roldán-Ruiz
et al.(2001). Taking into account the molecular dendro-gram clustering and correlated genotypes, significant
asso-ciations were detected between intergroup genetic
distances (phenotypic and SSR-based GDs) in Groups 1x3; 1x5 and 1x6. Currently, associations between molecular and phenotypic data tend to be stronger in crosses between
genotypes of similar pedigrees (Smithet al., 1990).
Cer-tainly, correlations between phenotypic-based and molecu-lar-based distances will be improved as additional probes or marker loci are employed in analysis (Moser and Lee, 1994).
The genotypes analyzed in the present work had been previously selected and evaluated in breeding programs, and had demonstrated good performance. Thus, prior screening of the most divergent genotype pairs identified through both methods is suggested for evaluation of the rel-ative agronomic performance of their hybrids. In a tradi-tional breeding program, thousands of crosses are normally performed and evaluated in experimental designs. Accord-ing to the data described in this work, SSR-based genetic
distances could be useful in selecting superior crosses be-tween rubber tree clones derived from a population with a broad genetic base. Hence, the application of SSR markers in rubber-tree breeding could be instrumental in reducing the number of single-cross hybrids to be evaluated. SSRs are easily assayed by the Polymerase Chain Reaction, and have proved to constitute a potent tool for characterizing genetic diversity. Furthermore, in perennial plant species, such as rubber trees, this molecular marker technology has the additional advantage of shortening breeding time by al-lowing for the screening of seedlings and juvenile plants.
Acknowledgments
The authors are grateful to the directors of APTA/REGIONAL (IAC), where field experiments were conducted and to Dr. Eduardo F. Formighieri for assisting with BlastN analysis. This research was supported by grants from the Fundação de Amparo à Pesquisa do Estado
de São Paulo (FAPESP, proc. no 2006/61847-7,
1996/01268-0, 2005/59586-8, 2008/50490-6). Dr. P. de S. Gonçalves is a fellowship holder of the Conselho Nacional de Desenvolvimento Científico e Tecnológico (CNPq, proc. 307352/2006-4).
References
Altschul SF, Gish W, Miller W, Myers EW and Lipman DJ (1990) Basic local alignment search tool. J Mol Biol 215:403-410. Benchimol LL, Campos T, Carbonell SAM, Colombo CA,
Chio-ratto AF, Formighieri EF, Gouvêa LRL and Souza AP (2007) Structure of genetic diversity among common bean (Phaseolus vulgarisL.) varieties of Mesoamerican and An-dean origins using new developed microsatellite markers. Genet Resour Crop Evol 54:1747-1762.
Besse P, Seguin M, Lebrun P, Chevallier MH, Nicolas D and Lanaud C (1994) Genetic diversity among wild and culti-vated populations ofHevea brasiliensisassessed by nuclear RFLP analysis. Theor Appl Genet 88:199-207.
Botstein D, White RL, Skolnick M and Davis RW (1980) Con-struction of a genetic map in man using restriction fragment length polymorphism. Am J Hum Genet 32:314-331. Chin ECL, Senior ML, Shu H and Smith JSC (1996) Maize simple
repetitive DNA sequences: Abundance and allele variation. Genome 39:866-873.
Chiorato AF, Carbonell SAM, Benchimol LL, Chiavegato MB, Dias LAS and Colombo CA (2007) Genetic diversity in common bean accessions evaluated by means of morpho-agronomical and RAPD data. Sci Agric 64:256-262. Clement-Demange A, Legnaté H, Seguin M, Carron MP, Le Guen
V, Chapuset T and Nicolas D (2001) Rubber tree. In: Charri-er A, Jacquot M, Hamon S and Nicolas D (eds) Tropical Plant Breeding. Science Publishers, Montpellier, pp 455-480.
Creste S, Tulmann-Neto A and Figueira A (2001) Detection of single sequence repeat polymorphisms in denaturing poly-acrylamide sequencing gels by silver staining. Plant Mol Biol Rep 19:299-306.
Cruz CD (2006) Programa Genes: Multivariate Analysis and Sim-ulation. Editora UFV, Viçosa, 175 pp.
Eujayl I, Sorrells M, Baum M, Wolters P and Powell W (2001) Assessment of genotypic variation among cultivated durum wheat based on EST-SSRs and genomic SSRs. Euphytica 119:39-43.
Evano G, Regnaut S and Goudet J (2005) Detecting the number of clusters of individuals using the software structure: A simu-lation study. Mol Ecol 14:2611-2620.
Feng SP, Li WG, Huang HS, Wang JY and Wu YT (2009) Devel-opment, characterization and cross-species/genera transfer-ability of EST-SSR markers for rubber tree. Mol Breed 23:85-97.
Fonseca AFA, Sediyama T, Cruz CD, Sakaiyama NS, Ferrão MAG, Ferrão RG and Bragança SM (2006) Divergência genética em café conilon. Pesq Agropec Bras 41:599-605. Fregene MA, Suarez M, Mkumbira J, Kulembeka H, Ndedya E,
Kullaya A, Mitchel S, Gullberg U, Rosling H, Dixon AG,et al.(2003) Simple sequence repeat marker diversity in cas-sava landraces: Genetic diversity and differentiation in an asexually propagated crop. Theor Appl Genet 107:1083-1093.
Gonçalves PS, Aguiar ATE and Gouvêa LRL (2006) Expressão fenotípica de clones de seringueira na região Noroeste do Estado de São Paulo. Bragantia 65:289-398.
Goodman MM and Stuber CW (1983) Races of maize VI. Isozy-me variation among races of maize in Bolívia. Maydica 28:169-187.
Gower JC (1966) Some distant properties of latent root and vector methods used in multivariate analysis. Biometrika 53:325-338.
Grivet L and Noyer JL (2003) Biochemical and molecular mark-ers. In: Hamon P, Seguin M, Perrier X and Glazmann JC (eds) Genetic Diversity of Cultivated Tropical Crops. CIRAD & Science Publishers Inc., Montpellier and Enfield, pp 1-17.
Hoisington D, Khairallah M and Gonzalez-De-Lion D (1994) Laboratory Protocols: CIMMYT Applied Molecular Genet-ics Laboratory. 2nd edition. CIMMYT, Mexico, 86 pp. Kwon SJ, Ha WG, Hwang SJ, Yang HC, Choi HP and Moon SN
(2002) Relationship between heterosis and genetic diver-gence in `Tongil’-type rice. Plant Breed 121:487-492. Laborda PR, Oliveira KM, Garcia AAF, Paterniani MEAGZ and
Souza AP (2005) Tropical maize germplasm: What can we say about its genetic diversity in the light of molecular mark-ers? Theor Appl Genet 111:1288-1299.
Lekawipat N, Teerawatanasuk MM, Rodier-Goud MSN, Vana-vichit A, Toojinda T and Tragoonrung S (2003) Genetic di-versity analysis of wild germplasm and cultivated clones of Hevea brasiliensis Muell. Arg. by using microsatellite markers. J Rubber Res 6:36-47.
Lokko Y, Dixon A, Offei S, Danquah E and Fregene M (2006) As-sessment of genetic diversity among African cassava Manihot esculentaCrantz accessions resistant to the cassava mosaic virus disease using SSR markers. Genet Resour Crop Evol 53:1441-1453.
McCouch SR, Temnykh S, Lukashova A, Coburn J, Declerck G, Cartinhour S, Harrington S, Thomson M, Septiningsi E, Semon M, et al. (2001) Microsatellite markers in rice: Abundance, diversity and applications. In: Khush GS, Brar DS and Hardy B (eds) Rice Genetics IV. Science Publishers, Manila, pp 117-136.
Moser H and Lee M (1994) RFLP variation and genealogical dis-tance, multivariate disdis-tance, heterosis and genetic variance in oats. Theor Appl Genet 87:947-986.
Oliveira MSP, Ferreira DF and Santos JB (2007) Divergência genética entre acessos de açaizeiro fundamentada em des-critores morfoagronômicos. Pesq Agropec Bras 42:501-506. Omokhafe KO and Alika JE (2003) Phenetic relationship of
rub-ber tree clones. Biol Plantarum 46:217-222.
Onokpise OU (2004) Natural rubber,Hevea brasiliensis(Willd. ex a. Juss.) Müll. Arg., Germplasm collection in the Amazon basin, Brazil: A retrospective. Econ Bot 58:544-555. Paiva JR (1994) Divergência genética entre clones primários de
seringueira. Pesq Agropec Bras 29:607-615.
Pires JM, Secco RS and Gomes JI (2002) Taxonomia e fitogeo-grafia das seringueirasHeveaspp. Embrapa Amazônia Ori-ental, Belém, 103 pp.
Pritchard JK, Stephens M and Donnelly P (2000) Inference of population structure using multilocus genotype data. Genet-ics 155:945-959.
Rieseberg LH (1997) Hybrid origins of plant species. Annu Rev Ecol Syst 28:359-389.
Roldán-Ruiz I, Euwijk FA, Gilliland TJ, Dubreuil P, Dillmann C, Lallemand J, Loose M and Baril CP (2001) A comparative study of molecular and morphological methods of describ-ing relationships between perennial ryegrass (Lolium perenneL.) varieties. Theor Appl Genet 103:1138-1150. Saha T, Bindu-Roy C and Nazeer MA (2005) Microsatellite
vari-ability and its use in the characterization of cultivated clones ofHevea brasiliensis. Plant Breed 124:86-92.
Scott KD, Eggler P, Seaton G, Rossetto M, Ablett EM, Lee LS and Henry RJ (2000) Analysis of SSRs derived from grape ESTs. Theor Appl Genet 100:723-726.
Sedgley M and Attanayake DPSTG (1988) The breeding system of rubber (Hevea brasiliensis): An evaluation of controlled hand pollination methods. Euphytica 39:83-91.
Singh DA (1981) The relative importance of characters affecting genetic divergence. Indian J Genet Plant Breed 41:237-245. Smith OS, Smith JSC, Bowen SL, Tenborg RA and Wall SJ
(1990) Similarities among a group of elite maize inbreds as measured by pedigree, F1 grain yield, heterosis, and RFLPs. Theor Appl Genet 80:833-840.
Varghese YA, Knaak C, Sethuraj MR and Ecke W (1997) Evalua-tion of random amplified polymorphic DNA (RAPD) mark-ers inHevea brasiliensis. Plant Breed 116:47-52.
Internet Resources
FSTAT Software, http://www.unil.ch/izea/softwares/fstat.html (June 15, 2008).
SSRIT Software, http://www.gramene.org/db/searches/ssrtool (March 25, 2007).
STRUCTURE Software, http://cbsuapps.tc.cornell.edu/struc-ture.aspx (February 20, 2009).
Pritchard JK and Wen W Documentation for structure software: Version 2.1. Available in: http://pritch.bsd.uchicago.edu. (March 27, 2009).
NTSYS-pc Software, http://pritch.bsd.uchicago.edu (June 25, 2008).
Supplementary Material
The Following online material is available for this ar-ticle:
- Table S1 - Sequence of primers and gene annota-tions.
- Figure S1 - SSR IAC-Hv72 electrophoretic profile of rubber tree genotypes on 6% polyacrylamide gel.
This material is available as part of the online article from http://www.scielo.br/gmb.
Associate Editor: Everaldo Gonçalves de Barros
2 AF383944 IAC-Hv02 (gt)19 CAGTAGAAAGGGGAATC AACACTGAAAACAACAATG 55.0 11 0.773 130-170
3 AF486730 IAC-Hv03 (ga)21 AGTTACAACAATCATCATCTG ATAAAGTCTTGGGAAAACAT 58.0 5 0.538 300-306
4 AY439312 IAC-Hv04 (ag)20 AAACCCATGCAAACGAAAGA TTAAAACGGCAGTGGAAAGAAG 60.0 6 0.723 136-146
5 AY486731 IAC-Hv05 (ct)16 GTATCCCGAGTCGTCTTCAT TATAAACTAAAATTGCCCTCAG 62.0 6 0.742 268-300
6 AY486741 IAC-Hv06 (ct)19 GGACTAAAACGATCTAATGCTA AAGAGTCTGTGATGGAGTGAAG 58.0 9 0.748 234-270
7 AY486744 IAC-Hv07 (ga)16 CAGCCTACAGCAGATTTGAA GGCTGCCATTTGTAGTTTTA 60.9 10 0.820 248-280
8 AY486747 IAC-Hv08 (ga)18 CCGAAGAAGGGTGTAAT ATCAACTAGTGCCAAGAAG TD 5 0.406 260-270
9 AY486749 IAC-Hv09 (ga)17 GGAAAAACAGCCCATTACTTG CTGCGGCTCATAGGAAAAC 60.0 4 0.412 222-240
10 AY486753 IAC-Hv10 (ct)21 TATCAAAATCAGCAGCATCTAC TCTCCAGTTGTTATCCTCTTCT 60.0 9 0.867 154-184
11 AY486754 IAC-Hv11 (ca)20 CTCGTCTTCTAACTCCGCTCTA TATCGATATTGTGGTGCTTGAA 60.0 6 0.637 230-270
12 AY486769 IAC-Hv12 (ct)15(ca)13 TGCATGCATGAAGTGTCTAA AAAAACCTTGAGGATGTAATG 63.0 5 0.287 134-142
13 AY486776 IAC-Hv13 (ca)15 CATGCAATTCACTACAAAACAA GAAGCAGAACGACCATCAA 60.0 4 0.444 160-268
14 AY486777 IAC-Hv14 (gt)2gc(gt)5(gc)6(gt)7 CTCAAATCATATGGTGGAAGTG ATGATGTTAAAAGGGGGAAGTT 63.0 8 0.745 134-160
15 AY486836 IAC-Hv15 (ga)25 ACTCGCTGACCATAAAAAGAAG TATTGGGATCCTATTGAAAAGA 60.0 12 0.792 200-228
16 AY486838 IAC-Hv16 (ga)19 ACAACACGATTACCAAGGAG AAAAAGGAGACAGGCACATA 60.0 6 0.714 220-232
17 AY486841 IAC-Hv17 (ct)15 TTACTTTATGCAACCTGATGAA GTGGCAACTGAAAACTGAAG 60.0 6 0.764 136-146
18 AY486842 IAC-Hv18 (ga)16 TGCAGTCACATCCACAA GGTCTTACTACATCATCAAAAT 60.0 7 0.718 134-150
19 AY486843 IAC-Hv19 (ga)24 TCTTTCCAACCTTCATCACAG AGGATGGGAAGTAAGCTAGAAA Not amplified
20 AY486845 IAC-Hv20 (ct)18 GGGACATGGGGCTTATCTC AGTGGCTTCATCTTCAAAACC 60.0 13 0.834 168-226
21 AY486850 IAC-Hv21 (ct)20 ATTAACCATTTCAACCAT AATCCTTTCTTTATCTCC TD Acima 330pb
22 AY486854 IAC-Hv22 (ct)20 ACTTTATCTGGTTTTCGTATCA GCCATGCATGTTGTGTTG 60.3 10 0.798 134-152
23 AY486856 IAC-Hv23 (ct)19 ATGGAGGAATAAAAGGGTCTA GGGATGATTGTTTGAAGGATT 65.0 5 0.565 246-254
24 AY486857 IAC-Hv24 (ca)10(ga)18 AAAAGTTCGCCGTAAGATGA TGAGGCCAAGAACAATAGAAT 60.0 6 0.671 260-270
25 AY486858 IAC-Hv25 (ga)25 GATGGAGAGCTGGTAAGAAGAA ATCGAGGGAACTAATCAAACAA 61.8 6 0.648 178-188
26 AY486862 IAC-Hv26 (ga)4 caga(ca)12(ga)14 AACTGCGGTACGTGATTTTC TTTGGAGGTTTAGGATTTGATT Not amplified
27 AY486870 IAC-Hv27 (ga)29 TGGGGACAAAGTGAGGTT CAAAAGAAAAGAAAAAGAAATC 56.0 6 0.515 142-156
28 AY486874 IAC-Hv28 (ga)19 TGTGCTTTTGTAATAGGGAATC TATGGTTTGAGCTGTGTTGTG 55.0 6 0.570 124-134
29 AY486876 IAC-Hv29 (ct)23 GGTGCTCCAGGTAAAGTG GATAGTCGCTCATAGAAAACA 60.0 4 0.244 146-152
30 AY486877 IAC-Hv30 (ct)21 ATAGAATACCTGAACAATAAC AGGGAACATCTAAATAAAT 54.0 8 0.838 148-160
31 AY486878 IAC-Hv31 (ct)21 CATATGCTTTGGTCTGTTCTCC TCCAATGCCTGCCTCTTCTA 65.0 8 0.722 200-224
32 AY486884 IAC-Hv32 (ct)17 TTCACTCTTCTCGCATCAAAC ACAAAACAACCGAACACAAACA 65.0 2 0.124 190-198
33 AY486889 IAC-Hv33 (ca)18 TATGGCTATGTTCTGCTATGC ATGATTTTGGTTACCTGGAAGA 64.8 9 0.779 134-158
34 AY486892 IAC-Hv34 (ga)26 ATGCAAAATCACAGAAAATGGA GGGCAGGGAAAGAGATGTCA 64.8 3 0.589 124-128
3 0.141 218-234
35 AY486900 IAC-Hv35 gtga(gt)3ct(gt)8 ACGACCAGCTTCAGTTTA CATGTGGTGCAAGTTTCT 60.5 3 0.657 148-152
36 AY962210 IAC-Hv36 (ct)1c(ct)8cg(ct)3 CAAAAGCCAATTAATACACATA GTCACACCATCTACCAAATAAG 61.0 2 0.339 240-242
37 AY962212 IAC-Hv37 (ct)6(ca)14(ta)4 GTTAATTATACGCTGTGC TCCAAGAGTCGCTAAAT Not amplified
38 AY962216 IAC-Hv38 (ag)4ca(ag)7 ATCCTCAATTCTTTCTTCA AGTCTTCTTCTCTACCTCTC TD 3 0.156 212-218
39 AY962217 IAC-Hv39 (ac)18 TAGGGACTTTTCTGGCTTTTTA TGGATGTACCTGAGATTTTGAG Not amplified
40 AY962222 IAC-Hv40 (ag)15 GCTCGAGCCCATCTACT ACTCCCTTCTCTATTCTCACTC 65.0 6 0.508 152-170
41 AY962227 IAC-Hv41 (ac)6ag(at)2(ac)22ag(at)27 GGGACGCATGTTGTGTATT AAAAATGGGATGAGTTAGAGAT Not amplified
42 AY962229 IAC-Hv42 (ag)10atg(ag)3 CAGGGAGGCAGTGAGCA AATTCCCTAGTTCTTTGTTGAC 65.0 4 0.520 148-156
43 AY962229_b IAC Hv42b (ag)10atg(ag)3 CAGGGAGGCAGTGAGCA AATTCCCTAGTTCTTTGTTGAC
44 AY962232 IAC-Hv44 (ga)11(gt)11 CTGGCGAGCTGGGAAGG CGGCTGAATCGGACTGG 59.3 4 0.648 144-150
45 AY962235_A IAC-Hv45 (aaat)5 ATCAGCACATTAACAACACA TTATTTCTCTTTTCCTTTACTG 60.5 2 0.183 214-218
46 AY962235_B IAC-Hv46 (ga)13 ATAGGAACAACAGCAACAGTAA TGCTTTTCTTCGCTCTTCTT 65.0 8 0.558 168-182
47 AY962190 IAC-Hv47 (ga)7aa(ga)5 CGCTAGCACACTCAAGAAAACA CCAACGGCTGAAATAGAACAAT 59.5 5 0.487 152-164
48 AF221697 IAC-Hv48 (ga)8 aa(ga)6 AGTTCACCGTGCTTATTTCA AAGGCATTGTTCTGGGATTT 65.0 Acima 330 pb
49 AF383942 IAC-Hv49 (gt)18(tg)2 TGCAGCAGTTACATCACCAA AGGGCCAGAGTCAAAAAGAGT 66.0 5 0.642 222-250
50 AY486791 IAC-Hv50 (gt)19 GCATAATAGTGACAGAAAGAGT ACAATAATACCGAAAATAAAGT 60.0 5 0.341 216-230
51 AY486623 IAC-Hv51 (ga)17 TCAAAGATGTAAGCAGGAGTCA AGAAGTGGCCAGCGAGAAA 65.5 7 0.698 156-170
52 AY486635 IAC-Hv52 (ca)19 AGGAGCAAACATCACAA GCTGGAAGGGTAAACAA 57.5 6 0.389 152-168
53 AY486646 IAC-Hv53 (ca)16 CATGATGAGTGCTGAATAGAGA TGTAAGTTTGACCAAGGATGTA 65.0 5 0.598 238-244
54 AY486666 IAC-Hv54 (ct)16 CTCTCCTCCTGCTATCCATCA CTTTCTCCCCTTAGTCATTTCA Not amplified
55 AY486667 IAC-Hv55 (ga)26 AACTCCCCCATCAACCAA GGAAATGCAAAGAAAACCAGT 64.5 6 0.651 234-244
56 AY486670 IAC-Hv56 (ga)19 TTCCAAAACACGGCTCAAT GGCGTTCCTTTTCTCTTCC 64.5 3 0.354 250-258
57 AY486676 IAC-Hv57 (ct)15 TTTTCCTCTTCCCTTTTT ATTCGTGTTTCTACTTTTATTT 53.5 6 0.398 244-254
58 AY486677 IAC-Hv58 (ct)18 ATTAGCTTTGCAACATTTTTCA GGTAACGCTTCTCTTTCATTTC 63.0 4 0.512 252-246
59 AY486682 IAC-Hv59 (ct)17 TAGCAAAACAAAGCGAAAACTC GTCCCCTGCAACTCTGTCTATC 66.0 5 0.540 200-212
60 AY486697 IAC-Hv60 (ga)20 GACCGATAATATTTCTTCACTG AGCCATTTTCTCACCTCAT 65.0 4 0.554 176-182
61 AY486700 IAC-Hv61 (ct)17 TGGATATACCGGTAACACATTC AACTACAGCAAAAGGCAGAGA 62.4 7 0.799 140-160
62 AY486701 IAC-Hv62 (ct)15 TCTGGCTTTGGGTCCTCTA GGGTTTTTGGGGGTCTG 63.0 5 0.578 148-156
63 AY486702 IAC-Hv63 (ct)17 TCATCAGAAAGCAAAGAAACC AATGCATAGGATCCACAAACT 63.5 4 0.565 208-214
64 AY486703 IAC-Hv64 (ct)23 TATGGTTTGAGCTGTGTTGTGT TGTGCTTTTGTAATAGGGAATC Not amplified
65 AY486707 IAC-Hv65 (ga)16 GATGGGAAAGAGAAGAGACAAA ATGGAAATGCGGGGGTAG 62.4 2 0.110 152-154
66 AY486708 IAC-Hv66 (ct)16 GGCGCTTGTTTTCCACTC TTGTCTCTTCTCTTTCCCATCT 65.0 4 0.451 228-234
67 AY486720 IAC-Hv67 (ct)19 GTTGCGCAAAAATTTCTGTCTA ACCCTTCCTGATGATTCGTGT 65.0 5 0.484 254-262
68 AY486722 IAC-Hv68 (ct)13 TGAATACTCGAGCTCTAAACTT GGACATGATACTCGATAAACTG 65.0 4 0.338 178-184
69 AY486724 IAC-Hv69 (ct)15 TTTTACCCCTTTGGATACAGAG GCCACAAGCTAATGATGATGAA 65.0 7 0.784 140-156
70 AY486725 IAC-Hv70 (ct)15 TCAGGGGAGATTATTTAGTTGT GCAGGATGGAAGGGTGAG 61.8 6 0.561 290-300
71 AY486797 IAC-Hv71 (ca)22 CACTTTCGACCTCATTT TAGTGCTTACATTTCATAGA Not amplified
72 AY486798 IAC-Hv72 (ca)23 CATTTCCCCTCCTCCCTCAT TTCAGCATTTTCGTCATTTGTG 65.0 7 0.594 204-240
73 AY486802 IAC-Hv73 (ca)25 GAAGCTAACACTCAGGTAT TCGATTAAGAAGAAGACAA 59.5 10 0.825 118-138
74 AY486807 IAC-Hv74 (ga)17 TAAAGCAGGAAAAGAAATAAAG TCCAAGAAGACCAAGAGTT 57.6 10 0.841 170-210
75 AY486809 IAC-Hv75 (ga)18 AGAAATAGGAGCGTCAT TGCAACAAACAGAAAGT 57.9 5 0.687 246-254
76 AY486815 IAC-Hv76 (ga)13 ACACTGACCCAACCCTTCTCT TTCCCTTGCACTCATTCCTT 65.0 6 0.815 200-210
77 AY486816 IAC-Hv77 (ga)16 GTGCATGACAGTAATAGTTTT CACAATGTCAATCTCAATG Not amplified
78 AY486819 IAC-Hv78 (ct)19 CCTCGCTTTCACTTCCCATAC ATCCGTTGCTCTGCTGACTCTA 65.5 3 0.498 208-212
79 AY486821 IAC-Hv79 (ga)20 AGGAAAGAAAAAGCCATACC GCAGCAGAGGACAAAACATAA 65.0 4 0.339 270-284
80 AY486822 IAC-Hv80 (ct)22 GGCTTCTACTCCTCCATCAC AGCCCATTTCTTATTCTATTCT 62.4 10 0.610 150-172
1
Ta - annealing temperatures, allele number.
2PIC - polymorphic information content