%&'()*&+ , *) (-% .(& '%& / () &%&0 * ) &1 *&% ()*
Department of Mechanical Engineering, Amrita School of Engineering Amrita Vishwa Vidyapeetham, Coimbatore, India
*Corresponding Author: [email protected]
Abstract
This paper involves the multi(objective optimization of process parameters of AlSi10Mg/9 wt% alumina/3 wt% graphite in Electrical Discharge Machining for obtaining minimum surface roughness, minimum tool wear rate and maximum material removal rate. The important machining parameters were selected as peak current, flushing pressure and pulse(on time. Experiments were conducted by selecting different operating levels for the three parameters according to Taguchi’s Design of Experiments. The multi(objective optimization was performed using Grey Relation Analysis to determine the optimal solution. The Grey Relation Grade values were then analysed using Analysis of Variance to determine the most contributing input parameter. On analysis it was found that peak current, flushing pressure and pulse(on time had an influence of 61.36%, 17.81% and 8.09% respectively on the optimal solution.
Keywords: Grey relation analysis, Electrical discharge machining, Multi(objective optimization, Analysis of variance.
1. Introduction
Nomenclatures
Peak current, A
Material removal rate, g/hr Flushing pressure, kPa Surface roughness, µm Pulse off time, µs Pulse on time, µs Tool wear rate, g/hr Abbreviations
Al AMMCs ANOVA DOE EDM GRA GRC GRG MMCs
Aluminium
Aluminium metal matrix composites Analysis of variance
Design of experiments Electrical discharge machining Grey relation analysis
Grey relation coefficient Grey relation grade Metal matrix composites
Metal Matrix Composites (MMCs) are made from metals in combination with alloying elements that individually possess desired properties to bolster the base metal properties [1]. Out of all the MMCs, Aluminum Metal Matrix Composites (AMMCs) are most diverse and popular due to the abundance of aluminium and its use in various engineering applications. Aluminium is a light metal known for its good strength, thermal conductivity and a high strength to weight ratio. The aluminium matrix is such that it allows for a wide variety of materials to be alloyed with it [2]. One such material is graphite and it is a well(known solid lubricant. When graphite is added to the aluminium matrix, it reduces the friction during sliding and increases dry sliding wear resistance. Also, alumina, being a hard and brittle material, gets accommodated easily in the softer aluminium matrix [3]. Thus it increases the strength and stiffness of the composite.
The alloy AlSi10Mg containing 9 wt % of alumina and 3 wt % of graphite is chosen as it shows great dry sliding wear resistance properties. Although the reinforcements in aluminium improve the properties, they also increase the hardness of the composite and this poses a great deal of difficulty in machining. Thus, there arises a need for effective machining that produces a good surface finish while maintaining precise dimensional accuracy [4].
material by surface erosion, it takes a longer time for machining and this in turn increases operation costs. Machining in EDM depends on several input parameters, among them peak current (I), pulse(on time (Ton) and flushing
pressure (p) have the major influence. Pulse(off time (Toff), though being a less
prominent parameter, controls the duration between two successive sparks during EDM [6]. So it is important to set the Toff properly to avoid improper flushing and
unwanted increase of machining time. These critical input parameters thus have to be optimized such that a low Surface Roughness (Ra) and Tool Wear rate (TWR) with a high Material Removal Rate (MRR) is achieved. The low Ra is important when the material is used in applications where there is extensive metal to metal contact. Also, when the MRR is high and TWR is low, the machining time and the tooling cost reduces.
This calls for multi(objective optimization of the parameters, which can be done with various techniques such as Genetic Algorithm, Ant colony optimization, etc. Grey Relation Analysis (GRA) is one such technique that helps in obtaining the best set of input parameters that result in achieving all the objectives. As the name suggests, GRA finds the optimized result in the grey region between white region, which contains complete information, and black region that contains no information. Thus for an extensive set of input conditions, GRA provides the optimized operating levels that can be set to achieve all objectives equally.
To find out the optimum parametric condition which mostly affects the performance measures, optimization technique based on Design of Experiments (DOE) can also be applied [7, 8]. Optimization of the parameters using DOE is one of the techniques used in manufacturing sectors to arrive for the best manufacturing conditions, which is an essential need for industries towards manufacturing of quality products at lower cost [9]. Taguchi method is applied for the optimization to study the influence of EDM parameters on the machining characteristic such as MRR, TWR and Ra. It is reported that peak current of EDM is the dominating factor that mainly influences on the TWR and Ra [10]. To find the contribution of each input parameter and errors towards the variation of responses, Analysis of Variance (ANOVA) method is used [11, 12]. Thus by determining the contribution of the parameters towards the responses, the influence of individual parameters on the response change can be determined, thereby enabling the user to concentrate on the important factor that is most likely to cause a change in the responses.
2. Experimental Setup
The machinability test in this work is carried out by machining holes of size 8 mm diameter in the AMMCs specimen of length 22 mm and diameter 12 mm. The chemical composition of Al(Si10Mg alloy is given in Table 1.
Table 1. Composition of Al Si10Mg alloy. Chemical
Composition Cu Mg Si Others (Mn, Ni, Zn, Fe, Pb, Sn, Ti) Al
wt.% 0.1
max 0.3 max
10 max
1.50
3
Figure 1 shows Electronica ZNC small die sinker machine (500×300 mm), which is used to drill holes in the composite specimen. A 415 Volt Alternating Current supply is used for machining. The electrode that machines the specimen must have high wear resistance characteristics so as to reduce the tool wear and improve the reusability of the electrode tool. So the electrode material is chosen based on the specimen material to be machined. Based on the material being aluminium, copper is chosen as the electrode in EDM. So in this machining, hole is to be drilled in the specimen using copper electrode. There are various conditions and parameters that are crucial for machining other than the considered input parameters. Of these, the dielectric fluid chosen is kerosene for its good dielectric properties and better combination with aluminium. Figure 2 shows the machined composite specimen.
Fig. 1. Electronica ZNC die sinker machine. Fig. 2. Machined test specimen.
The power supplied to EDM generates an electric potential between the workpiece (anode) and tool (cathode), which leads to the generation of sparks. These sparks produced are a result of bombardment of electrons and ions on the workpiece and the tool. The kinetic energy of these electrons and ions gets converted into heat, which melts and vaporizes the material from the workpiece and the tool. The intensity and duration of these sparks are controlled by peak current and pulse(on time respectively. As discussed earlier a proper pulse(off time is to be ensured for effective flushing to occur, so this pause period is maintained at a constant value of 30 µs. During the pause period, the dielectric fluid flushes away the eroded material and also dissipates the heat from the spark gap.
limit for peak current is 40 A, thus in order to avoid effect of machine errors, peak current is limited between 10 A and 30 A. Similarly flushing pressure is limited between 100 and 200 kPa as 300 kPa is the maximum available pressure. In case of pulse(on time, three levels were considered from the three predefined categories(super finish, good finish and rough finish. This wide range helps determine a better optimal level for obtaining maximum MRR and minimum TWR and Ra.
Table 2. Parameters and their levels.
Level Peak current (I, A)
Flushing Pressure (p, kPa)
Pulse on time (Ton, µs)
1 10 100 120
2 20 150 190
3 30 200 420
The experimental conditions are determined based on the L9 orthogonal array
(Table 3). The L9 orthogonal array is chosen as it covers entire machining
parameter space with just 9 experiments. The parameters were set for the first three columns of the L9 orthogonal array.
Table 3. L9 Orthogonal array and its responses.
Exp.
No. Levels of parameters
Surface Roughness
Material Removal Rate
Tool Wear
Rate Peak
Current (I, A)
Flushing Pressure (p, kPa)
Pulse(on Time (Ton, µs)
Ra (µm)
MRR (g/hr)
TWR (g/hr)
1 10 100 120 3.085 19.0884 0.2299
2 10 150 190 3.414 16.1068 0.1051
3 10 200 420 2.632 13.5612 0.4096
4 20 100 190 3.376 25.2340 0.0976
5 20 150 420 2.823 19.0237 0.3613
6 20 200 120 2.712 16.0324 0.2126
7 30 100 420 5.509 24.9279 0.3774
8 30 150 120 6.491 23.1250 0.1603
9 30 200 190 4.680 19.8409 0.3554
On completing the experiments, MRR and TWR response values are calculated by weight loss method.
MRR =
TWR =
4
3. Results and Discussion
Multi(objective optimisation is performed using GRA to arrive at the best operating level and the results are discussed briefly in the following sections.
3.1. Grey relation analysis
GRA is carried out to obtain the optimal set of process parameters based on the output responses.
3.1.1. Data pre processing
Since the experimental data responses lie in different domains, GRA of the responses is carried out by transferring the original sequence to a comparable sequence. Such a transfer is made by normalizing the responses in the range between zero and one. This data pre(processing depends on the characteristics of the responses [13]. For larger(the(better type responses such as MRR, the original sequence is normalized based on Eq. (1).
* ( ) min ( )
( )
max ( ) min ( ) −
=
− (1) So that maximum MRR fits into the reference sequence. Whereas for smaller( the(better type responses such as TWR and Ra, minimum values of each is fit into the reference sequence by normalizing their original sequence using Eq. (2).
*
( )
max ( )
( )
max ( ) min ( )
−
=
−
(2)In Eqs. (1) and (2),
( )
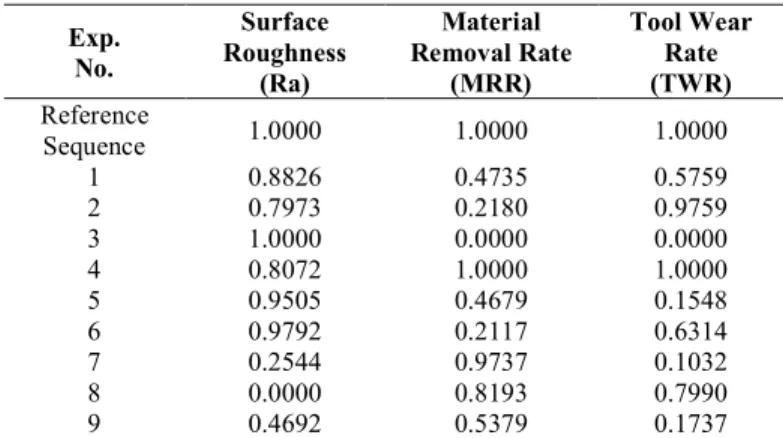
and *( ) are responses before and after normalizing respectively and k=2 for MRR in equation (1) and = 1, 3 for Ra and TWR in Eq. (2); = 1, 2, 3,…, 9 for experiments from 1 to 9. The sequence after normalizing is given in Table 4.Table 4. Sequence of each response after normalizing.
Exp. No.
Surface Roughness
(Ra)
Material Removal Rate
(MRR)
Tool Wear Rate (TWR) Reference
Sequence 1.0000 1.0000 1.0000
1 0.8826 0.4735 0.5759
2 0.7973 0.2180 0.9759
3 1.0000 0.0000 0.0000
4 0.8072 1.0000 1.0000
5 0.9505 0.4679 0.1548
6 0.9792 0.2117 0.6314
7 0.2544 0.9737 0.1032
8 0.0000 0.8193 0.7990
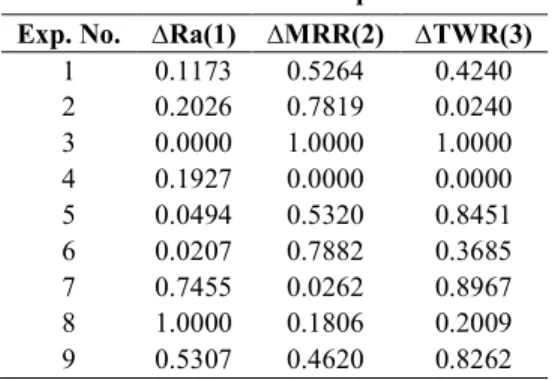
On normalizing, the deviation sequence for each parameter is obtained by calculating the amount of each response which deviates from the reference sequence using Eq. (3).
* *
0
( )
=
0( )
−
( )
(3)where, 0*
( ) 1
=
; is the reference sequence and 0( )
is the deviation sequence as shown in Table 5 for each of the response parameters.Table 5. Deviation sequences.
Exp. No. ∆Ra(1) ∆MRR(2) ∆TWR(3) 1 0.1173 0.5264 0.4240 2 0.2026 0.7819 0.0240 3 0.0000 1.0000 1.0000 4 0.1927 0.0000 0.0000 5 0.0494 0.5320 0.8451 6 0.0207 0.7882 0.3685 7 0.7455 0.0262 0.8967 8 1.0000 0.1806 0.2009 9 0.5307 0.4620 0.8262
3.1.2. Computing grey relation coefficient and grades
Grey Relation Coefficient (GRC) gives the degree of closeness of each of the actual normalized response parameters results to their ideal values in the reference sequence. It is calculated using Eq. (4) [14],
min max
max
( )
( )
( )
( )
( )
ζ
ξ
ζ
+
=
+
(4)where, = 1, 2 and 3 for Ra, MRR and TWR respectively and ζ is the distinguishing coefficient, which is taken as 0.5 to give equal importance to all the responses. GRC for each of the 9 experiments and 3 parameters are given in Table 6.
GRC is concerned with each individual performance characteristic, so for the evaluation of multi(performance characteristic, Grey Relation Grade (GRG), γ, is calculated by averaging individual GRC’s for each experiment using Eq. (5).
3
1
1
( )
( )
3
γ
ξ
=
=
∑
(5)
6
GRG value. This level 20 A for peak current, 100 kPa for flushing pressure and 190 µs for pulse(on time from experiment 4 is a near optimal solution.
Table 6. Calculated grey relation coefficient and grades.
Exp. No. Grey Relation Coefficients Grey Relation Grade Rank
Ra
ξ
(1) MRRξ
(2) TWRξ
(3)γ
1 0.8098 0.6551 0.7796 0.7481 4
2 0.7115 0.5611 0.9842 0.7522 3
3 1.0000 0.5000 0.6000 0.7000 6
4 0.7217 1.0000 1.0000 0.9072 1
5 0.9099 0.6527 0.6396 0.7340 5
6 0.9601 0.5592 0.8027 0.7740 2
7 0.4014 0.9744 0.6258 0.6672 8
8 0.3333 0.8470 0.8818 0.6873 7
9 0.4851 0.6839 0.6448 0.6046 9
Since the motive of this work is to find a level of machining parameters with maximum MRR and minimum TWR and Ra, the optimization of EDM parameters for the AMMCs is converted to optimization of GRG. So mean GRG for each level of the input parameters and their total mean are calculated (Table 7). From this table, the optimal level of input parameters is found to be 20 A for peak current, 100 kPa for flushing pressure and 190 µs for pulse(on time. The ranking of the process parameter reveals that peak current is the most dominant parameter on the output response and a similar behavior is observed in the case of optimization of EDM parameters using Taguchi method and GRA for mild steel [15]. So in this work, since the optimal level exists in the L9 orthogonal array both
the solutions, near optimal and optimal are same.
Table 7. Mean GRG for each level. Machining
Parameters GRG
Main
Effect Rank Level 1 Level 2 Level 3 (max(min)
Peak Current (I) 0.7334 0.8050* 0.6530 0.152 1 Flushing Pressure (p) 0.7741* 0.7245 0.6928 0.0813 2 Pulse(on Time (Ton) 0.7364 0.7546* 0.7004 0.0542 3
Total Mean Value of GRG = 0.7304 *Optimal level of GRG for each parameter
3.2. Analysis of variance
During experimentation, the variation caused in the output can be caused by chance causes or assignable causes [16]. Assignable causes are the ones that are caused by the intentional variation in the input parameters and chance causes are the errors that occur during measurement or due to the randomness of nature that cause variation in responses during machining. In an ideal case, the variations due to chance causes is regarded as zero but this case is not possible in real life conditions. Hence it is necessary to find the contribution of each input parameter and the error towards the variation of the responses (Table 8). For a proper data set, the contribution of the error has to be lesser than that of all other parameters. The Fisher’s ratio (F ratio) determines the significance of a particular parameter [17]. For a particular input parameter, the F(ratio has to be more than one to be considered as a significant parameter
.
Table 8. Analysis of variance of GRG.
Source Degree of freedom
Sum of squares
Adjusted Mean squares
F ratio P
Percentage contribution
Peak
Current (I) 2 0.034710 0.017355 4.82 0.172 61.36 Flushing
Pressure (p) 2 0.010077 0.005039 1.40 0.417 17.81 Pulse(on
Time (Ton) 2
0.004577
0.002288 0.64 0.611 8.09 Residual
Error 2 0.007199 0.003599 12.72
Total 8 0.056562
From Fig. 3, it can be seen that peak current (61.36%) is the most dominant parameter followed by flushing pressure (17.81%) and pulse on time (8.09%) and this can also be concluded from the F(ratio in Table 8 and a similar trend is observed in machining of aluminium/silicon carbide/graphite hybrid metal matrix composites using EDM [18]. Also, since the cause due to error is less in percentage, this data set is a reliable one. The error percentage of 12.72 could be probably due to pulse off time, spark gap and also noise factor such as temperature of dielectric fluid.
4. Conclusions
In this work, the EDM of aluminium hybrid MMC was extensively discussed and the optimization of input parameters for a better MRR, Ra and TWR was carried out. GRA used in optimization lead to a single best optimal level of input parameters with 20 A for peak current, 100 kPa for flushing pressure and 190 µs for pulse(on time. Based on ANOVA, it was shown that peak current followed by flushing pressure and pulse(on time has significant influence on the response parameters. Peak current was found to be the most dominant parameter with contribution of 61.36%. Thus, the obtained optimal level of process parameters was found to lead to good surface finish, reduced TWR and better MRR in the EDM of aluminium hybrid composites.
References
1. Sheng, Y.H.; Dai, H.M.; and Zhang, L. (2011). Study on the CNTs strengthening metal matrix composite and its properties.
, 80(81,436(439.
2. Lloyd, D. J. (1994). Particle reinforced aluminium and magnesium matrix
composites. , 39(1), 1(23.
3. Radhika, N.; Subramanian, R.; and Venkat Prasat, S. (2013). Wear behaviour of aluminium/alumina/graphite hybrid metal matrix composite using
Taguchi’s techniques. , 65 (3), 166(174.
4. Stoudt, M.; Hubbard, J.; Mates, S.; and Green, D. (2005). Evaluating the relationships between surface roughness and friction behavior during metal forming. ! , World Congress and Exhibition.
5. Mohanty, R. (2010). Principle of EDM for project report on WIRE EDM.
6. Bin Khalid, A.G. (2008). " #
$ % &'& . Project Report, Faculty of
Mechanical Engineering, Universiti Malaysia Pahang.
7. Nikalje, A.M.; Kumar, A.; and Sai Srinadh, K.V. (2013). Influence of parameters and optimization of EDM performance measures on MDN 300 steel using Taguchi method. (
, 69(1(4), 41(49.
8. Ramalingam, V.; Sivasubramanian, R.; and Senthil kumar, M. (2007). A Study on optimization of process parameters in EDM using Taguchi’s DOE
technique. ( ! ,
8(2(4), 181(186.
9. Raghuraman, S.; Thiruppathi, K.; Panneerselvam, T.; and Santosh, S. (2013). Optimization of EDM parameters using Taguchi method and grey relational analysis for mild steel is 2026. (
% , 2(7), 3095(3104.
10. Lajis, M.A.; Mohd Radzi, H.C.D.; and Nurul Amin, A.K.M. (2009). The implementation of Taguchi method on EDM process of tungsten carbide.
11. Schonlau, M.; and Welch, W.J. (2006). Screening the input variables to a computer model via analysis of variance and visualization.
# % " " ) , Chapter 14, 308(327.
12. Radhika, N.; Subramanian, R.; and Babu Devasenapathi,S. (2013). Machining parameter optimization of an aluminium hybrid metal matrix composite by statistical modelling. (
, 65(6), 425(435.
13. Jangra, K.; Jain, A.; and Grover, S. (2010). Optimization of multiple machining characteristics in wire electrical discharge machining of punching die using grey relational analysis. (
, 69(08), 606(612.
14. Natarajan, N.; and Arunachalam, R.M. (2011). Optimization of micro(EDM with multiple performance characteristics using Taguchi method and grey
relational analysis. ( , 70(07),
500(505.
15. Raghuraman, S.; Thiruppathi, K.; Panneerselvam, T.; and Santosh, S. (2013). Optimization of EDM parameters using Taguchi method and grey relational analysis for mild steel IS 2026. (
% , 2(7), 3095(3014.
16. Misra, K.B. (2008*+ # . Springer.
17. Gopalsamy, B.M.; Mondal, B.; and Ghosh, S. (2009).Taguchi method and ANOVA: An approach for process parameters optimization of hard machining while machining hardened steel. (
, 68(08), 686(695.
18. Gopalakannan, S.; Senthilvelan, T.; and Ranganathan, S. (2013). Statistical optimization of EDM parameters on machining of aluminium hybrid metal matrix composite by applying Taguchi based grey analysis. (