HESSD
12, 4413–4469, 2015Quantitative historical hydrology
in Europe
G. Benito et al.
Title Page
Abstract Introduction
Conclusions References
Tables Figures
◭ ◮
◭ ◮
Back Close
Full Screen / Esc
Printer-friendly Version Interactive Discussion
Discussion
P
a
per
|
Discussion
P
a
per
|
Discussion
P
a
per
|
Discussion
P
a
per
|
Hydrol. Earth Syst. Sci. Discuss., 12, 4413–4469, 2015 www.hydrol-earth-syst-sci-discuss.net/12/4413/2015/ doi:10.5194/hessd-12-4413-2015
© Author(s) 2015. CC Attribution 3.0 License.
This discussion paper is/has been under review for the journal Hydrology and Earth System Sciences (HESS). Please refer to the corresponding final paper in HESS if available.
Quantitative historical hydrology
in Europe
G. Benito1, R. Brázdil2,3, J. Herget4, and M. J. Machado1
1
Museo Nacional de Ciencias Naturales, CSIC, Serrano 115 bis, 28006 Madrid, Spain 2
Institute of Geography, Masaryk University, Kotlářská 2, 611 37 Brno, Czech Republic 3
Global Change Research Centre, Academy of Sciences of the Czech Republic, Bělidla 4a, 603 00 Brno, Czech Republic
4
Dept. of Geography, University of Bonn, Meckenheimer Allee 166, 53115 Bonn, Germany
Received: 27 March 2015 – Accepted: 4 April 2015 – Published: 30 April 2015
Correspondence to: G. Benito ([email protected])
HESSD
12, 4413–4469, 2015Quantitative historical hydrology
in Europe
G. Benito et al.
Title Page
Abstract Introduction
Conclusions References
Tables Figures
◭ ◮
◭ ◮
Back Close
Full Screen / Esc
Printer-friendly Version Interactive Discussion
Discussion
P
a
per
|
Discussion
P
a
per
|
Discussion
P
a
per
|
Discussion
P
a
per
|
Abstract
In the last decades, the quantification of flood hydrological characteristics (peak dis-charge, hydrograph shape, and runoffvolume) from documentary evidence has gained scientific recognition as a method to lengthen flood records of rare and extreme events. This paper describes the methodological evolution of the quantitative historical hydrol-5
ogy under the influence of developments in hydraulics and statistics. In the 19th cen-tury, discharge calculations based on flood marks was the only source of hydrological data for engineering design, but later was left aside on favour of systematic gauge records and conventional hydrological procedures. In the last two decades, there is growing scientific and public interest to understand long-term patterns of rare floods, 10
maintain the flood heritage and memory of extremes, and to develop methods for de-terministic and statistical application to different scientific and engineering problems. A compilation of 45 case studies across Europe with reconstructed discharges demon-strates that (1) in most cases present flood magnitudes are not unusual within the con-text of the last millennium, although recent floods may exceed past floods in some tem-15
perate European rivers (e.g. the Vltava and Po rivers), (2) frequency of extreme floods have decreased since the 1950s, although some rivers (e.g. the Gardon and Ouse rivers) show a reactivation of rare events over the last two decades. There is a great potential of gaining understanding of individual extreme events based on a combined multiproxy approach (palaeoflood and documentary records) providing high-resolution 20
time flood series and their environmental and climatic changes; and to develop non-systematic and non-stationary statistical models based on relations of past floods with external and internal covariates under natural low-frequency climate variability.
1 Introduction
Historical hydrology is the study of the hydrological cycle before the continuous instru-25
HESSD
12, 4413–4469, 2015Quantitative historical hydrology
in Europe
G. Benito et al.
Title Page
Abstract Introduction
Conclusions References
Tables Figures
◭ ◮
◭ ◮
Back Close
Full Screen / Esc
Printer-friendly Version Interactive Discussion
Discussion
P
a
per
|
Discussion
P
a
per
|
Discussion
P
a
per
|
Discussion
P
a
per
|
(Brázdil et al., 2006b, 2012). Most of the documented pinstrumental records are re-ferred to hydrological extremes (floods and droughts) that produced major disruption on past societies. In this context, historical floods have been frequently reported through written, pictorial and epigraphic documentation across Europe (Brázdil et al., 2012; Herget, 2012). Historical hydrology is on the interface between hydrology and environ-5
mental history: based on data derived from documentary sources (non-instrumental human observations), its analysis involves the use not only of historical-archival meth-ods, but of hydrological modelling, and stochastic frequency analysis. Traditionally, the collection of historical floods information has been mainly addressed within the field of historical climatology together with other natural phenomena such as heavy rains, 10
storms at sea, snowfalls and droughts (Brázdil et al., 2005b). Over the last 20 years, the study of historical floods has gained recognition in Europe as key to understanding the natural hazards dynamics and their response to climate variability. Some major efforts were done in the topic within the European projects SPHERE (Systematic, Palaeoflood and Historical data for improvEment of flood Risk Estimation; Benito et al., 2004) and 15
the FLOODCHANGE Advance Grant (Deciphering River Flood Change; Kiss et al., 2015). The possibility of extending river records towards the past have opened new perspectives in the study of extreme hydrological events whose analysis in terms of return periods, variability and tendency to clustering requires long hydrological data sets (Hall et al., 2014). However, documentary flood data are, in most cases, descrip-20
tive information, limited to a location (at human settlements), depending upon human perception (caused damages) and eventually bias by the political, legislative and ad-ministrative (local, regional and national) contexts. Recent advances on hydrological and hydraulic modelling and statistical-mathematical methods allow better dealing with the uncertain and categorical data characteristic of historical floods developing new 25
applications in the study of flood hazards and climate change studies.
Euro-HESSD
12, 4413–4469, 2015Quantitative historical hydrology
in Europe
G. Benito et al.
Title Page
Abstract Introduction
Conclusions References
Tables Figures
◭ ◮
◭ ◮
Back Close
Full Screen / Esc
Printer-friendly Version Interactive Discussion
Discussion
P
a
per
|
Discussion
P
a
per
|
Discussion
P
a
per
|
Discussion
P
a
per
|
pean richness on flood historical documents is only comparable to China with 100 000 reports from 8000 localities, although quantitative description of the flood hydrographs in Chinese rivers did not start till the 18th century (Luo, 1987). The oldest historic nearly continuous flood record is not to be found in Europe or Asia, but in Africa, in ancient Egypt (Popper, 1951) whose economic wealth depended on the flooding of the River 5
Nile and the annual deposition of fertile sediments along the river flood plain. In the Nilometer of Egypt, flood levels were observed and measured since ca. 3000 BC. In the USA, historical floods include information about extreme hydrological events observed in staffgauges (water-level readings), and therefore data derived from non-recording, attendant-read, staffgauges are traditionally considered historical data (Cook, 1987). 10
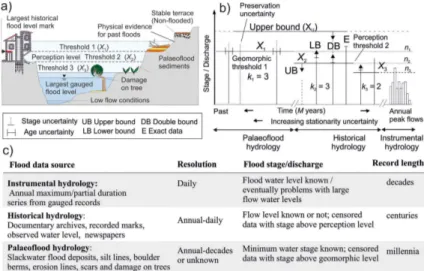
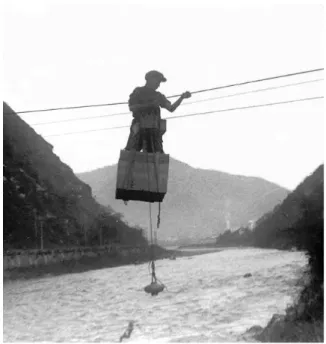
In Europe, the early stages of hydrology (1780–1860) involved human observations of water level readings on staffgauges, which were not always continuous throughout the year. This problem was gradually solved with the modernisation of gauge stations that made possible to record continuous flow stage on counters and data-loggers (Fig. 1). This early instrumental period, that started around the 18th century and comprehends 15
the initial flood observations at staffgauges, has been considered part of the historical hydrology (Brázdil et al., 2012). Another source of long-term pre-instrumental floods data, though sometimes with a lower time resolution, are sedimentary and botanical records, known as palaeofloods (cf. Baker, 2008; Fig. 1). Palaeostage indicators in-clude various types of geologic evidence (flood deposits and geomorphic features; 20
Benito and Díez-Herrero, 2015) and woody debris, as well as morphologies related to direct physical damages on riverine vegetation (e.g. scars on trees and tilting; Herget, 2012; Benito and Díez-Herrero, 2015). A number of studies have combined both histor-ical and geologhistor-ical indicators to ascertain the magnitude and frequency of past flood, increasing the robustness of the frequency analysis of rare floods (Benito et al., 2010). 25
HESSD
12, 4413–4469, 2015Quantitative historical hydrology
in Europe
G. Benito et al.
Title Page
Abstract Introduction
Conclusions References
Tables Figures
◭ ◮
◭ ◮
Back Close
Full Screen / Esc
Printer-friendly Version Interactive Discussion
Discussion
P
a
per
|
Discussion
P
a
per
|
Discussion
P
a
per
|
Discussion
P
a
per
|
flood discharge records, (2) to review different techniques used for reconstructing the magnitude and frequency of specific past floods using documentary evidence, (3) to describe the approaches used in flood frequency analysis with historical discharges, and (4) to illustrate how historical quantitative hydrology can contribute in the solution of environmental and engineering problems.
5
2 Quantitative historical hydrology
The primary goal of historical hydrology is to collect information on past extreme floods such as date, relative magnitude, damages and socio-economic impacts at the time (Brázdil et al., 2006b, 2012; Glaser et al., 2010). Most recently, there has been a growing interest on quantifying these descriptive data in the reconstruction of flow 10
depths, discharges and hydraulic properties associated to historical flooding (Fig. 1). This quantification may be numerical (peak flow) or categorical (damage classification). Regarding numerical data, the observed flood-water levels associated to a given his-torical flood can be transformed by hydraulic calculations into velocities and discharges in a procedure analogous to the depth-discharge relationships used to determine the 15
flow rate in gauge stations (Cook, 1987; Benito et al., 2004; Herget et al., 2014). Flood magnitudes can also be classified in terms of resulting damages, or social impacts (e.g. Sturm et al., 2001). The use of secular records for the analysis of possible changes in the magnitude and frequency of individual floods at specific sites or for specific rivers can support not only flood hazard assessment analysis, but enable the identification of 20
interconnections between flood frequency and severity and climate, land-use and river morphology (Macdonald and Black, 2010). Moreover, historical flood data often in-cludes other less commonly used information and data regarding the societal and eco-nomic consequences of these natural disasters (Coeur, 2003). Yet, this valuable data on the role of floods, through time, on local and national societal and policy changes 25
HESSD
12, 4413–4469, 2015Quantitative historical hydrology
in Europe
G. Benito et al.
Title Page
Abstract Introduction
Conclusions References
Tables Figures
◭ ◮
◭ ◮
Back Close
Full Screen / Esc
Printer-friendly Version Interactive Discussion
Discussion
P
a
per
|
Discussion
P
a
per
|
Discussion
P
a
per
|
Discussion
P
a
per
|
The use of documentary flood data in hydrological studies usually comprises four phases of analysis: (1) compilation and assessment of flood dates and water levels, (2) classification of events according to flood water-level (exact stage), described inun-dation zones (minimum or maximum flood level) and from reported damages, (3) es-timation of flood magnitude, usually peak discharge, associated with documented and 5
site-observed evidence; and finally (4) use of historical flood data in the flood frequency analysis. The implementation of the first two initial analysis steps entails a previous command in historical archives research, both written and cartographical that will not only produce a record of historical floods, but will also identify flooded sites and mor-phological changes on river channel and floodplain in the course of historical anal-10
ysed period. The third task requires the implementation of hydraulic and hydrodynamic analyses, mainly drawn from engineering applications, to assign a flow magnitude de-rived from documentary evidence. Finally, historical estimated discharge data can be merged with instrumental records in a flood frequency analysis in order to determine discharges associated to probability quantiles.
15
3 History of hydraulics and early flood estimations in Europe
The first hydraulic parameter described in rivers was the water-level reached during extraordinary events. Ancient Romans observed and recorded flood water levels at bridges (e.g. Albenga, 1940), and the Roman engineers used this knowledge for de-signing their infrastructures (Lorenz and Wolfram, 2011). The study of flood levels 20
was important ensuring efficient and long lasting hydraulic structures, and leave this legacy to future generations as it can be read in the inscription placed at the 30 m high Alcantara Bridge (Spain): “Pontem perpetui mansurum in saecula mundi” (Bridge to last forever in the perpetuity of the world; Fernández-Casado, 2008). Nowadays, the preservation of written records about flood data from antiquity is anecdotal since most 25
HESSD
12, 4413–4469, 2015Quantitative historical hydrology
in Europe
G. Benito et al.
Title Page
Abstract Introduction
Conclusions References
Tables Figures
◭ ◮
◭ ◮
Back Close
Full Screen / Esc
Printer-friendly Version Interactive Discussion
Discussion
P
a
per
|
Discussion
P
a
per
|
Discussion
P
a
per
|
Discussion
P
a
per
|
a non-systematic way (Brázdil, 1998; Deutsch and Pörtge, 2009; Brázdil et al., 2012). Systematic water-level readings at gauges did not start before the later 18th century, namely in Germany, France, Austria and Czech Lands. A review about the history of these first gauge water-level readings in Europe was compiled and published by Brázdil et al. (2012), though at the national level several papers have been published recently 5
regarding the development of discharge measurements (e.g. for northern Germany, Deutsch, 2010). The revolutionary step on flood hydrology records which enabled to register and calculate flow discharge after stage level at gauge stations did not take place till the 19th century with the measurement of flow velocity. The first rotor current meter was developed by Woltman (1790) and underwent several improvements during 10
the 19th and 20th centuries (Lanser, 1953). Current-meter gauging stations permitted the measurement of the flow rating curve (depth-discharge relationship) at the first es-tablished gauge stations in European rivers (Fig. 2). Rating curves were eses-tablished and rated most reliably for low-to-moderate flows. The extreme flow discharges were frequently obtained from extrapolation of the rating curve. As this approach is less 15
reliable and implies numerous uncertainties due to missing calibration, discharges as-sociated to high flood levels were estimated by hydraulic formulae. Hence, reconstruc-tions of historical floods gained robustness simultaneously to the advance in hydraulic research.
The first equations accounting for resistance law in open channels were established 20
during the late 18th and 19th century. In 1775 the French engineer Antonie Chézy (1718–1789) proposed the first resistance formula based on a study of the water trans-fer from the River Yvette to Paris by an earthen canal (Herschel, 1897). Chézy’s formula can be derived mathematically from two assumptions, as described by Chow (1959). First, Chézy assumed that the force resisting the flow due to friction per unit area is 25
HESSD
12, 4413–4469, 2015Quantitative historical hydrology
in Europe
G. Benito et al.
Title Page
Abstract Introduction
Conclusions References
Tables Figures
◭ ◮
◭ ◮
Back Close
Full Screen / Esc
Printer-friendly Version Interactive Discussion
Discussion
P
a
per
|
Discussion
P
a
per
|
Discussion
P
a
per
|
Discussion
P
a
per
|
bottom, namelyωALS, whereωis the unit weight of water,Ais the cross-section area, Lis the channel length andS the slope. SinceωALS=K V2P L, whereA/P is the
hy-draulic radiusR and q
ω/K can be replaced by a factorC, then it is obtained Chézy’s equation as:
V =CpRS 5
In this formula, the factorCis the main uncertainty for velocity calculations estimated for known river cross-sections by indirect methods or assumptions. For instance, the first discharge estimates of the 1857-flood in the Ardèche (France) were obtained from mul-tiplying the calculated velocity by 0.7 to reflect the unequal distribution of flow rate and channel roughness (De Mardigny, 1860). During the 19th century different experiments 10
were performed to determine the involved variables in Chézy’s factorC, among which the most relevant were proposed by Ganguillet and Kutter (1869) and Bazin (1897). Henri Emile Bazin (1829–1917) conducted laboratory studies on channels made on cement, brick, wood and rock proposing a formula whereCis a factor ofR:
C= 87 1+m/√R 15
wherem is a roughness coefficient that varies between 0.06 for canals made of con-crete to 3.17 for earth channels with rough conditions (Bazin, 1897).
In 1868, Philippe Gascard Gauckler (1826–1905) engineer at Ponts et Chaussées, proposed two formulae for the estimation of the flow velocityV as:
V =λ1R4/3S forS >0.0007
20
V =λ2R2/3S1/2forS <0.0007
whereλ1andλ2are coefficients describing the boundary roughness. The second
HESSD
12, 4413–4469, 2015Quantitative historical hydrology
in Europe
G. Benito et al.
Title Page
Abstract Introduction
Conclusions References
Tables Figures
◭ ◮
◭ ◮
Back Close
Full Screen / Esc
Printer-friendly Version Interactive Discussion
Discussion
P
a
per
|
Discussion
P
a
per
|
Discussion
P
a
per
|
Discussion
P
a
per
|
na roughness parameter, as it was proposed later by the Irish engineer Robert Man-ning (1816–1897), although apparently ManMan-ning was unaware of Gauckler’s work. The popular Manning equation (Manning, 1891) is expressed in metric units as
V =K R2/3S1/2
whereK is a factor of flow resistance that later was modified to 1/n, wherenis known 5
as Manning’s roughness coefficient. Later, Strickler (1923) proposed a new expression of the Chézy’s C coefficient C=K R1/6
that applied in the Chézy‘s formula provides a similar expression of the Gauckler–Manning’s formula. There is still an open debate on the significance of the different contributions to the still recently frequently applied approach (Williams, 1970; Dooge, 1992; Hager, 2005). Consequently, this equation is 10
also named Gauckler–Manning–Strickler formula. Another fundamental set of hydraulic equations for unsteady open channel flow was formulated by Barré de Saint-Venant in 1843 who published the correct derivation of the Navier–Stokes equations identifying the coefficient of viscosity and its role in the local acceleration and fluid turbulence (Anderson, 1997).
15
The Gauckler–Manning formula has been used extensively since early estimates of historical floods to calculate the mean flow velocity at sections with observed historical flood levels (Pardé, 1925b). During the first half of the 20th century the research on his-torical floods was developed with a great influence of physical geographers. Maurice Pardé (1893–1973), Professor of Potomology in Grenoble, was probably the most pro-20
lific European author in the study of extreme historical floods, with over three-hundred papers and two-thousand hand-written notes and letters on the subject including a vast compilation of documentary floods worldwide. In Austria, the first known publications calculating discharges using historic flood-marks were carried out by Schwarzl (1956) and Kresser (1950, 1957). The highest flood level marked on public buildings and pas-25
sage near the river corresponds to the 1501-flood estimated as ca. 14 000 m3s−1 in
au-HESSD
12, 4413–4469, 2015Quantitative historical hydrology
in Europe
G. Benito et al.
Title Page
Abstract Introduction
Conclusions References
Tables Figures
◭ ◮
◭ ◮
Back Close
Full Screen / Esc
Printer-friendly Version Interactive Discussion
Discussion
P
a
per
|
Discussion
P
a
per
|
Discussion
P
a
per
|
Discussion
P
a
per
|
thorities, and data were reported as internal publications (e.g. HOPR, 1935; Giovan-nelli and Allodi, 1960’s, cited in Zanchettin et al., 2008). In the River Po, the 1857, 1868, and 1872 flood levels were studied in the context of large flooding recorded during the early decades of the 20th century (Visentini, 1936, 1938; Visentini and Pardé, 1936), concluding that historical flood peaks were of lower magnitude than contemporaneous 5
extreme events.
These early 20th century advances on hydraulic models and stream flow measure-ments supported the re-estimations of discharge associated with certain large histori-cal floods. For instance, in the River Isère the 1740-flood discharge originally estimated as 1844 m3s−1by the engineer Christophe Dausse in 1780 (Lang et al., 2003) was later
10
revised in 2000 m3s−1by Pardé (1925b) using Chézy and Gauckler equations. Pardé
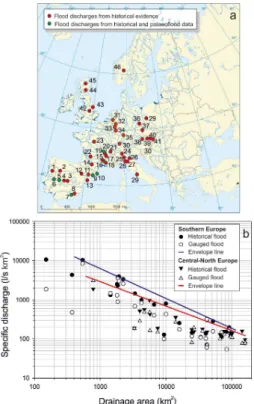
(1961) provided the first worldwide inventory of flood discharges including a large num-ber of pre-instrumental floods, many obtained from letters and unpublished reports with a reliability difficult to verify. The compilation of discharges from these early historical flood studies resulted in the plotting of regional envelope curves of maximum flood 15
peaks or discharge per unit area vs. drainage area (Wundt, 1949; Pardé, 1961; Fran-cou and Rodier, 1967). The envelope curve is a deterministic method to transpose space-for-time under the assumption that there is a limit of precipitation supplied to a basin under a given climatic and geographic domain (Myers, 1967).
The study of past floods declined since the mid-20th century as databases of stream 20
flow measurements supported by statistical analysis provided standard hydrological methods for flood hazard applications on which historical extremes were considered anecdotal, imprecise and outliers in relation to systematic gauged records (Klemeš, 1989).
4 Quantitative historical flood records: approaches and methodology
25
HESSD
12, 4413–4469, 2015Quantitative historical hydrology
in Europe
G. Benito et al.
Title Page
Abstract Introduction
Conclusions References
Tables Figures
◭ ◮
◭ ◮
Back Close
Full Screen / Esc
Printer-friendly Version Interactive Discussion
Discussion
P
a
per
|
Discussion
P
a
per
|
Discussion
P
a
per
|
Discussion
P
a
per
|
there is a large amount of documentary evidence providing descriptive evidence of past inundation levels and flood damages (impacts) that offer a quantitative reference of the associated flood discharges after a critical analysis and interpretation (Benito et al., 2004). For the past 20 years, there has been a growing interest on reconstruct-ing flood chronologies and their discharge estimates from documentary descriptions 5
of flood water level (Benito et al., 2003a). The reconstruction of long historical flood records from documentary sources relies upon the availability of historic data for model implementation and calibration, uncertainty on the past river topography, and detailed configuration of the river channel and vegetation for roughness characterisation. Ex-tracting quantitative hydrological data from documentary evidences leads typically to 10
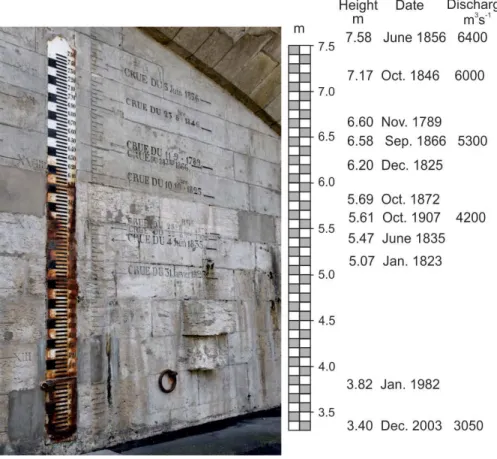
two phases of analysis: (1) documentation and assessment of documentary evidence of flood stage during specific historical floods and (2) relating of identified flood evi-dence to flood discharge, based on hydraulic calculations. Documentary evievi-dence of flood water level includes flood marks, with indication of single or multiple flood lev-els (Fig. 3), and relative water levlev-els obtained from narrative descriptions from places 15
affected by flooding (e.g. a church, one of several streets, singular buildings). By the computation from water level to discharge, several correlative water surface evidences (marks, inundated sites) of a historical flood are matched to a water surface profile of a known discharge, obtained from hydraulic modelling. A major problem for this hy-draulic analysis is the reconstruction of river channel geometry at the time of flooding, 20
which produces a high uncertainty on the discharge calculations mainly in alluvial rivers (i.e. mobile river bed). The existence of historical maps showing the channel morphol-ogy at the flood time can be used to reconstruct its former morpholmorphol-ogy. The historical flood estimated discharges are then structured into different threshold levels that were exceeded by floodwaters over specific periods of time, the input data necessary for 25
HESSD
12, 4413–4469, 2015Quantitative historical hydrology
in Europe
G. Benito et al.
Title Page
Abstract Introduction
Conclusions References
Tables Figures
◭ ◮
◭ ◮
Back Close
Full Screen / Esc
Printer-friendly Version Interactive Discussion
Discussion
P
a
per
|
Discussion
P
a
per
|
Discussion
P
a
per
|
Discussion
P
a
per
|
4.1 Documentary data sources and types
Several review papers have described the main data sources of historical hydrology (Brázdil et al., 2006b, 2012). They are often grouped into three data categories: hand-written documents (e.g. narrative sources, administrative and ecclesiastic reports, and personal correspondence); printed sources (special prints newspapers, databases, re-5
ports and technical papers); iconographic sources (stone-marks, historical photogra-phy and paintings, old cartographotogra-phy and cross-sections).
Narrative descriptions about floods may be biased by perception, both from the writer and from the present day researcher (Brázdil et al., 2006b). Since information from documentary sources is mainly qualitative, several classifications have been suggested 10
taking into account the severity of flood impacts (Sturm et al., 2001; Barriendos and Coeur, 2004). Barriendos and Coeur (2004) proposed a qualitative classification of flood severity for records prior to the pre-instrumental period, taking as reference the channel overflow: ordinary flood – when water remains within the channel and banks; extraordinary flood – resulting in localised overbank flow, with any damage but without 15
major destruction; and catastrophic flood – with inundation resulting in general damage and destruction of infrastructures.
A study of historical hydrology involves: (1) collection of documentary sources (e.g. municipal, ecclesiastical and private archives) and consideration of already compiled information (e.g. books, databases and reports), (2) compilation of instrumental data 20
for the area of investigation (rainfall, flow and level of the river, synoptic information), (3) collection of graphic information (e.g. paintings, photographs), (4) cross-reference of historical and palaeoflood (geological records) information, instrumental data and graphic information. It is convenient to produce a standardised data form to be filled for each documentary flood reference (Fernandez de Villalta et al., 2001; Casas et al., 25
2003; Barriendos and Coeur, 2004; Barriendos et al., 2014).
HESSD
12, 4413–4469, 2015Quantitative historical hydrology
in Europe
G. Benito et al.
Title Page
Abstract Introduction
Conclusions References
Tables Figures
◭ ◮
◭ ◮
Back Close
Full Screen / Esc
Printer-friendly Version Interactive Discussion
Discussion
P
a
per
|
Discussion
P
a
per
|
Discussion
P
a
per
|
Discussion
P
a
per
|
the documented historical flood information is not recorded as engraved flood marks (plates or inscriptions) but as descriptions of inundations that affected out-of-channel areas. This is the case for instance of the River Ter (NE Spain) for which a record of 170 floods was compiled for the period between 1322–1987 (Barriendos and Martin-Vide, 1998), from which only 77 floods were found to be registered in plates or wall 5
inscriptions. The majority of the flood events mentioned in documentary sources was nevertheless associated to a comprehensive description of the sites, or streets affected by the flood water-level. The reconstruction of flood discharges from descriptive flood levels beyond rough extrapolations and estimations (e.g. Schiller, 1987) was addressed firstly for the River Tagus in central Spain (Benito et al., 2003a). Discharges associated 10
with documentary-based floods were reconstructed at four places, namely in Aranjuez (since AD 1557), Toledo (AD 1113), Talavera (AD 1203) and Alcántara (AD 1856). The hydraulic analysis and interpretation of the flood level from historical documents was inspired by methods commonly used in palaeoflood hydrology (Baker, 2008). Flood levels associated with documentary data at these locations include: (1) flood marks on 15
houses, mills, monasteries and bridges, (2) descriptions of flooded areas as orchards, roads, streets, (3) descriptions of non-flooded areas (e.g. singular building surrounded by water but non-inundated), (4) relative flood level with respect to previous floods (e.g. the 1840 flood was 2 m higher than the flood occurring in 1820). The interpretation of these flood water level indicators provides four different discharge information records: 20
(1) highest water level or peak discharge (equal to the flood stage), (2) minimum flood discharge, (3) maximum flood discharge, and (4) discharge quoted as a range in the case of two recorded levels. Field work is required to accurately locate (GPS survey) the sites referred in the historical documents (location of buildings, streets, bridges, gates, walls, etc.), as well as to ascertain the altitudes of the referred flood stages or 25
devel-HESSD
12, 4413–4469, 2015Quantitative historical hydrology
in Europe
G. Benito et al.
Title Page
Abstract Introduction
Conclusions References
Tables Figures
◭ ◮
◭ ◮
Back Close
Full Screen / Esc
Printer-friendly Version Interactive Discussion
Discussion
P
a
per
|
Discussion
P
a
per
|
Discussion
P
a
per
|
Discussion
P
a
per
|
oped as in the case of the study conducted by Roggenkamp and Herget (2014) for the River Ahr at Ahrweiler (Germany). The hydrograph of the 1910-flood was recon-structed based on sequenced historic photographs showing the same inundated street with a street clock hanging on a wall of a building, which precisely linked time and flood water level.
5
4.2 Discharge estimation from documentary records
The most critical component of applied historical flood hydrology is the estimation of discharge associated to documented floods. The flow estimates from hydraulic analysis is usually based on the elevation of flooded or non-flooded sites and epigraphic marks relative to local channel geometry. The approaches used to assess discharge estima-10
tion from known flood-water levels vary from simple hydraulic formula to the results derived from the running of one or multi-dimensional hydraulic models (Kutija, 2003; Lang et al., 2004). Most historical flood studies assume a one-dimensional flow with calculations based on (1) uniform flow equations (e.g. Gauckler–Manning equation), (2) gradually varied flow models (e.g. standard step method calculation), and (3) one 15
dimensional Saint-Venant equations. In complex reaches, multi-dimensional modelling may reduce uncertainties associated with reconstructing flood discharge (Denlinger et al., 2002).
The Gauckler–Manning equation is applied for uniform, steady and one-dimensional flow conditions of straight channels of even gradient and regular width (Chow, 1959). 20
In most hydraulic computations, the result of the calculated discharge depends on the uncertainty in the selection of the roughness parameter, changes on cross-section to-pography and urban configuration on the floodplains since historic times. The typical method for estimating Manning’sn is obtained from reference tables, from examina-tion of photographs of typical channels whose roughness coefficients are known, or 25
HESSD
12, 4413–4469, 2015Quantitative historical hydrology
in Europe
G. Benito et al.
Title Page
Abstract Introduction
Conclusions References
Tables Figures
◭ ◮
◭ ◮
Back Close
Full Screen / Esc
Printer-friendly Version Interactive Discussion
Discussion
P
a
per
|
Discussion
P
a
per
|
Discussion
P
a
per
|
Discussion
P
a
per
|
each sub-section, the intervenient parameters of the Manning equation (R,S,n) are assessed at time of the historical flooding based on old maps and written descriptions. The uncertainty on the estimation of roughness and of hydraulic geometry is intro-duced as different scenarios based on varying assumptions considered. Herget and Meurs (2010) applied this method to the 1374 flood of the River Rhine in Cologne, the 5
highest in the local record. The calculated discharge was validated by application of this equation on recent floods and comparison of results with nearby cross-sections. Since flow in natural channels is typically not uniform, large errors can be expected when the Gauckler–Manning equation is applied to a single flood mark and one cross-section. The separation of the cross-section area into more or less homogenous units 10
reduces this problem significantly. This approach cannot be used for floods caused by ice-jam or those with temporal bridge obstruction by woody debris raising the flow level instead of an increased discharge (Herget et al., 2014).
The most common historical flood discharge calculations are applied to gradually-varied flow conditions (Benito et al., 2003a; Lang et al., 2004; Naulet et al., 2005). 15
River channel geometry is generally irregular in shape and surface roughness re-sulting in non-uniform flow conditions. Gradually-varied flow analyses usually assume a steady state (constant discharge) for which flow depth varies with distance but not with time (Chow, 1959). The typical approach relating historical flood evidence to dis-charge uses the step-backwater method for gradually-varied water-surface profile com-20
putation (Benito et al., 2003a). In this method, water-surface profiles are calculated from the resolution of the conservation of mass and energy equations in their one-dimensional forms. Available public-domain computer routines, such as the US Army Corps of Engineers HEC-RAS Hydrologic Engineering Center (2010), provides com-putation of water-surface profiles for specified discharges, and energy loss coefficients. 25
HESSD
12, 4413–4469, 2015Quantitative historical hydrology
in Europe
G. Benito et al.
Title Page
Abstract Introduction
Conclusions References
Tables Figures
◭ ◮
◭ ◮
Back Close
Full Screen / Esc
Printer-friendly Version Interactive Discussion
Discussion
P
a
per
|
Discussion
P
a
per
|
Discussion
P
a
per
|
Discussion
P
a
per
|
flood discharges by testing outcomes of plausible ranges of Manning’s nvalues and possible changes in channel geometry. Challenging for this approach is the demand for several quantified cross-sections along a valley which are usually hard to determine from historic descriptions. Consequently, the variation of the geometry and roughness parameters along a valley can only be assumed.
5
Recent advances in two-dimensional computing flow hydraulics (Kutija, 2003) have been considered for historical flood studies (Fernandez Bono and Grau-Gimeno, 2003; Calenda et al., 2005). In alluvial rivers, flow over the banks show a three dimensional behaviour and this should be analysed by two-/three-dimensional models. However, already even 2-D-modelling requires a large amount of high resolution channel and 10
floodplain topographic information to define the working mesh as well as detail data about changes in historical topography after construction of buildings and roads, as well as spatial variability of roughness.
Flood hydrographs are essential for different engineering applications including dam operation and safety (Swain et al., 2006). The few essays to obtain hydrographs from 15
palaeoflood studies have used probabilistic hydrographs (England et al., 2003; Benito et al., 2011). Recently, Elleder (2010) reconstructed the February 1784 flood of the River Vltava in Prague based on peak flood marks, daily newspapers and explanatory notes accompanying early instrumental measurements on the Klementinum observa-tory. The hydrograph showed only 45 h time to peak in Prague with a 4 m water level 20
rise during a 12 h, a steep rise exceeded only by the August 2002 flood (Brázdil et al., 2005a, 2006a) (Fig. 5).
4.3 Assumptions and uncertainty evaluation of the estimated historical
discharges
The reconstruction of historical flood records is subject to assumptions, limitations and 25
HESSD
12, 4413–4469, 2015Quantitative historical hydrology
in Europe
G. Benito et al.
Title Page
Abstract Introduction
Conclusions References
Tables Figures
◭ ◮
◭ ◮
Back Close
Full Screen / Esc
Printer-friendly Version Interactive Discussion
Discussion
P
a
per
|
Discussion
P
a
per
|
Discussion
P
a
per
|
Discussion
P
a
per
|
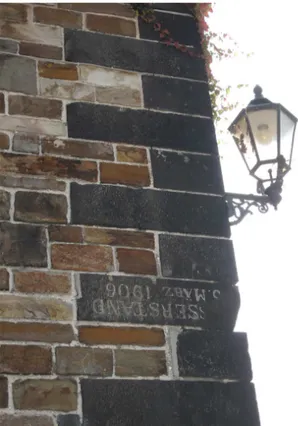
importance to confirm that the identified flood marks and sites used as flood level indi-cators are not removed since the time of flood event. Previous experience shows that (1) epigraphic marks could be easily removed from the original site during restoration works (Fig. 6), (2) some original land mark (street, wall, or floor) could be buried or their names changed the location (Deutsch et al., 2006; Munzar et al., 2006; Mac-5
donald, 2007). Non-typical examples of flood marks are signs of flood levels recorded on the River Vltava in Prague with respect to the head of “bearded man” (in Czech
Bradáč) (Elleder, 2003; Brázdil et al., 2005a) or for the River Elbe at Děčín on the
Czech-German border located on the castle rock (Brázdil et al., 2005a; Kotyza, 2006). A second set of uncertainties is related to the hydraulic setting and transformation 10
of water level into discharge. The hydraulic calculations assume a precise characteri-sation of the channel geometry which remains invariant during the flood event and, in most cases, steady flow in subcritical flow conditions. In a given cross-section, the por-tions of effective flow (flow in the downstream direction) should be distinguished from regions of the channel that do not convey discharge downstream (e.g. eddy flows). 15
Ideally, the model should be calibrated using known water surface elevation and dis-charges from contemporary floods, and if necessary carry out changes according to the historical vegetation and past urban configuration. Although the discharge estima-tion can be made on the basis of a single historical mark or flood evidence, confidence in the discharge determination is enhanced when calculated water surface profiles are 20
matched by several flood marks or other inundation references along the study reach (Machado et al., 2015).
The effect of bridges, channel constrictions and obstacles in general, if they get blocked by ice jams or woody debris during the flooding, constitute another issue to be considered during the hydraulic modelling implementation (Fig. 5a). This blocking is 25
HESSD
12, 4413–4469, 2015Quantitative historical hydrology
in Europe
G. Benito et al.
Title Page
Abstract Introduction
Conclusions References
Tables Figures
◭ ◮
◭ ◮
Back Close
Full Screen / Esc
Printer-friendly Version Interactive Discussion
Discussion
P
a
per
|
Discussion
P
a
per
|
Discussion
P
a
per
|
Discussion
P
a
per
|
the June 2013 flood was only a few hundreds of km2 producing significant effects on the flood peak discharges (Blöschl et al., 2013). Note that the largest pan-European flood event of March 1784 was also caused by sudden release of water from local ice jams (Brázdil et al., 2010) (Fig. 5).
Assumptions concerning the hydraulic method and models applied to calculate dis-5
charge, type of flow (uniform vs. non-uniform), the effective flow area and choice of energy-loss coefficients cause uncertainty in discharge estimates. For instance, in the River Elbe in Dresden, the official peak discharge of the 1845 flood is 5700 m3s−1
whereas the water profile calculations by means of one- and two-dimensional hydraulic models provides a value of 4335 m3s−1, a discrepancy attributed to an inaccurate
10
stage-discharge relationships at the gauge (Pohl, 2008).
4.4 Flood frequency analysis
A fundamental problem in hydrology is the analysis of the flood frequency or discharge corresponding to an occurrence interval (return period). This estimation is necessary to the correct design and location of structures (dams, bridges, industrial buildings) and 15
in the flood hazard mapping. The statistical analysis of extreme values has been highly improved since earlier work by Foster (1924), describing the application of frequency curves to engineering problems. Fisher and Tippett (1928) developed frequency dis-tributions of maximum values, subsequently applied by Gumbel (1945) to floods. The flood-frequency analysis (FFA) was presented as a replicable method for quantifica-20
tion of uncertainty based on a large number of flood data. There are several important problems in applied flood statistics to the study of large floods. The first concern is the complexity of natural phenomena and the second is the assumption that data collected on river gauges are representative of the largest and rarest floods (Baker, 1994). The design engineer Vance A. Myers (1967) highlighted the consequences of using FFA 25
HESSD
12, 4413–4469, 2015Quantitative historical hydrology
in Europe
G. Benito et al.
Title Page
Abstract Introduction
Conclusions References
Tables Figures
◭ ◮
◭ ◮
Back Close
Full Screen / Esc
Printer-friendly Version Interactive Discussion
Discussion
P
a
per
|
Discussion
P
a
per
|
Discussion
P
a
per
|
Discussion
P
a
per
|
nature had shown what she could do on a particular stream in a relatively few decades. This confidence was later found to be misplaced. The more cautious showed a feeling that major floods were among the imponderables, whose evaluation was impossible by the techniques then available. Some earth dams built during this period have failed due to insufficient spillway capacity”. The design of sensible infrastructures was highly im-5
proved when historical flood data was considered. For instance, the spillway capacity of the Saucelle (13 282 m3s−1) and Aldeadávila (12 500 m3s−1) dams in the River Duero
(Spain) were designed on the basis of a deterministic application of reconstructed his-torical discharges from the 1597, 1739 and 1909 flood marks (Rodríguez-Marquina, 1949a, b).
10
The use of historical floods for FFA has been more frequent since pioneer publi-cations by Benson (1950) and Leese (1973) incorporating non-systematic (historical) data together with gauge records. Documentary data are particularly valuable where there is an account of all floods exceeding a certain stage (threshold), or censured level, over a long period prior the instrumental gauging (Fig. 1). Generally, this mini-15
mum flood level required to assure documentary evidence of flooding is related with a perception threshold to which the contemporary society was susceptible in terms of damage or social disruption (Stedinger and Cohn, 1986; Francés et al., 1994). This per-ception threshold is frequently related to a flood water-level within urban sensible zones (e.g. market, bridge, church) (Barriendos et al., 2003). The most common approach as-20
sumes that each flood exceeding this threshold has been recorded in the documentary record (Fig. 1a and b). For instance, flooding of the Aranjuez Royal gardens (Spain) is produced when the River Tagus overtopped the river banks during discharges ex-ceeding 300 m3s−1 (Benito et al., 2003a). A list ofk
i observations above an arbitrary
specified discharge threshold Xi in ni years is similar to the analysis of partial
dura-25
vari-HESSD
12, 4413–4469, 2015Quantitative historical hydrology
in Europe
G. Benito et al.
Title Page
Abstract Introduction
Conclusions References
Tables Figures
◭ ◮
◭ ◮
Back Close
Full Screen / Esc
Printer-friendly Version Interactive Discussion
Discussion
P
a
per
|
Discussion
P
a
per
|
Discussion
P
a
per
|
Discussion
P
a
per
|
ous human activities and occupation of riverside areas. Naulet et al. (2001) classified the documentary flood data on four types (Fig. 1b): (1) exact type when flood discharge is known (e.g. water mark), (2) lower bound type if we know that the flood level was higher than a lower bound (Xi), which is known, (3) upper bound type if it is only known
that the flood at timet was smaller thanXu, which is the upper bound; and (4) double
5
bound type if it is known that flood discharge was bracketed by a double bound where Xi and Xu are known. These historical flood data (known as non-systematic) can be combined with systematic annual data from the gauge stations. FFA commonly uses parametric models (defined finite number of parameters) combining a cumulative prob-ability distribution function and a parameter estimation method (Stedinger and Cohn, 10
1986). Most of the distribution functions (Gumbel, Log-Person, GEV) that are used in conventional FFA has been applied with historical data (Stedinger et al., 1993). Sev-eral methods have been used in the estimation of the statistical parameters for the selected distribution functions (Strupczewski et al., 2014). The most efficient methods to incorporate imprecise and categorical data are: (1) maximum likelihood estimators 15
(Leese, 1973; Stedinger and Cohn, 1986; Francés, 2001), (2) the method of expected moments (Cohn et al., 1997; England et al., 2003); and (3) Bayesian methods (Kucz-era, 1999; O’Connell et al., 2002; O’Connell, 2005; Reis and Stedinger, 2005). Several reviews of these methods have been published by Stedinger et al. (1993) and Francés (2004), and case study applications in Europe can be found, among others in Calenda 20
et al. (2009), and Botero and Francés (2010).
A recent review by Kjeldsen et al. (2014) observed a scarce use of historical data for frequency estimates in 16 countries of Europe, identifying three main reasons: (1) the lack of unified database depositories, (2) uncertainty associated with discharge es-timates, (3) concerns about violation of stationary assumption when using historical 25
HESSD
12, 4413–4469, 2015Quantitative historical hydrology
in Europe
G. Benito et al.
Title Page
Abstract Introduction
Conclusions References
Tables Figures
◭ ◮
◭ ◮
Back Close
Full Screen / Esc
Printer-friendly Version Interactive Discussion
Discussion
P
a
per
|
Discussion
P
a
per
|
Discussion
P
a
per
|
Discussion
P
a
per
|
historical flood about twice length of the pre-instrumental record (Strupczewski et al., 2014). Many documentary-based flood studies shown that flood frequency has been influenced by the internal variability of atmospheric circulation, with flood clusters at some time periods (Glaser et al., 2010), or by impacts on the environmental patterns such as land-use (Benito et al., 2010) and engineering works (Machado et al., 2015). 5
A simple test of stationarity for censored samples (systematic and/or non-systematic) was proposed by Lang et al. (1999) assuming that the flood series can be described by a homogenous Poisson process (Naulet et al., 2005). It is recommended to select a sample above a high discharge threshold in order to produce an exhaustive and ho-mogeneous set, avoiding bias in relation with archive availability or flood risk exposure 10
(Barriendos et al., 2003).
5 Discussion and perspectives
5.1 Discharge of historical floods in the context of instrumental records
Quantitative historical hydrology provides a multi-centennial perspective of extreme flood magnitudes. In Europe, there is a long tradition in the study of historical floods 15
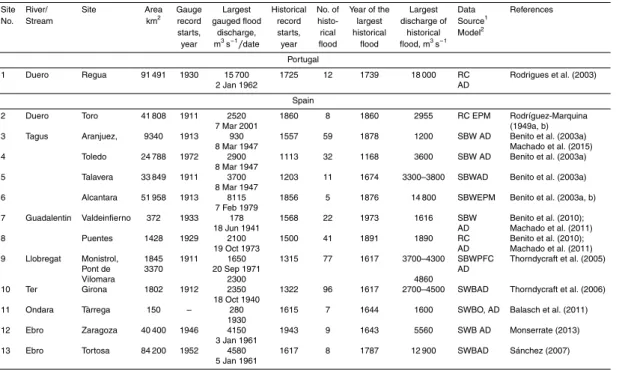
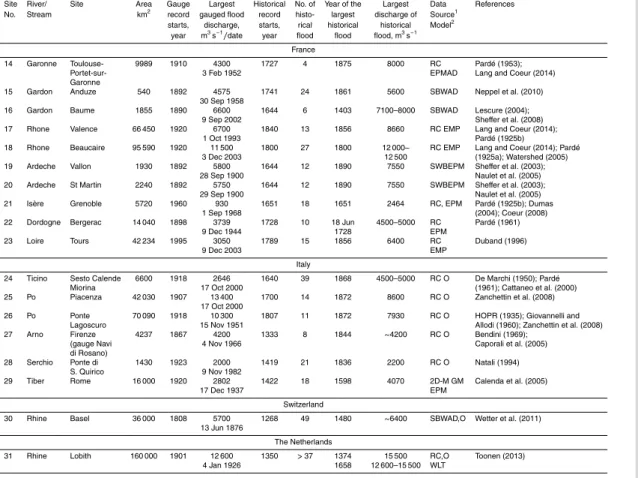
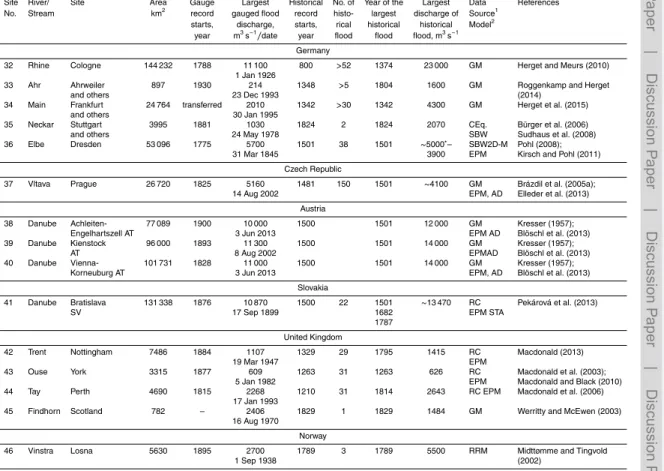
in the context of historical climatology (Brázdil et al., 2005b; Glaser et al., 2010) although reconstruction of peak discharges associated to documentary data is still scarce (Fig. 7). Table 1 shows a compilation of 45 case studies with historical dis-charge estimates at sites with multiple floods with disdis-charge estimates published in peer review papers or being cross-checked with the original historical sources. Numer-20
ous studies suggest that current flood magnitudes are not unusual within the context of last 1000 years, with good examples for the rivers Rhine (Herget and Meurs, 2010; Wetter et al., 2011), Tiber (Calenda et al., 2005), Llobregat (Thorndycraft et al., 2005), Trent (Macdonald, 2013) and Gardon (Sheffer et al., 2008; Neppel et al., 2010). In gen-eral, the largest historical floods from the last 500 years show higher peak flows than 25
his-HESSD
12, 4413–4469, 2015Quantitative historical hydrology
in Europe
G. Benito et al.
Title Page
Abstract Introduction
Conclusions References
Tables Figures
◭ ◮
◭ ◮
Back Close
Full Screen / Esc
Printer-friendly Version Interactive Discussion
Discussion
P
a
per
|
Discussion
P
a
per
|
Discussion
P
a
per
|
Discussion
P
a
per
|
torical and gauged flood is mainly characteristic for small catchments and in Mediter-ranean rivers (e.g. Llobregat, Ter, Ticino, Tiber and Isère rivers). In these regions, the knowledge of historical peak flows may provide important insight in flood hazard pre-vention. For example, the 2002 flood of River Gardon (France), that claimed the lives of 23 people and cause EUR 1.2 billion worth of damage, was larger than any gauged 5
flood since 1890 (DDE, 2003). However, a documentary and palaeoflood-based study demonstrated that at least five floods larger than the 2002-flood occurred in AD 1400– 1800, i.e. during the Little Ice Age (Sheffer et al., 2008).
In some cases, recent flooding in central and northern Europe reached similar mag-nitude or even higher than those reconstructed from documentary records, such as the 10
River Vltava in Prague (Brázdil et al., 2005a; Elleder et al., 2013), and the records in the lower River Po (HOPR, 1935; Zanchettin et al., 2008) (Fig. 7). In the case of the River Findhorn in UK, the official gauged discharge for the 1970-flood was ca. 60 % higher than the reconstructed peak flow for the 1829-flood, although the former plots above the envelope curve for Scottish runoff, raising doubt about their credibility (Werritty and 15
McEwen, 2003).
5.2 Multi-proxy analysis of past hydrological extremes
Documentary archival data on floods in general are ubiquitous across Europe al-though the computation of peak discharges depends on the availability of reliable epigraphic flood marks or thoroughly documented water level descriptions. In most 20
cases, these flood marks are located in urban settings with frequent changes of the river channel topography that increase uncertainty of the values obtained when com-puting flood discharge. The combination of historical and palaeoflood (sedimentary) flood data has been demonstrated to be a very effective tool for improving the cata-logue of past flooding and reducing uncertainties on flood discharges (Thorndycraft 25
uncer-HESSD
12, 4413–4469, 2015Quantitative historical hydrology
in Europe
G. Benito et al.
Title Page
Abstract Introduction
Conclusions References
Tables Figures
◭ ◮
◭ ◮
Back Close
Full Screen / Esc
Printer-friendly Version Interactive Discussion
Discussion
P
a
per
|
Discussion
P
a
per
|
Discussion
P
a
per
|
Discussion
P
a
per
|
tainty of numerical dating (radiocarbon respectively optically stimulated luminescence methods) used in palaeoflood studies may be refined based on known documentary floods (Medialdea et al., 2014). The SPHERE Project has revealed the complementary of palaeoflood and historical flood information (Benito and Thorndycraft, 2004) with major gain on the quality of past flood records in terms of time and discharge, as it is 5
demonstrated in the studies performed for the rivers Gardon (Naulet et al., 2005; Shef-fer et al., 2008), Ardèche (Sheffer et al., 2003; Naulet et al., 2005), Llobregat (Thorndy-craft et al., 2005), and Guadalentin (Benito et al., 2010; Medialdea et al., 2014). New emerging palaeoflood archives from lake records show a great potential for synergy with documentary floods to complete regional records of extreme events to understand 10
flood–climate relationships (Wilhelm et al., 2012; Corella et al., 2014). For instance, in Montcortés Lake (NE Spain) a varved sediment core accumulating since the 14th century contains detrital layers associated to intense rainfalls (>80 mm day−1)
record-ing higher storm frequency durrecord-ing AD 1347–1400 and AD 1844–1894, both periods coincide with severe floods from the nearby River Segre (Corella et al., 2014).
15
5.3 Flood magnitude sensitivity to climate change
Climate variability may affect both flood frequency and magnitude with greater sensi-tivity on largest “rare” floods (50 year flood and higher) than on smaller frequent floods (2 year floods; Knox, 1993, 2000). The study of historical floods in the context of climate variability has been focussed on high-quality complete datasets classified according to 20
severity of damage (Sturm et al., 2001) to infer changes in flood frequency, meteorolog-ical causes and seasonality (Glaser et al., 2010). The classification of histormeteorolog-ical floods according to peak discharge or discharges over some threshold allows further analysis on the sensitivity of flood frequency in relation to their magnitude. Furthermore, this classification based on discharge classes allows consideration of the most recent in-25
HESSD
12, 4413–4469, 2015Quantitative historical hydrology
in Europe
G. Benito et al.
Title Page
Abstract Introduction
Conclusions References
Tables Figures
◭ ◮
◭ ◮
Back Close
Full Screen / Esc
Printer-friendly Version Interactive Discussion
Discussion
P
a
per
|
Discussion
P
a
per
|
Discussion
P
a
per
|
Discussion
P
a
per
|
different European rivers where numerical or categorical flood magnitude during the historical period was completed with comparable data from gauged records (Fig. 8). Two flood categories were differentiated: (1) catastrophic floods (CAT) associated with high flood discharge or severe damages, and (2) extraordinary floods (EXT) causing inundation of the floodplain with moderate-to-minor damages.
5
In Central Spain, increased flood frequency of large floods was identified in AD 1000–1200, 1525–1625 and in the late 19th–early 20th centuries (Benito et al., 2003a; Fig. 8a). During the second half of the 20th century, the frequency of floods decreased, in connection with a dominant positive mode of the North Atlantic Oscillation during winter months; however, flow regulation by dams also played an important role in this 10
flood frequency decline since the mid-1950s. In the River Segura (SE Spain) the fre-quency of catastrophic (autumn) floods decreased since the late 19th century together with the frequency of intense rainfall events except some decades (e.g. the 1970s and 1980s), in which intense rainfall and flooding co-existed with severe drought conditions (Fig. 8b; Machado et al., 2011).
15
In the River Gardon (southern France), the frequency pattern of large floods (>50 yr floods) has decreased since the late 19th century, whereas the extraordinary and or-dinary floods increased during the 20th century (Fig. 8c) (Sheffer et al., 2008; Neppel et al., 2010). In the River Tiber (Central Italy) extreme floods were particularly frequent in 1400–1500 and 1600–1700 (Camuffo et al., 2003). Large-catastrophic floods ex-20
ceeding the 17 m stage (<2900 m3s−1) at the Ripetta Landing (16 545 km2) were not
constant in time: four floods above 18 m (<3400 m3s−1) took place in only 80 years
during the period 1530–1606 (Calenda et al., 2005), intriguingly a period of reported low flood frequency by Camuffo and Enzi (1996). Recent flooding is difficult to evaluate in the context of climate change due to river regulation structures, although only three 25
extreme floods (>2550 m3s−1) were recorded since 1900 (Fig. 8d). Extraordinary flood
events exceeding 1400 m3s−1prior to 1970 occurred with a mean frequency of seven
HESSD
12, 4413–4469, 2015Quantitative historical hydrology
in Europe
G. Benito et al.
Title Page
Abstract Introduction
Conclusions References
Tables Figures
◭ ◮
◭ ◮
Back Close
Full Screen / Esc
Printer-friendly Version Interactive Discussion
Discussion
P
a
per
|
Discussion
P
a
per
|
Discussion
P
a
per
|
Discussion
P
a
per
|
flood (12.55 m, ca. 1400 m3s−1), are currently producing large economic impacts that
demonstrates the increased flood vulnerability of the Rome region despite of decreas-ing flood hazard by flow regulation (Natale and Savi, 2007).
Several types of meteorological events and different storm types result in mixed flood distributions, each characterized by individual probability distribution parameters 5
(Hirschboeck et al., 2000). Climatic variability can lead to flood magnitude/frequency changes affecting one or various types of flood populations (e.g. early spring snow-melt, convective storms) with relevant implications in the non-stationarity of the sta-tistical parameters supporting flood probability analysis (Milly et al., 2008). Documen-tary records provide information on prevailing circulation types producing floods based 10
on changes in flood seasonality. Macdonald (2012) studying the River Ouse, a large catchment within a UK perspective, has identified a higher frequency of summer floods within AD 1700–1849 than in the AD 1850–1999 period. Furthermore, the combined documentary and instrumental flood record (Macdonald and Black, 2010) illustrates that the frequency of extraordinary floods within the range of 350 to 500 m3s−1 have
15
increased during the 20th century, in particular comparatively to the most extreme floods (>500 m3s−1; Fig. 8e). In Central Europe, long records of the Elbe and the
Oder/Odra rivers showed a decrease in winter floods during the last 80 to 150 years (Fig. 8g and h), while summer floods showed no significant trend (Mudelsee et al., 2003). This change in seasonal flood patterns is reflected in the recent trend towards 20
an overall decrease on flood magnitude, although in the case of the River Vltava (Czech Republic) the August 2002 flood reached the highest peak flow on record (Fig. 8f; Brázdil et al., 2005a). In the River Rhine at Basel (Switzerland) severe summer (JJA) floods were particularly frequent between 1651 and 1750, in relation to enhanced pre-cipitation; severe winter (DJF) floods have not occurred since the late 19th century, 25
despite a significant increase in winter precipitation (Wetter et al., 2011).
block-HESSD
12, 4413–4469, 2015Quantitative historical hydrology
in Europe
G. Benito et al.
Title Page
Abstract Introduction
Conclusions References
Tables Figures
◭ ◮
◭ ◮
Back Close
Full Screen / Esc
Printer-friendly Version Interactive Discussion
Discussion
P
a
per
|
Discussion
P
a
per
|
Discussion
P
a
per
|
Discussion
P
a
per
|
age, or as a consequence of rapid release of water after the ice jam failure (Beltaos, 2008). During the AD 1550–1850 period, ice cover on large mainland European rivers combined with late winter and spring snowmelt generated very large floods, similar to what is observed today at higher latitudes. In the Netherlands many floods over the 1750–1860 period were associated with ice jams, particularly on the River Waal (e.g., 5
in 1781, 1784, 1799, 1805 and 1809; Driessen, 1994). Detailed records describing the winter ice jam floods in 1784 are widely recorded across much of western and cen-tral mainland Europe (Demarée, 2006; Brázdil et al., 2010, 2012) (Fig. 5). In the River Mosel, the 28 February 1784 flood water-level was significantly higher than any other recorded during the past millennium (Sartor et al., 2010), although any discharge esti-10
mation should consider that ice jams can raise water levels to much higher elevations than open-water floods (Beltaos, 2008). Other factors enhancing flood severity through time includes timing of melting of glaciers (Debret et al., 2010). Global warming is intro-ducing changes in the spatial (latitudinal) and temporal (seasonal) distribution of flood-ing related to ice and snowmelt (Beltaos and Prowse, 2009). For example, changes 15
in the hydrometerological conditions that generate flooding may enhance flood mag-nitude in Norway, due to an earlier onset of snowmelt related to flooding in the region (Hisdal et al., 2006), whereas in mainland Europe, flooding related to ice-jams are now unlikely to occur (Kundzewicz et al., 2014).
5.4 Historical floods in a non-stationary hydrology
20
The comparative analysis of historical records at different catchments across Europe points to the fact that the temporal distribution of flood frequency is predominantly mod-ulated by regional meteorological triggers (Glaser et al., 2010). In regions where floods are generated by several types of weather conditions, each flood population is com-posed by a probability distribution resulting in mixed distributions. Long-term climate 25
sys-HESSD
12, 4413–4469, 2015Quantitative historical hydrology
in Europe
G. Benito et al.
Title Page
Abstract Introduction
Conclusions References
Tables Figures
◭ ◮
◭ ◮
Back Close
Full Screen / Esc
Printer-friendly Version Interactive Discussion
Discussion
P
a
per
|
Discussion
P
a
per
|
Discussion
P
a
per
|
Discussion
P
a
per
|
tems oscillate within an unchanging envelope of variability (Milly et al., 2008). In the case of extreme events, secular records of historical floods show a temporal variability (clusters) fluctuating at multi-decadal time scale. However, the underlying driving fac-tors causing past departures from stationarity are far from being random phenomena. The temporal changes in the trajectory and statistics of a variable may be linked to nat-5
ural, low-frequency variations of the atmospheric circulation, external forcings (solar cy-cles) or anthropogenic changes. Therefore, a detail characterisation of natural variabil-ity of past floods will facilitate the attribution and modelling of future variabilvariabil-ity due to na-ture and human impacts. The statistical parameters may show increasing/decreasing changes that can be modelled (as a trend or smooth function) using time as covariate 10
(Villarini et al., 2009), or they can be related to hydro-climatic covariates such as cir-culation indices (e.g. Pacific Decadal Oscillation-PDO, North Atlantic Oscillation-NAO, Arctic Oscillation-AO) characterising this low frequency climatic variability (López and Francés, 2013). The application of these non-stationary models to historical and palae-oflood hydrology requires a numerical characterisation of the occurrence rate (covari-15
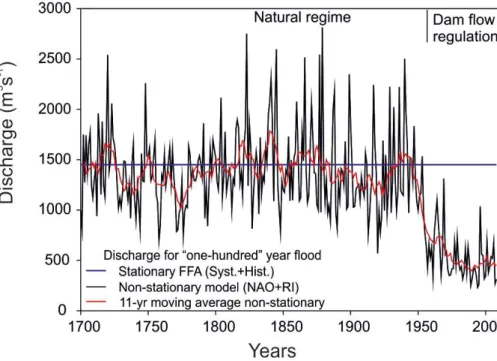
ate) during the recorded period. Several studies have demonstrated the relationships between flood frequency and magnitude with circulation indices, such as NAO index (Salgueiro et al., 2013). The application of a non-stationary flood frequency analysis in a 300 yr record with 32 documented floods (>350 m3s−1) of the River Tagus were
successful to model the fluctuations of flood quantiles (e.g. “100 year flood”) using the 20
North Atlantic Oscillation index and a reservoir index as external covariates (Machado et al., 2015). This non-stationary modelling was based on Generalized Additive Mod-els for Location, Scale and Shape parameters (GAMLSS; Rigby and Stasinopoulos, 2005) that described the temporal variation of statistical parameters (mean, variance) in probability distribution functions (Villarini et al., 2010; López and Francés, 2013). In 25
this example, the non-stationary models show that the peak flood associated with a “hundred year” flood (0.01 annual exceedance probability) may range between 4180 and 560 m3s−1, whereas the same model under stationary conditions provided the