1D
HYDRAULIC MODEL IN RELATION WITH THE PLANNEDT
ISZA RESERVOIRSS. KOVÁCS1
ABSTRACT. – 1D hydraulic model in relation with the planned Tisza
reservoirs. The floodwaves of 1998-2001 and the year 2006 reached never before
measured heights on the river Tisza. The peak heights of the upper and middle reaches of the river exceeded the maximum values by 130-150 cm. Such an intense growth has never been experienced (the peak heights measured at the Tivadar gauging station exceeded the values of 1970 by 149 cm and at the Szolnok gauging station by 132 cm), not even after the river regulations in the XIX. century. The new, critical maximum water levels urged the reconsideration of the flood protection system’s development strategy alongside the river Tisza. Taking the present flood-conveyance capacity with its declining tendency and the possible reoccurrence of the latest (1998-2001) or earlier (1970, 1947/48, 1940, 1941, 1932, 1919, 1895, 1888) hydro-meteorological phenomena into consideration, the success of a flood protection procedure can only be guarantied by the improvement of the riverbed’s flood conveyance capacity and the concerted operation of several reservoirs. The concerted and effective operation of the reservoirs (6 to be built in the I. development phase and others to be constructed later) have to be based on a complex and steering high-water operational model, a constantly updated data-base and a well functioning organization. The river Tisza demonstrated its power this year as well. The river exceeded the highest water levels on a 270 km long reach from Tiszaug (Tiszainoka) down to the Danube influx. Experiencing the flood of spring 2006, the floodwave of 2000, called to be the floodwave of the millennium, is not exceptional anymore. It seems, that we have to prepare for water levels 100-150 cm higher than the maximum levels of the last, hydro-meteorologicaly similar period of 1960-1970. This statement is based on the following: considering the data of the period 1901-2006, the 1% water level calculated by traditional probability theory is 1059 cm, calculated by intercept method is 1058 cm. For the accuracy of our forecasts, during the flood in spring 2006 we combined the hydrodynamic model with our forecasts prepared for the boundary cross-sections. In this study we present the hydrodynamic model prepared for a 740 km long reach of the river Tisza and the combination of the model with the forecast system.
Keywords: maximum discharge, Water discharge curves, 1D hydrodynamic
modelling, hydraulic engineering structures, calibration of the model
1. Results of hydrological surveys
Because of its returning and gradually increasing, and sometimes extremely high floods as well as recurring and lasting law waters the River Tisza is considered to be the most variegated river of our country. Characteristics of the river decisively originate from the shape of the drainage system, from the relation of water output of tributaries to the main stream, from the considerable amount of drift, from the small slope on the long lowland section and from the regulation of both low and high water bed. Current length of the River Tisza is 945.8 km; its catchment area covers 157.200 km2. According to the measurements of past decades the maximum water discharge of the river at the Tivadar section (705,7 stream-km) exceeds the value of 4.000 m3/s, in the middle section, between Kisköre and Szolnok it is between 2.600 and 2.900 m3/s, while in the lower section, i.e. at Szeged (173,6 stream-km) it is over 4.000 m3/s.
TISZA, SZOLNOK Q=f(H) - Rating Curve
600 650 700 750 800 850 900 950 1000 1050
900 1000 1100 1200 1300 1400 1500 1600 1700 1800 1900 2000 2100 2200 2300 2400 2500 2600 2700 2800 2900 3000 3100 3200 3300 3400 discharge (m3/sec)
water level (cm)
2000. április
1999. március
1970. május
1895. április
1932. április
1979. február 2006. április
Figure 1. Water discharge curves on the River Tisza at the Szolnok section
(334,6 str-km)
track has changed and also the bed slope has increased slightly. The slope of the water surface is changing between 1 to 6 cm/km on the lowland section. There have been embankments built alongside the river. Currently, the embankment system of the Tisza lasts from Tiacev (Ukraine 887 stream-km) completely down to the mouth and the “blond” river moves on the water and drift circulation between these embankments, on a considerably smaller area than before the regulations. The bed of tributaries on their lowland section was also regulated similarly to the Tisza; there are embankments rising alongside the tributaries on more hundred kilometres. The total width of the river changes between rather wide limits, that is between 350 to 6000 m.
In the course of years between 1998 and 2006 such flood waves subsided on the River Tisza which have never been experienced before. The values of culminations have exceeded the previous maximum values by 130 to 140 cm. These new flood waves of critical height resulted in the reconsideration of flood prevention alongside the River Tisza. We can best and most accurate demonstrate the water discharge ability of the bed by analysing of water outputs. We may declare this despite the fact, that because of the slight bed and water surface slopes, the back-swelling effects of the Hármas-Körös, the Maros and, to a certain extent, also the Danube have impact onto the pass down of flood waves and onto the shape of flood loop curves at the same time.
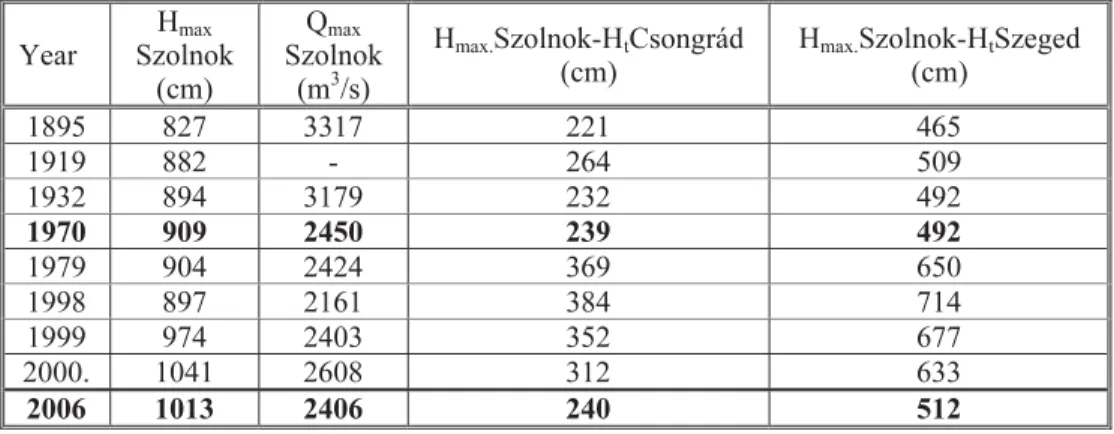
Table 1 indicates the maximum discharges measured at the Szolnok cross-section and water-level differences in relation to Csongrád and Szolnok-Szeged. This table demonstrates the decline in the river’s water conveyance capacity.
Table 1. Maximum water levels and discharges of the Tisza at the
Szolnok cross-section
Year
Hmax
Szolnok (cm)
Qmax
Szolnok (m3/s)
Hmax.Szolnok-HtCsongrád
(cm)
Hmax.Szolnok-HtSzeged
(cm)
1895 827 3317 221 465
1919 882 - 264 509
1932 894 3179 232 492
1970 909 2450 239 492
1979 904 2424 369 650
1998 897 2161 384 714
1999 974 2403 352 677
2000. 1041 2608 312 633
2006 1013 2406 240 512
disregarded by all means. It is possible, only by the processing and analyses of these measurement results, to find an explanation and to understand the phenomena have been taking place in the regulated bed for 100 years.
Let us control the section of the Tisza at Szolnok. Fig. 1 demonstrates the water output measurements on the occasions of floods with outstanding dimensions in the years 1895, 1932, 1970, 1979, 1999, 2000 and 2006. It has to be mentioned, that the measurements in 1895 and 1932 were performed not direct in the section at Szolnok, but in the constrictions of Tiszapüspöki and Vezseny, however, the water levels were related to the water measurement post at Szolnok already at the time of measurements.
The measurement results obtained in 1970 (Hmax = 909 cm) and in 1979 (Hmax = 904 cm) were very resembling to each other considering both water levels and water output. To the culminations that slightly exceeded the 900 cm there were water outputs belonging over 2.400 m3/sec. Between 1932 and 1970, there were 38 years elapsing. (Almost exactly as many years as between 1895 and 1932) However, the culminating water levels in 1970 and 1979 that slightly exceeded the values of 1932 occurred at water outputs that were less by 400 to 500 m3/s.
One of the decisive elements of the Update of the Vásárhelyi Plan Program is the knowledge of differences between the highest water levels and the authoritative flood levels along the longitudinal section of the River Tisza (Figure 2).
77 79 81 83 85 87 89 91 93 95 97 99 101 103 105 107 109 111 113 115 117 119 121 123 0 .0 1 0 0 .0 2 0 0 .0 3 0 0 .0 4 0 0 .0 5 0 0 .0 6 0 0 .0 7 0 0 .0 -100 -90 -80 -70 -60 -50 -40 -30 -20 -10 0 10 20 30 40 50 60 70 80 90 100 110 120 130 MÁSZ LNV (interpolált)
DIFFERENCES BETWEEN MAXIMUM AND DISIGN WATER LEVELS
Z mB.f. fkm LNV-MÁSZ ∆Η (cm)
Figure 2. The difference between the highest water levels and the authoritative flood levels
Based on the figure the most critical sections can be designated alongside the river and the sequence of interventions, like the reinforcement and strengthening of embankments, regulations on the flood plain, construction of reservoirs, can be determined.
In this paper we shortly summarize our 1D hydrodynamic modelling activities serving as a base for further planning. The modelling has been accomplished by applying the HEC-RAS software. When selecting the hydraulic model, it was of fundamental importance to work with a program that operates on good physical bases, and is easy to handle with short running time and displays the results in a well structured form. In the decision process it was of outstanding importance that the five countries on the catchment area of the River Tisza might connect to the structured system or to a certain segment of joint interest of that.
2. 1D Hydraulic modelling of the water system of the river Tisza
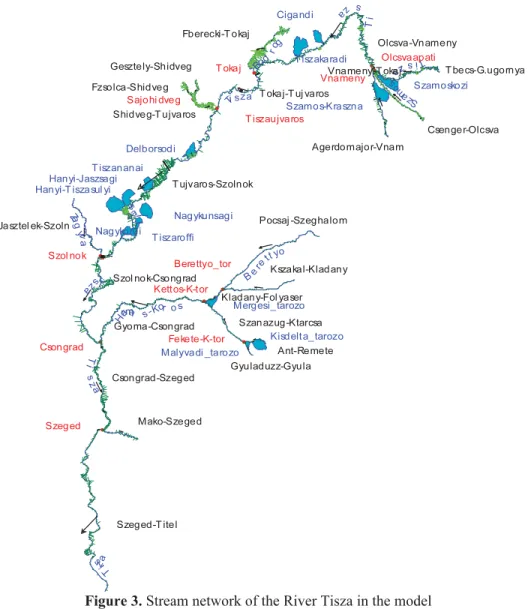
2.1 The stream network
In its current structure, the database of the model includes the 740 km long rives section between Tiszabecs and Titel, as well as the 8 tributaries mouthing into the main stream, moreover, two branches (Borzsa and Lónya Canal) as concentrated load. The total length of streams involved into calculations exceeds 1.500 km (Fig. 3). We have approached the stream system of the River Tisza and its tributaries by more than 1.550 cross sections. We installed 84 bridges and 11 flood reducing structures into the model.
2.2 Cross section data
The HEC-RAS model (together with the other 1D models) is suitable for inputting cross sections determined by the traditional distance-height point couples as well as for operation of databases based on geographic informatics systems (GIS). We presented the cross sections with the help of digital relief map on the river section between Kisköre and the southern confines of the country. On the strongly overgrown flood plain areas, in the line of channel bars, we corrected the data of relief map by geodetic measurements. In the assembly of the river system it was a great assistance from the part of Serbian water management professionals, that they made the cross sections of the river between the southern boundary and the mouth available for us.
2.3 Hydraulic engineering structures
Pocsaj -Szeghalom
Be
re tt yo
Fberecki-T okaj
Bod
r og
Gyuladuzz-Gyula Ant-Remete Gyoma-CsongradH
a
rma s-Kor o s
Gesztely-Shidveg
Szanazug-Ktarcsa
Agerdomajor-Vnam
Mako-Szeged Fzsolca-Shidveg
Shidveg-T ujvaros
Kszakal-Kladany
Kladany-Fol yaser
Csenger-Olcsva
S
z a
m o
s
T becs-G.ugornya T
is
z a
Olcsva-Vnameny
Vnameny-T okaj
Ti
s
z a
T okaj-T uj varos
Ti sza
T ujvaros-Szolnok
T
i
s
z a
Szol nok-Csongrad
Tis
z a
Csongrad-Szeged
T
i
s
z a
Szeged-T itel
T
is
z a
Jasztel ek-Szoln
Za g yv
a
Kisdelta_tarozo
Malyvadi _tarozo
Mergesi_tarozo Cigandi
Szamoskozi
Szamos-Kraszna T iszakaradi
Delborsodi
Nagykorui T iszananai
Nagykunsagi Hanyi-T iszasul yi
Hanyi-Jaszsagi
T iszaroffi Sajohi dveg
T iszaujvaros
Szol nok
Csongrad
Olcsvaapati
Vnameny T okaj
Szeged
Fekete-K-tor Kettos-K-tor
Berettyo_tor
Figure 4.Detailed demonstration of roughness factors in the cross section
2.4. Roughness (smoothness) coefficient
For calculation of the water discharge capacity of the main bed as well as for taking the flood plain cultivation branches into consideration we used the roughness (smoothness) factors given in the Table 2 in the course of calibration of the model. We determined the cultivation branches on the flood plain by aerial photographs, i.e. by ortho-photographs, as well as by the results of on-site inspections. The roughness factor was changed crosswise according to flood plain cultivation branches. The roughness (smoothness) factor assigned to these was determined on the base of the prescriptions of the Hungarian standard, as well as on the base of values applied also by HEC-RAS and proposed by Chow (1959). The smoothness factors assigned to individual cultivation branches overlap each other as there is no possibility for making sharp difference between the categories of “sparse thicket” and “dense thicket” (Fig.4).
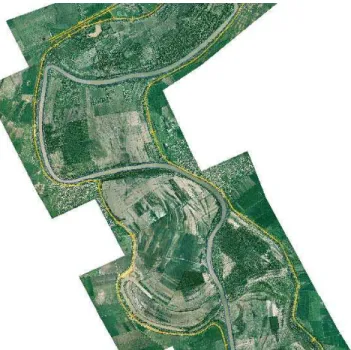
Figure 5. Bird’s eye view on the bed of the River Tisza.
With the roughness factor we practically divide the flow zones of the river into “layers”. The horizontal division of the roughness factor is definitely necessary in case of rivers with broad flood plain. On the flood plain the vegetation, forests, meadows and the different agricultural cultivation branches are located in an intermittent pattern. The water discharge capacity of the river (the roughness coefficient) is changing according to this pattern, too.
In the course of flood waves the depth of the main bed reaches 24 to 26 m at many places, especially in river bends. In case of such water depths it is necessary to divide the water movement, i.e. to create also vertical layers. As soon as the water reaches the height of the bank edge, the branches of trees protruding into the water are decreasing the movement or flow rate of the water. In the case of meandering rivers with flood plain the flow conditions are modified vertically to a great extent by the coinciding waters passing along the main bed and on the flood plain (Fig. 5). The results of water discharge measurements in the course of flood waves have proven the need of vertical modification of the roughness factor. Hydrological basic data and limiting conditions.
2.5.Calibration
0 100000 200000 300000 400000 500000 600000 700000 800000 40 50 60 70 80 90 100 110 120
Tiszabecs_Titel_uj_F_T Plan: Tiszabecs_Titel_2000_ujF_T Geom: Tiszabecs_Titel_2000_uj_F_T
Main Channel Distance (m)
El e v a tio n ( m ) Legend
WS Max WS
Ground
Left Levee
Right Levee
OWS Max WS
Tisza Szeged-Titel T
i s z a C s o n g r a d -S z e g e d T i s z a S z o l n o k -C s o n g r a d
Tisza Tujvaros-Szolnok T
i s z a T o k a j -T u j v a r o s
Tisza Vnameny-Tokaj T
i s z a O l c s v a -V n a m e n y T i s z a T b e c s -G . u g o r n y a
Figure 6The results of calibration on the river section between Tiszabecs and Titel
Figure 6 illustrates the results of the calibration process. The continuous line (red, with a blue coloured field there under) in the figure represents the envelope of calculated water levels (longitudinal section of culminations), while red dotted line shows the maximum water levels measured at standard posts and those at dam keepers in the course of the flood wave in 2000.
On the river section between Tiszabecs and Titel, in the culmination of the flood wave the difference between the calculated water level and that of observed was between 0 and 10 cm in absolute values, which can be considered as a very good result.
2.5. Verification
3. 1D Model surveys
It has been emphasized on more forums that the fundamental aim of regulations of flood plains consists in the possible restoration of water discharge ability of the River Tisza prior to the year 1970.
0 1000 2000 3000 4000 5000 6000
72 74 76 78 80 82 84 86 88 90
Kiskore_Zenta Plan: 1) Vezs-kerese
Geom: KiZe_RfVe_toltath050n River = Tisza Reach = Szolnok-Csongrad RS = 307.978
Station (m)
E
le
v
a
tio
n
(
m
)
Legend
WS Max WS
Ground
Levee
Ineff
Bank Sta .
0 6 6 5
. 0 2 7 3
.093 .0665 .05
Figure 7. Regulation of the flood plain
On the river section between Kisköre and the southern confines of the country, within the framework of transformation of land use on flood plains we plan to clean out the high water run-off stripe, the so called hydraulic corridor, the demolition of summer dikes, the formation of hollow-chamfers that follow the track of drift line and improve the water discharge performance. Similar interventions have been planned on the Upper-Tisza section in the region at Tivadar. In the Figure 7 we demonstrate the flood plain regulation in the Vezseny bend on the basis of cross section.
The survey with and without flood plain interventions (related to the authoritative conditions of the past) of the 6 reservoirs designated for the first
phase of the development will be discussed in what follows: KORMÁNYHATÁROZAT 6 TÁROZÓ HULLÁMTÉRRENDEZÉS NÉLKÜL ÉS
HULLÁMTÉRRENDEZÉSSEL 2000. ÉVI ÁRHULLÁM (Szamos-Krasznaközi, Cigándi, Hanyi-Tiszasűlyi, Nagykörűi, Nagykunsági, Tiszaroffi)
-180 -170 -160 -150 -140 -130 -120 -110 -100 -90 -80 -70 -60 -50 -40 -30 -20 -10 0 10 20 30 40
0 50 100 150 200 250 300 350 400 450 500 550 600 650 700 750
X (fkm) ∆Z
(cm)
Kormányhatározat 6 tározó hullámtérrendezéssel Kormányhatározat 6 tározó
hullámtérrendezés nélkül
hullámtérrendezés n=0,100; k=10
Figure 8. Effect of the 6 reservoirs, designated in the government decree, with and without
flood plain regulation in case of the flood wave in the year 2000.
We accomplished the survey related to the flood plain interventions and their possible effect on reservoirs with flood waves of different character. In this paper we introduce only those runs that were accomplished for the flood waves of the years 1998 and 2000. As it already has been mentioned, in the year 1998, there was an extremely high flood wave on the Upper-Tisza, while in 2000, the water level raised above the authoritative value on the Middle-Tisza section. According to this, the flood plain interventions and the flood decreasing effect of reservoirs have demonstrated differences. In the course of current calculations in question we used that version in which the value of the roughness factor was n = 0,100; k = 10 in the 600 m wide and 240 km long “hydraulic corridor”. In the case of the flood wave of the year 1998 the maximum decrease of water level would be close to 100 cm as a result of flood plain interventions and the effect of opening the reservoirs.
A flood level reducing reservoir is a basic construction that meets the main target, i.e. the flood level reduction, by appropriately constructed engineering
works, and provides also conditions for regular water supplement for land management and ecological purposes, and later for the restoration of water.
For determination of flood level reducing effect of individual reservoirs and reservoir combinations as well as for optimal selection of water intake engineering constructions a great number (close to 30) of variations have been controlled. In the course of control of this great variety more assumptions proved to be correct that were based on empirical and approximative theoretical
considerations and were proposed in more preparatory studies: Certain parameters of individual engineering structures, location of water intake structures, threshold level of floodgates and spill-over, have been determined in the course of the engineering process. Other dimensions of engineering structures (like the maximum spill-over length, number of floodgates) have been corrected upon the calculations for the preliminary hydrodynamic modelling and the opportunities of technical realization. In the course of surveys the determination of theoretically “optimal” openings of reservoirs has not been the aim, but only approximately optimal openings have been applied.
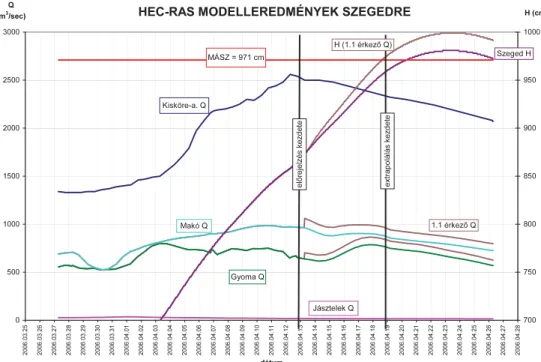
HEC-RAS MODELLEREDMÉNYEK SZEGEDRE
0 500 1000 1500 2000 2500 3000 200 6. 03. 25 200 6. 03. 26 200 6. 03. 27 200 6. 03. 28 200 6. 03. 29 200 6. 03. 30 200 6. 03. 31 200 6. 04. 01 200 6. 04. 02 200 6. 04. 03 200 6. 04. 04 200 6. 04. 05 200 6. 04. 06 200 6. 04. 07 200 6. 04. 08 200 6. 04. 09 200 6. 04. 10 200 6. 04. 11 200 6. 04. 12 200 6. 04. 13 200 6. 04. 14 200 6. 04. 15 200 6. 04. 16 200 6. 04. 17 200 6. 04. 18 200 6. 04. 19 200 6. 04. 20 200 6. 04. 21 200 6. 04. 22 200 6. 04. 23 200 6. 04. 24 200 6. 04. 25 200 6. 04. 26 200 6. 04. 27 200 6. 04. 28 dátum Q (m3 /sec) 700 750 800 850 900 950 1000 H (cm) Kisköre-a. Q Makó Q Gyoma Q Jásztelek Q e lő re je lzé s ke zd e te e x tr a p o lá lá s ke zd e te Szeged H
1.1 érkező Q H (1.1 érkező Q)
MÁSZ = 971 cm
4. Application of the 1d hydraulic model during the flood in 2006
The first time we used the hydrodynamic model in practice was during the flood in spring 2006. The model was calibrated to the year 2000. We uploaded this version with the data of the year 2006. In order to simplify the calculation we run the model on the Kisköre-Titel reach of the Tisza. We integrated three tributaries, the Zagyva, the Körös (4 branches) and the Maros. The boundary condition in the upper cross-sections were function Q=f(t), in the lower cross-section at Titel were Z=f(t). The boundary conditions of the model were extended by a 6-day discharge forecast. In case of Titel we downloaded a 4-day forecast from the Serbian website. In order to give a peak-forecast on the Tisza, we extended the 6-day forecast to 12 days. The results are demonstrated on Figure 9.
5. Summary
The HEC-RAS model – following its merging with the hydrographical information system and with the forecasting model of water levels and water outputs – may serve as a base of high water management system of the River Tisza. Current calibration of the model will change; in case of actual use of reservoirs their effect on water level reduction will not be equal with the results of current simulations. The parameters of the model have to be upgraded according to the consequences of technical interventions accomplished in the meantime, as well as with the results of the new geometrical surveying. For the sake of the cause, the model and the related database require a continuous maintenance.
REFERENCES
1. Kovács, S. (2003), Improvement of the flow carrying capacity of the flood-channel,
Dutch-Hungarian workshop, Szolnok, Hungary October 2003.
2. Kovács, S. (2004), Experiences in Application of HEC-RAS Model under Circumstaces
of Flood Waves, NATO Advanced Research Workshop, Ostrov u Tise, Czech Republic October 2004,
3. Kovács, S. (2005), Modelling the River Tisza by using one-dimension hydro-dynamic
model, Third International Symposium on Flood Defence, Nijmengen, The Netherlands, May 2005,
4. Kovács, S., Ivaskó, L., Tóth, I. (2006), Das Hochwasserschutzkonzept an der Mittleren
Theis, WasserWirtschaft, Organ der Deutschen Vereinigung 3/2006.
5. Kovács, S. Hegedüs, P. (2005), Using HEC-RAS for Complex Flood Control Project,