Influence of Shielding Gas Composition on the Properties of Flux-Cored
Arc Welds of Plain Carbon Steel
1
Mechanical Engineering Department, Faculty of Engineering at Shoubra, Benha University, Cairo, Egypt.
2
Central Metallurgical Research and Development Institute, Helwan, Cairo, Egypt.
Received 13 October 2011; received in revised form 20 November 2011; accepted 01 December 2011
Abstract
In this study, the influence of variation in the shielding gas composition on the weld properties of steel ST 37-3 was investigated. Six different shielding gas compositions in addition to pure argon (Ar) and pure CO2 were studied in
this work using flux cored arc welding (FCAW) process. For bead-on-plate (B.O.P) specimens pure Ar shielding gas has excellent arc stability; however, with increase of the CO2 percent in the shielding gas compositions, the arc
stability becomes noisy (unstable arc) especially for pure CO2. 75% Ar – 25% CO2 shielding gas composition has the
optimum deposition rate among other shielding gases for B.O.P. Furthermore, for complete real welded joints, the absorbed energy in the Charpy impact toughness test of weld metal (W.M) decreases with increase of the CO2 percent
in the shielding gas composition. Additionally, the hardness of W.M decreases with the increase of the CO2 percent in
the shielding gas composition.
Keywords: flux cored arc welding, shielding gas compositions, bead on plate, arc stability & efficiency, deposition rate
1.
Introduction
Gas metal arc welding (GMAW) process is an important welding process in industrial operation [1]. GMAW processes, with either solid or flux-cored wires, have become popular, because of its high quality welded joints that can be obtained at relatively low cost [2], and its considerable potential for automation [3].
The primary function of the shielding gas is to protect the molten metal from atmospheric gases as the weld pool is being formed. The gas also promotes a stable arc and uniform metal transfer. The quality, efficiency, and overall operating acceptance of the welding operation are strongly dependent on the shielding gas, since it dominates the mode of the metal transfer [3]. The shielding gas not only affects the properties of the weld but also determines its shape and penetration pattern. During welding, the shielding gas also interacts with the welding wire determining the strength, toughness and corrosion resistance of weld deposits. The shielding gas also affects the residual contents of hydrogen, nitrogen and oxygen dissolved in the weld metal [1]. The influence of shielding gas compositions on the apparent weld bead geometry has been previously studied [2].
Carbon steels are widely used in various industries, as they possess a combination of properties like high strength and
*Corresponding author. E-mail address: [email protected]
Tel.: +202 25010642, +2 0106 7273 680; Fax: +202 250 11185
ductility, good formability and versatile fabricability. Because so many varieties of carbon steels are available, a wide range of desirable properties are achievable and they can be used in many different applications, such as power generation, structural buildings, bridges, offshore oil rigs [4], and in many commercial products, such as automobiles. Nowadays, rationalization of welding processes increasingly demands GMAW and flux cored arc welding (FCAW) for carbon steel applications. Pure CO2
and Ar/CO2 compositions are mainly used as a shielding gas at present. The selection of shielding gas for carbon steel welds
depends on the influence of the shielding gas on the weldability, weld bead geometry, appearance, generation of porosity and also their related effects on the mechanical properties [5]. Previous studies were directed to examine the effect of shielding gases on weldment properties in case of solid wire GMAW process. This study aims to examine how different shielding gas compositions influence the metallurgical, mechanical and chemical properties of mild carbon steel welds using semi-automatic FCAW process.
2.
Experimental Work
The present work was carried out in two stages. In the first stage, bead-on-plate (B.O.P) welding technique on a plate of 10 mm in thickness with dimensions 100 mm (length) × 70 mm (width) was used to study the effects of shielding gas compositions on arc stability, penetration, deposition rate, microstructural characteristics and hardness distribution of deposited weld metal (W.M). The optimum welding conditions were selected and complete weld joints were accomplished for the second stage using two plates of 10 mm in thickness with dimensions 300 mm (length) × 150 mm (width) each plate is mechanically beveled to an angle of 30° to form a single V butt groove joint with 1 – 3 mm root gap opening and no root face to study the effect of shielding gas compositions on both mechanical and metallurgical properties of the weldments.
The base metal used in this investigation is mild carbon steel (Steel 37-3) grade type steel EN-ISO S235J2G3. The filler wire used in this investigation is flux cored wire E71T-1 according to AWS A5.20/ASME - SFA 5.20 (Rutile electrode) [6] with 1.2 mm nominal diameter. The chemical composition of both base metal and deposited weld metal is shown in Table 1.
Table 1 Chemical composition of base metal weight (%)
C Mn Si S P Cr Ni Mo V Al Cu
0.17 0.51 0.02 0.007 0.012 0.035 0.032 0.0002 0.005 0.064 0.079 Chemical composition requirements for weld metal weight (%) [6]
C Mn Si S P Cr Ni Mo V Al Cu
0.18 1.75 0.9 0.03 0.03 0.2 0.5 0.3 0.08 …. 0.35
Six different shielding gas compositions in addition to pure argon (Ar) and carbon dioxide (CO2) were used throughout
this study. They meet the requirements of ASME SFA 5.32 [7] and have the following compositions: (1) Pure Argon, (2) 95 % Ar – 5 % CO2, (3) 90 % Ar – 10 % CO2, (4) 82 % Ar – 18 % CO2, (5) 80 % Ar – 20 % CO2, (6) 75 % Ar – 25 % CO2, (7) 50 %
Ar – 50 % CO2, and (8) Pure CO2.
data monitoring device. The arc current and arc voltage were monitored and thus the actual HI was calculated. Based on that, the effect of shielding gas compositions on the arc efficiency was calculated based on the actual measured HI and the theoretical HI (where the readings were taken from the welding machine display).
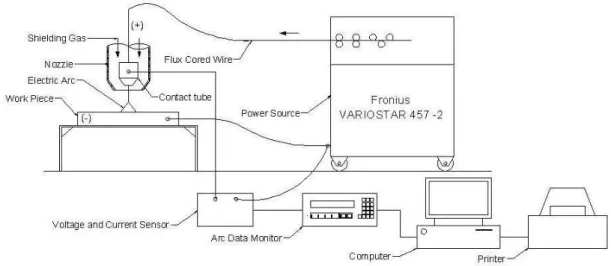
Fig. 1 Schematic diagram of experimental work setup
The welding parameters used in case of B.O.P are constant as shown in Table 2, except in case of pure Ar which was used as a reference for metallurgical comparison. This exception in case of pure Ar is related to the high ionization potential of Ar gas which in turn reflected on arc stability. Thus, it is practically recommended to use high welding current (i.e. wire feed speed) and high welding voltage when using pure Ar shielding gas.
Table 2 Welding conditions for B.O.P test pieces used for FCAW process
Welding Variable Actual Used
Welding process FCAW
Type of filler metal AWS A5.20/ASME - SFA 5.20 - E71T-1
Wire diameter 1.2 mm
Type of shielding gas composition As mentioned previously Flow rate of shielding gas 12 – 15 L/min
Polarity DCEP
Welding voltage (V) 27.5 V
Welding current (I) 126 ± 7 A
Travel speed (S) 8 cm/min
Wire feed speed (WFS) 4.2 (-30%) m/min
Contact tube to work distance (CTWD) 20 – 22 mm
Weld bead technique Stringer
To study the effect of shielding gas compositions on the deposition rate, each test piece was weighed before and after welding to estimate the weight of the deposited weld metal through the weight gain differences between before and after weld bead deposition. In case of complete welded joints, all test pieces after welding were examined for soundness by visual inspection, dye penetrant and ultrasonic testing.
Transverse tensile and impact tests were carried out with the weld center line perpendicular to specimen longitudinal axis. Tensile specimen dimensions were according to ASME (IX) [8], while impact specimen dimensions were 10 × 7 × 55 mm according to ASME (II) [9, 10], due to material limitations; it was not possible to use a standard size Charpy impact specimen; so, we referred to ASME (II) to test a sub-size specimen. To accommodate the smaller Charpy impact specimen, we used different specimen supports. Vickers hardness tests were also carried out using a load of 10 Kgf.
metal and heat affected zone. Examination of the fracture surfaces of impact specimens was carried out using a Scanning Electron Microscope (SEM). Image analysis was carried out using JMicroVision software version 127 to estimate the area percent of the different phases of different microstructures of both cases of B.O.P and complete joined weldments.
3.
Results and Discussions
3.1. Part I: Bead on Plate (B.O.P) Welds
3.1.1. Effect of the different shielding gas compositions on arc stability
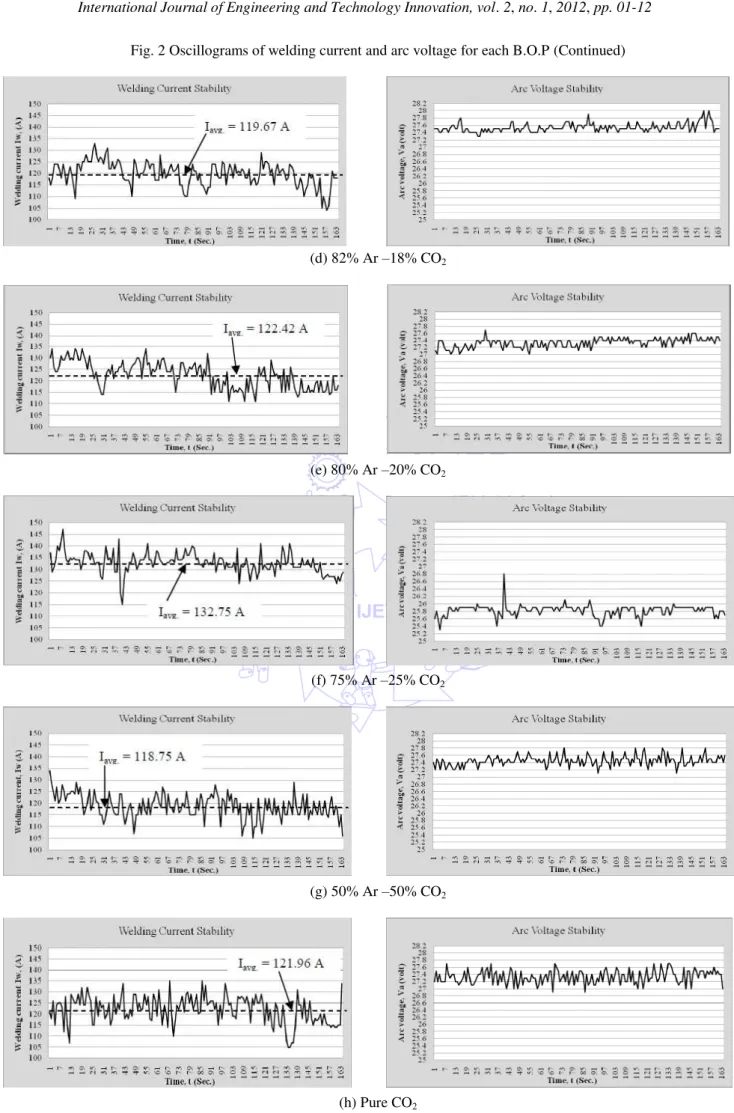
In the case of pure Ar shielding gas, good arc voltage stability was observed. It could be due to the higher ionization potential energy (15.8 ev) of pure Ar shielding gas as compared to other shielding gases compositions (e.g. 11.8 ev for pure CO2). However, the welding current reflected variable current characteristics which related to the droplet spray transfer mode.
On the other hand, both arc voltage and welding current variations were observed, in the case of pure CO2 shielding gas. These
variations could be related to the repulsed globular transfer mode of CO2 welding arc. Based on the previous mentioned
characteristics in case of pure shielding gases, all shielding gas compositions showed relatively small variations in arc voltage values, except in the case of 75 % Ar – 25 % CO2 shielding gas which showed a lower mean value of arc voltage with a slightly
higher variation, as shown in Fig.2.
(a) Pure Ar
(b) 95% Ar –5% CO2
Fig. 2 Oscillograms of welding current and arc voltage for each B.O.P (Continued)
(d) 82% Ar –18% CO2
(e) 80% Ar –20% CO2
(f) 75% Ar –25% CO2
(g) 50% Ar –50% CO2
(h) Pure CO2
This may affect the amount of generated HI. Welding current measurements reflect the effect of shielding gas compositions on the droplet transfer mode. In other words, with increasing the content of CO2 the droplet transfer mode changed
from spray transfer mode (small variations in welding current values) to large size droplet transfer mode (not globular) associated with large variation in welding current values. The arc efficiency for each B.O.P test piece is shown in Table 3.
Table 3 Arc efficiency for each B.O.P test piece Shielding gas
compositions
Theoretical HI(1), (KJ/mm) (i.e. readings were taken from the
welding machine display)
Actual HI(1), (KJ/mm) (i.e. readings were taken from the
arc data monitor device) Arc efficiency (2)(η), (%)
Pure argon 4.95 4.60 93.0
95% Ar – 5% CO2 2.89 2.58 89.2
90% Ar – 10% CO2 2.78 2.63 94.6
82% Ar – 18% CO2 2.73 2.47 90.4
80% Ar – 20% CO2 2.74 2.51 91.5
75% Ar – 25% CO2 2.76 2.57 93.1
50% Ar – 50% CO2 2.67 2.44 91.5
Pure CO2 2.74 2.50 91.2
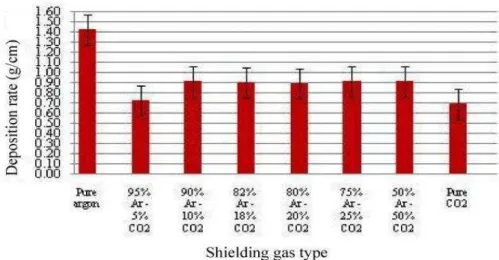
3.1.2. Effect of the different shielding gas compositions on deposition rate
Fig. 3 Deposition rate as a function of shielding gas composition
As shown in Fig.3, with increasing the content of CO2 in the shielding gas compositions from 5% up to 10%, deposition
rate (i.e. weld mass deposited per unit length of weld [g/cm]) increases. It then remains almost constant; however, pure CO2
shielding gas exhibits lower deposition rate. Pure argon shielding gas exhibits relatively high deposition rate. Based on the forces acting on the droplet, the radial electromagnetic force has a great effect on promoting the droplet detachment through necking the liquid metal and squeezing it from the electrode tip (pinch effect), resulting in spray transfer mode with smooth and uniform weld bead. Other forces such as surface tension force, gravity force, aerodynamic force, and vapor jet reaction force have limited effects. However, the deposition rate depends on the applied welding current. The higher is the current, the greater are these forces, which increase deposition rate. With introduction of CO2 gas in gas compositions, the surface tension force will
increase gradually. This force tends to maintain the liquid metal droplet in a form with minimal surface area (normally in a ball-shaped form). In this case with increasing the amount of CO2 in the shielding gas composition, the surface tension force
increases with maintaining radial electromagnetic force to some limit to form droplet transfer mode with larger sizes. This results in increasing deposition rate as CO2 content is increased from 5% to 10%. In case of pure CO2 the surface tension force
electrode tip, and as a result a lower deposition rate is observed. As the CO2 percent in the shielding gas increases; the resulting
droplet size increases gradually to a globular metal transfer mode in case of pure CO2 shielding gas which has an asverse effect
on the arc stability. However, in case of pure Ar the resulted metal transfer mode was spray mode as a result of electromagnetic force effect as based on the high heat input due to the higher ionization potential of pure Ar that finally showed high arc stability. The main features of spray transfer mode are high stability of the arc, absence of spatter and good weldability of the weld edges. However, during welding by pure CO2, there were two main dominant forces, vapor jet reaction force and surface tension force,
on the droplet that can lead to form globular repulsed mode. Globular transfer mode may produce spattering that comes from both metal transfer and the weld pool that becomes more aggravated when using pure CO2 shielding gas. Accordingly, the
percentage of CO2 must not be higher 20% because shielding gas compositions with CO2 percentage above 30% do not usually
produce spray transfer mode but produce globular transfer mode and hence lead to form spattering during welding [11].
3.1.3. Effect of the different shielding gas compositions on weld metal microstructure
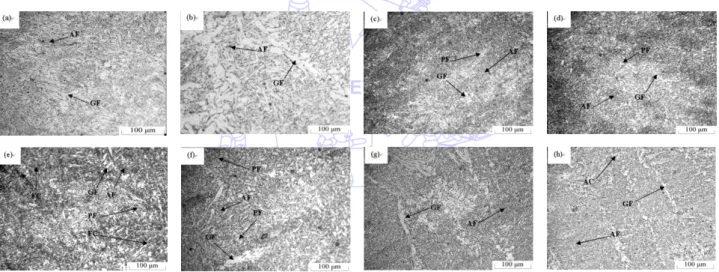
The microstructures of investigated samples as a function of the shielding gas compositions are shown in the Fig.4, also the area percents of the various microstructure phases are shown in Table 4. The W.M microstructure in case of pure Ar shielding gas is a solidified columnar structure associated with fine grains of GF and AF, as shown in Fig. 4 (a). The W.M microstructure in case of pure CO2 shielding gas is also a columnar structure consisting of GF and AF, as shown in Fig. 4 (b),
with larger grain sizes than that observed for pure Ar shielding gas. Thus, this change in microstructure could be related to the effect of arc stirring force [11], which is much higher in the case of pure Ar shielding gas as compared to the case of pure CO2.
Fig. 4 Microstructure of W.M of B.O.P specimens. (a) Pure Ar, (b) Pure CO2., (c) 95% Ar – 5% CO2 , (d) 90% Ar – 10% CO2,
(e) 82% Ar – 18 CO2, (f) 80% Ar – 20% CO2, (g) 75% Ar – 25% CO2, and (h) 50% Ar – 50% CO2. Where AF: Acicular
ferrite, GF: Grain boundary ferrite, PF: Polygonal ferrite, FC: Ferrite carbide and AC: Aligned carbide
In the cases of 95% Ar – 5% CO2 and 90% Ar – 10% CO2 shielding gases, the microstructure reveals the formation of fine dendrites associated with fine equi-axed grains and it consists of GF and PF (Polygonal ferrite) which nucleated at austenite grain boundaries in high heat input welds, as shown in Fig. 4 (c) and (d).With increasing the CO2 content in the shielding gas, at
same welding parameters, the arc heat input decreases which is associated with the formation of FC aggregates, as in the case of 82% Ar – 18% CO2 and 80% Ar – 20% CO2 shielding gases. Also, GF, PF, and AF were observed, as shown in Fig. 4 (e) and (f).
It was observed that with increasing CO2 in the shielding gas compositions up to 25%, the area percent of both PF and FC
aggregates decreased accompanied with an increase in the area percent of GF, and a decrease in the area percent of AF. With 50% CO2 in the shielding gas, ferrite with aligned carbides at the lath boundaries were observed, as shown in Fig. 4 (g) and (h)
Table 4 Microstructure phases of shielding gases used for B.O.P specimens Shielding gas composition Microstructure phases percent
AF (%) GF (%) PF and FC (%)
Pure Ar 48.54 49.75 Not measured
95% Ar – 5% CO2 Not measured
90% Ar – 10% CO2 Not measured
82% Ar – 18% CO2
44.15 55.03 4.63
80% Ar – 20% CO2
75% Ar – 25% CO2 40.30 57.10 2.10
50% Ar – 50% CO2 Not measured
Pure CO2 36.30 59.20 Not measured
3.1.4. Effect of the different shielding gas compositions on hardness distribution
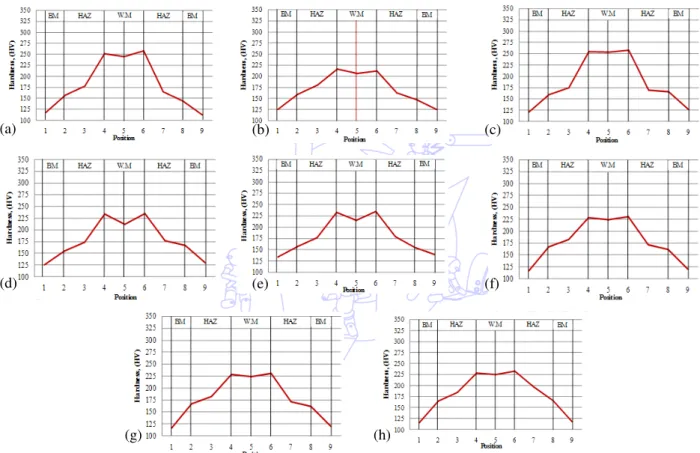
The hardness distributions in W.M, HAZ, and base metal are shown in Fig.5. Weld metal hardness decreases with increasing CO2 content in the shielding gas, this may be related to the losses in some alloying elements such as Mn and Si during
arc welding, as shown in Table 5, resulting in the decrease of the AF content, as indicated from the investigated microstructure.
Fig. 5 Hardness results of B.O.P test pieces. (a) Pure Ar, (b) Pure CO2, (c) 95% Ar – 5% CO2 , (d) 90% Ar – 10% CO2, (e) 82%
Ar – 18 CO2, (f) 80% Ar – 20% CO2, (g) 75% Ar – 25% CO2, and (h) 50% Ar – 50% CO2
Table 5 Chemical analysis of deposited weld metal
Type FCW Pure Ar 82% Ar -
18% CO2
75% Ar - 25% CO2
50% Ar - 50% CO2
Pure CO2
Hardness (HV) 251 234 227 229 211
Constituent Chemical Composition (Wt. %)
C 0.18 0.06 0.06 0.06 0.05 0.06
Mn 1.75 1.60 1.58 1.44 1.47 1.25
Si 0.90 0.61 0.54 0.45 0.50 0.40
(b) (c)
(d) )
(e) (f)
(g) (h)
3.2. Part II: Complete Real Weld Joints
Four complete welds were carried out by using the selected four shielding gases; Pure Ar, pure CO2, 82% Ar – 18% CO2,
and 75% Ar – 25% CO2, by using approximately the same heat input and controlling the welding parameters.
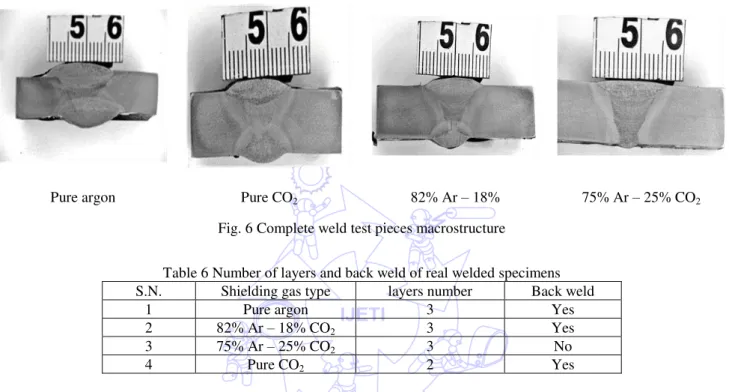
3.2.1. Effect of the different shielding gas compositions on macrostructure
The macrographs produced indicated good penetration and side wall fusion for all welds, as shown in Fig.6. Additionally, the number of layers deposited with respect to shielding gas is shown in Table 6. However, in case of 75% Ar – 25% CO2
shielding gas, there was no back weld required, as it exhibited higher penetration characteristics as well as high deposition rate as compared with other shielding gas compositions.
Pure argon Pure CO2 82% Ar – 18% 75% Ar – 25% CO2
Fig. 6 Complete weld test pieces macrostructure
Table 6 Number of layers and back weld of real welded specimens S.N. Shielding gas type layers number Back weld
1 Pure argon 3 Yes
2 82% Ar – 18% CO2 3 Yes
3 75% Ar – 25% CO2 3 No
4 Pure CO2 2 Yes
3.2.2. Effect of the different shielding gas compositions on weld metal microstructure
The microstructure of deposited weld metal is a typically columnar structure consists of AF and GF, which is common when welding this type of steel, as shown in Fig. 7, also the area percent of the various phases are shown in Table 7. In case of pure Ar shielding gas, the microstructure contains PF (1.96%) which may increase the hardness of deposited W.M. Also, the area percent of GF is lower than that of the AF indicating that the cooling rate is high in case of pure Ar shielding gas. This also could be indicated from the formation of FC aggregates (1.37%), as shown in Fig.7 (a). However, in case of 100% CO2, the area
percent of GF increases while that of AF decreases, which may lead to a decrease in the hardness of the W.M, as shown in Fig.7 (b).
Table 7 Microstructure phases of shielding gases used for complete welded joints Shielding gas composition Microstructure phases percent
AF (%) GF (%)
Pure Ar 68.63 28.04
82% Ar – 18% CO2 60.10 37.50
75% Ar – 25% CO2 56.81 40.30
Pure CO2 52.40 44.62
With mixing gases, the distribution of GF in case of 75% Ar – 25% CO2 shielding gas is much more homogeneous than
that of 82% Ar – 18% CO2, indicating a balanced cooling rate, and this may lead to an improvement in strength of this weldment
It was observed that the cooling rate of pure Ar shielding gas was faster than that of other shielding gas compositions; however, HI of pure Ar shielding gas was higher than that of other shielding gas compositions. The transformation products can change from predominately AF in case of pure Ar shielding gas to predominately GF and WF in case of pure CO2 shielding gas,
when the cooling rate slows down [11]. On the other hand, it can be observed that shielding gas compositions have a great effect on the cooling rate due to the ionization potential of each shielding gas that governs producing high or low HI.
Fig. 7 Microstructure of W.M of real welded specimens (a) Pure Ar, (b) Pure CO2(c) 82% Ar - 18% CO2, and (d) 75% Ar - 25%
CO2.
3.2.3. Effect of the different shielding gas compositions on transverse tensile testing
It appeared that the ultimate tensile strength (UTS) of welded joints of all welds in different shielding gas compositions exceeded the corresponding value for the investigated base metal; the fracture was in the base metal giving an average value for the UTS of 370 MPa.
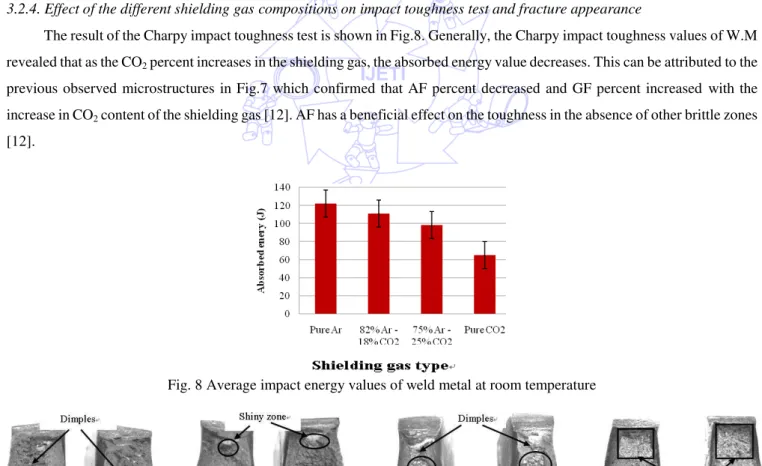
3.2.4. Effect of the different shielding gas compositions on impact toughness test and fracture appearance
The result of the Charpy impact toughness test is shown in Fig.8. Generally, the Charpy impact toughness values of W.M revealed that as the CO2 percent increases in the shielding gas, the absorbed energy value decreases. This can be attributed to the
previous observed microstructures in Fig.7 which confirmed that AF percent decreased and GF percent increased with the increase in CO2 content of the shielding gas [12]. AF has a beneficial effect on the toughness in the absence of other brittle zones
[12].
Fig. 8 Average impact energy values of weld metal at room temperature
Fig. 9 Fracture appearance figures (a) Pure Ar, (b) 82% Ar – 18% CO2, (c) 75% Ar – 25% CO2, and (d) Pure CO2
Shear fracture (%) = 100 Shear fracture (%) = 88 Shear fracture (%) = 79 Shear fracture (%) = 50
(a) (b
)
Furthermore, the surface fracture images of the broken test specimens, as shown in Fig.9, revealed and confirmed that the cleavage area (shiny zone) increased with the increase of the CO2 percent in the shielding gas. These calculations are according
to ASTM A 370 [10]. So that, it could be concluded that, as the CO2 percent increases in the shielding gas, the area of shear
fracture (dull zone) decreases and as a result the required absorbed energy decreases, as shown in Fig.8.
Scanning electron micrographs of fracture surfaces of Charpy impact toughness test specimens V-notched in the W.M and testing at room temperature is shown in Fig.10. It is clear that the fracture surface morphology for the weld using pure Ar shielding gas is dimple rupture that was recognized by numerous cuplike depressions which are the direct result of the microvoid coalescence, and this shows that the impact fracture surface of W.M exhibited exclusively ductile fracture, as shown in Fig.10 (a). On the other hand, as the CO2 percent in the used shielding gas increased, the resulting fracture surface revealed
shiny (cleavage) areas and these areas increase with the increase of the percent of CO2, as shown in Fig.10 (b) to (d). As
mentioned previously in section 3.2.2, as the CO2 percent in the shielding gas increases; the GF percent also increases.
Accordingly, cleavage cracks propagate more easily in the GF than in AF. This observation confirms that AF has a beneficial effect on toughness [12].
Fig. 10 Scanning electron microphotographs of the fracture surface
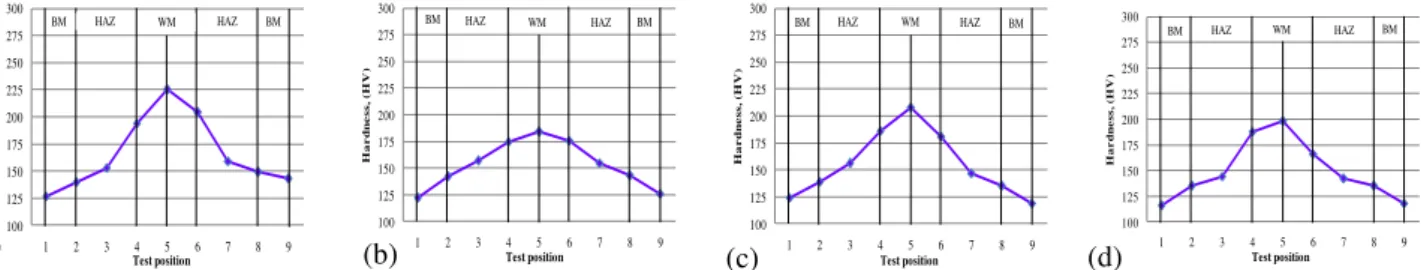
3.2.5. Effect of the different shielding gas compositions on hardness test
Fig. 11 Average hardness values of W.M for the real welded test specimens
100 125 150 175 200 225 250 275 300
1 2 3 4 5 6 7 8 9
H a r d n e s s , (H V ) Test position
BM HAZ WM HAZ BM
100 125 150 175 200 225 250 275 300
1 2 3 4 5 6 7 8 9
H a r d n e s s , (H V ) Test position
BM HAZ WM HAZ BM
100 125 150 175 200 225 250 275 300
1 2 3 4 5 6 7 8 9
H a r d n e s s , (H V ) Test position
BM HAZ WM HAZ BM
100 125 150 175 200 225 250 275 300
1 2 3 4 5 6 7 8 9
H a r d n e s s , (H V ) Test position
BM HAZ WM HAZ BM
Fig. 12 Hardness results of real welded test pieces. (a) Pure Ar, (b) Pure CO2, (c) 82% Ar – 18% CO2, (d) 75% Ar – 25% CO2
Hardness was measured at several points which represented its distribution along the different areas of weldment. Average values of the hardness test results for the sample areas are shown in Fig.11. Plots of test positions against hardness values (HV 10) are shown in Fig.12.Generally, the hardness of deposited W.M in case of pure Ar shielding gas showed the
(a) (b) (c) (d)
)
highest values, while the hardness in case of CO2 shielding gas showed the lowest values. The reheating of the lower pass by the upper passes may have participated in lowering hardness. Other mixing shielding gases resulted in intermediate values of hardness. This could be attributed to the microstructure of deposited W.M. Some alloying elements such as Mn and Si decreased as CO2 percent increased resulting in a decrease in hardness and strength of weld metal.
4.
Conclusions
(1) The shielding gas compositions have a significant effect on the arc stability and efficiency, deposition rate, microstructure, chemical and mechanical properties of mild carbon steel welds.
(2) Among the investigated shielding gas compositions in case of FCAW the shielding gas composition 75% Ar – 25% CO2 is
the best economic shielding gas composition, because of its high arc efficiency and deposition rate, thus itcan reduce the number of weld layers and also reduce the welding time (i.e. reduce the welding cost).
(3) The W.M microstructure in case of 75% Ar – 25% CO2 shielding gas is homogenous due to the balance of cooling rate and
the formation of a high amount of AF which leads to the improvement of strength and toughness. (4) Increasing the amount of CO2 in the shielding gas, decreases the hardness of W.M.
(5) As the CO2 percent in the shielding gas increases, the required absorbed energy (impact toughness) of W.M decreases due
to the decrease of the amount of AF.
5.
Acknowledgments
The authors gratefully acknowledge the support that had been received from Central Metallurgical Research and Development Institute (CMRDI), Egypt, for this study. We also thank the Faculty of Engineering at Shoubra – Benha University, Egypt for its support.
References
[1] E. Karadeniz, U. Ozsarac, and C. Yildiz, “The effect of process parameters in gas metal arc welding process,” Materials and Design, vol. 28, pp. 649–656, Sep. 2005.
[2] M. Ebrahimnia, M. Goodarzi, M. Nouri, and M. Sheikhi, “Study of the effect of shielding gas composition on the mechanical weld properties of steel St. 37-2 in gas metal arc welding,” Materials and Design, vol. 30, pp. 3891–3895, Mar. 2009.
[3] Gertsovich and N. Svanberg, “Analysis of MIG welding with aim on quality,” M.Sc. Thesis, Dept. Signal Processing, Blekinge Institute, Sweden, Jul. 2008.
[4] J. Lancaster, Handbook of Structural Welding, 1st ed. Cambridge, England: Abington, 1992.
[5] U. Mohamed, “Effect of welding parameters on the properties of austenitic stainless steel weldments,” M.Sc. Thesis, Dept.
MechanicalEng., Zagazig Univ., Zagazig, Egypt, 2009.
[6] “Specification for carbon steel electrodes for flux cored arc welding,” American Society for Mechanical Engineers
(ASME), 1998.
[7] “Specification for welding shielding gases,” American Society for Mechanical Engineers (ASME) 2007.
[8] “Boiler and pressure vessel code - qualification standard of welding and brazing procedures, welders, brazers, and welding
and brazing operators,” American Society for Mechanical Engineers (ASME), 2007.
[9] “Requirements for impact testing,” American Welding Society (AWS), 2004.
[10]“Standard test methods and definitions for mechanical testing of steel products,” American Society for Testing and
Materials (ASTM), 2007.
[11]S. Kou, Welding Metallurgy Handbook, 2nd ed. New York, USA: John Wiley and Sons, 2002.