ACPD
6, 13075–13110, 2006Characterization of MIPAS elevation
pointing
M. Kiefer et al.
Title Page
Abstract Introduction
Conclusions References
Tables Figures
◭ ◮
◭ ◮
Back Close
Full Screen / Esc
Printer-friendly Version
Interactive Discussion
EGU Atmos. Chem. Phys. Discuss., 6, 13075–13110, 2006
www.atmos-chem-phys-discuss.net/6/13075/2006/ © Author(s) 2006. This work is licensed
under a Creative Commons License.
Atmospheric Chemistry and Physics Discussions
Characterization of MIPAS elevation
pointing
M. Kiefer1, T. von Clarmann1, U. Grabowski1, M. De Laurentis2, R. Mantovani3, M. Milz1, and M. Ridolfi4
1
Forschungszentrum Karlsruhe, Institut f ¨ur Meteorologie und Klimaforschung, Karlsruhe, Germany
2
Operational MIPAS mission planner for ESA, Rhea System SA, Louvain-La-Neuve, Belgium
3
Responsible for operational MIPAS mission calibration for ESA from 2002 to 2005 – Vitrociset S.p.A., Rome, Italy
4
Dip.to di Chimica Fisica e Inorganica, Universit ´a di Bologna, Italy
Received: 24 October 2006 – Accepted: 7 December 2006 – Published: 13 December 2006
ACPD
6, 13075–13110, 2006Characterization of MIPAS elevation
pointing
M. Kiefer et al.
Title Page
Abstract Introduction
Conclusions References
Tables Figures
◭ ◮
◭ ◮
Back Close
Full Screen / Esc
Printer-friendly Version
Interactive Discussion
EGU Abstract
Sufficient knowledge of the pointing is essential for analyses of limb emission measure-ments. The scientific retrieval processor for MIPAS operated at IMK allows to retrieve pointing information in terms of tangent altitudes along with temperature. The retrieved tangent altitudes are independent of the engineering Line-Of-Sight (LOS) information 5
delivered with the ESA Level 1b product. The difference of pointing retrieved from the reprocessed high resolution MIPAS spectra and the engineering pointing information was examined with respect to spatial/temporal behaviour. Among others the following characteristics of MIPAS pointing could be identified: Generally the engineering tan-gent altitudes are too high by 0–1.8 km with conspicuous variations in this range over 10
time. Prior to December of 2003 there was a drift of about 50–100 m/h, which was due to a slow change in the satellite attitude. A correction of this attitude is done twice a day, which led to discontinuities in the order of up to 2 km in the tangent altitudes. There is a systematic difference in the mispointing between the poles which amounts to 1.5– 2 km, i.e. there is a conspicuous orbit-periodic feature. The analysis of the correlation 15
between the instrument’s viewing angle azimuth and differential mispointing supports the hypotheses that a major part of this latter phenomenon can be attributed to an un-corrected roll angle of the satellite/instrument system of approximately 54 mdeg. Com-plementary to this, ESA operational LOS calibration results were used to characterize MIPAS pointing. For this purpose MIPAS is used as a radiometer while the passage of 20
infrared bright stars through the instrument’s field of view is recorded. Deviation from expected time of passage gives information about mispointing. A pronounced seasonal variation of the LOS is seen before a correction of on-board software took place in De-cember of 2003. Further a pitch bias of 24 mdeg with respect to the platform attitude information is found.
ACPD
6, 13075–13110, 2006Characterization of MIPAS elevation
pointing
M. Kiefer et al.
Title Page
Abstract Introduction
Conclusions References
Tables Figures
◭ ◮
◭ ◮
Back Close
Full Screen / Esc
Printer-friendly Version
Interactive Discussion
EGU 1 Introduction
1.1 Motivation
Retrieval of atmospheric state variables from limb emission measurements such as MIPAS (Fischer and Oelhaf,1996) requires the inverse solution of the radiative transfer equation for the given observation geometry. Obviously, any error in the assumptions 5
on the observation geometry, in particular the tangent altitudes, map directly onto the retrieved state variables. In order not to have to rely completely on Envisat space craft position and attitude and MIPAS scan mirror position information, methods have been developed to retrieve tangent altitude information directly from the spectra, either in terms of tangent point pressure (Ridolfi et al.,2000), or in terms of geometrical tangent 10
altitudes (von Clarmann et al., 2003). While the characterization of the observation geometry by adjusting tangent altitude pressures sufficiently avoids the propagation of tangent altitude errors to retrieved state variables, the retrieval of the tangent al-titudes supports more convenient direct comparison to the tangent alal-titudes inferred from spacecraft position and attitude and scan mirror position information. Any inde-15
pendent characterization of the orbit and attitude parameters is not only relevant to the MIPAS instrument but also to the other limb-viewing instruments onboard Envisat, GO-MOS (Kyr ¨ol ¨a et al.,2004;Bertaux et al.,2004) and SCIAMACHY (Bovensmann et al.,
1999).
1.2 MIPAS setup 20
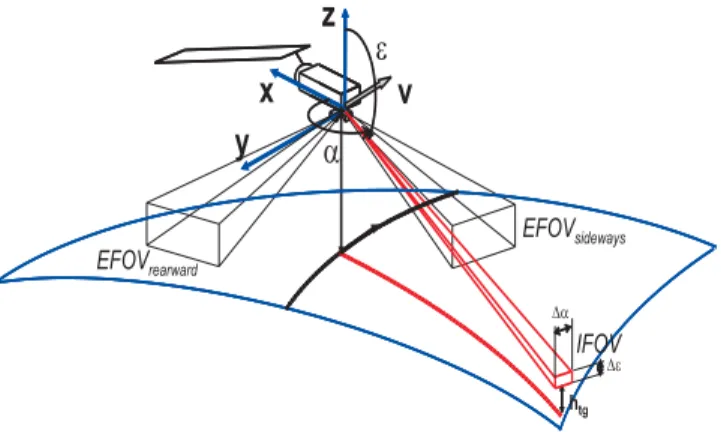
MIPAS has been designed to operate in either of two pointing regimes: rearward in the Envisat anti-flight direction and sideways in the anti-sun side of the satellite, as illustrated in Fig. 1. The azimuth and elevation angles, α and ǫ respectively, (see Fig.1) of the Instantaneous Field-Of-View (IFOV) can move within a maximum allowed range called Extended Field-Of-View (EFOV) defined as follows: the azimuth angle 25
ACPD
6, 13075–13110, 2006Characterization of MIPAS elevation
pointing
M. Kiefer et al.
Title Page
Abstract Introduction
Conclusions References
Tables Figures
◭ ◮
◭ ◮
Back Close
Full Screen / Esc
Printer-friendly Version
Interactive Discussion
EGU in the sideways direction, the elevation angle can vary from 113.06◦to 117.50◦in both
directions.
Due to this setup, MIPAS pointing is particularly sensitive to the orientation of the satellite x- and y-axes (as illustrated in Fig. 1). The instrument, therefore, can be exploited to determine accurate estimates of pitch and roll angles respectively. This 5
can be done in different ways. In this paper we shall present results from two methods. First there is the operational Line-Of-Sight (LOS) calibration by dedicated mesurements as performed by ESA. This method and the corresponding results will be described in detail in Sect. 4. Secondly there is the approach to infer the tangent altitude from a combined temperature/LOS retrieval.
10
1.3 Retrieval method
MIPAS tangent altitude pointing information is retrieved along with the actual temper-ature profile from CO2 spectral lines. CO2 is an appropriate tracer for the air mass
along the line of sight, since its mixing ratio is sufficiently constant with altitude, and its infrared emissions are, contrary to those of O2 or N2, whose altitude distributions are
15
even better predictable, strong enough for an accurate retrieval. The selection of CO2
transitions, regularization, and numerical representation of retrieved quantities are dis-cussed in detail invon Clarmann et al.(2003), along with a detailed error budget. In table 4 of the latter paper there are presented estimates of the total error of retrieved tangent altitudes: 260 m below 15 km altitude, less than 200 m from 15 km to 21 km, 20
150 m or less from 21 km to 27 km, and then less than 200 m up to 68 km.
1.4 Scope of this work
In Sects. 2–3 we take the engineering tangent altitudes as delivered with the ESA data products as a reference to define mispointing. In Sect. 4 the absolute pointing knowledge is addressed. The engineering tangent altitudes, at the time of the data 25
ACPD
6, 13075–13110, 2006Characterization of MIPAS elevation
pointing
M. Kiefer et al.
Title Page
Abstract Introduction
Conclusions References
Tables Figures
◭ ◮
◭ ◮
Back Close
Full Screen / Esc
Printer-friendly Version
Interactive Discussion
EGU partly measured and partly modelled: satellite position and attitude, scan mirror
atti-tude, Earth shape, and atmospheric refraction. It is delivered together with the Level 1b (L1b) and Level 2 (L2) products. L2 products additionally come with a corrected altitude. This is calculated by buiding up an hydrostatic atmosphere from the retrieved pressure and temperature values, anchored at the lowest engineering tangent altitude 5
(Ridolfi et al.,2000). Clearly the quality of this corrected altitude critically depends on the accuracy of the engineering tangent altitude of the lowest tangent point.
The majority of MIPAS data was taken in a measurement mode such that the line of sight (LOS) is essentially backwards with respect to the satellite flight direction (see Fig. 1). In this paper we solely consider data of this backward looking mode. To 10
implement a Sun-synchronous orbit the orbital plane is inclined such that the North Pole is on the right side of the flight path (with respect to flight direction), while the South Pole is on its left side. The LOS azimuthαis changed over the orbit from exactly backwards (=90◦) to enhance the coverage of regions beyond the latitude turning points of the orbit. There it is driven up to 110◦ in the vicinity of the North Pole while near the 15
South Pole it reaches down to 75◦. Between these two extremes there are several discontinuous changes with small steps near the poles and increasingly bigger steps from middle to equatorial latitudes.
In Sects.2–3we consider reprocessed data from mid 2002 to 26 March 2004. This is the time range between the first orbit series which covers entire days and the failure 20
of MIPAS’s scan mirror mechanism on 26 March 2004. This time period includes 12 December 2003, which corresponds to orbit 9321, the date of the update of the PSO (French acronym for on-orbit position) software. The update was necessary because there was an error in the PSO software leading to a periodic change of the satellite attitude with a period of one year.
ACPD
6, 13075–13110, 2006Characterization of MIPAS elevation
pointing
M. Kiefer et al.
Title Page
Abstract Introduction
Conclusions References
Tables Figures
◭ ◮
◭ ◮
Back Close
Full Screen / Esc
Printer-friendly Version
Interactive Discussion
EGU 2 Altitude dependence
We take as reference the engineering tangent altitude (ETA)hETA,i, i=1. . .17 as de-livered with the L1b product of ESA. The altitude grid is roughly defined ashETA,i = 6(3)42(5)52(8)68 km, but the lowest tangent altitude, as well as the spacing, is slightlty modified over the orbit. The altitudes sethIMK,i, i=nlow. . .17 given by the IMK LOS
5
retrieval results may not always have nlow=1, i.e. 17 values because spectra of low
heights with features caused by cloud emission, are removed prior to retrieval. There-fore we will not be able to assess hETA,i for all altitudes always. At the ith tangent altitude we examine the difference∆hi=hIMK,i−hETA,i. A value of∆hi greater than zero means that the retrieved tangent altitude is larger than the ETA, i.e. the ETA value deliv-10
ered with the ESA data product gives too low an altitude. In other words∆hi>0 means that MIPAS was looking higher than indicated by the ETA.
Figure2gives an overview over typical features of the height dependence of∆hi for a collection of several orbits, where each collection represents approximately one day (which is given in the headline of the panels). Only 13–14 values of ∆hi are shown 15
in the respective panels, with lowest tangent altitudes in the range 16–18 km. This is because for the data presented only altitude levels wherehIMK,i exists for at least 80% of each geolocation have been considered. Usually in the tropics there are cloud tops as heigh as 15 km. Tangent altitudes below these heights did not enter the LOS retrieval at IMK. So if there are more than 20% of geolocations contaminated with 20
clouds, there will be no differences shown at all for the respective altitudes. The reason for this rather strict criterion is that, as we shall see in the subsequent sections of this paper, there are features like drifts in time and a dependence of the altitude differences from latitude, which might induce a bias due to sampling effects (clouds are not evenly distributed along orbit).
25
ACPD
6, 13075–13110, 2006Characterization of MIPAS elevation
pointing
M. Kiefer et al.
Title Page
Abstract Introduction
Conclusions References
Tables Figures
◭ ◮
◭ ◮
Back Close
Full Screen / Esc
Printer-friendly Version
Interactive Discussion
EGU when the curves change shape is around June of 2003. Before this date they have
a slightly wavy appearence with local maxima typically at 27 and 38 km. Afterwards the upper local maximum at 38 km remains while the lower is shifted downwards to approximately 23 km. Though the main difference is that between the local minimum at 33 km and the maximum at 23 km there is an increase in∆hi of around 300 m for the 5
curves of second type while in those of first type it is below 200 m. Since no changes in the IMK retrieval scheme or set-up have been made, the change of the course of ∆hi with height must be attributed to changes of the engineering tangent altitude’s characteristics.
Figure3shows, plotted over orbit number, rms-values of∆hi-profiles, calculated for 10
all geolocations of the respective orbits. Rms-values are about 200 m or less for orbit numbers from 3500 to 7300, with lowest values at around orbit 6000 (which corre-sponds to late April of 2003). Orbits greater than 7300 (late July of 2003) exhibit rms of around 200 m or more.
The course of ∆hi with height seems to be quite systematic and hence well char-15
acterized by the corresponding rms value. In the remainder of this paper we therefore use the average value at a geolocation
∆h= 1
Ntang 17
X
i=nlow
∆hi. (1)
∆his considered to represent the average difference between the retrieved LOS tan-gent altitude and the engineering tantan-gent altitude per geolocation to an accuracy given 20
by the rms-value. Again∆h>0 for a geolocation means that on average MIPAS was looking higher than indicated by the engineering tangent altitudes.
3 Time dependence
ACPD
6, 13075–13110, 2006Characterization of MIPAS elevation
pointing
M. Kiefer et al.
Title Page
Abstract Introduction
Conclusions References
Tables Figures
◭ ◮
◭ ◮
Back Close
Full Screen / Esc
Printer-friendly Version
Interactive Discussion
EGU three panels of the figure. The cause of the jump is an update procedure for the
on-board parameters of the platform’s attitude, which is done twice a day at approximately 02:00 UTC and 14:00 UTC. In the vast majority of the data examined only the update procedure at 14:00 UTC shows an effect on ∆h. The update at 02:00 UT is mostly perceptible as a slightly enanced amplitude of the corresponding orbit variation. The 5
size of the jump at 14 UTC of approximately 1–1.5 km, and the fact that the jump at 02:00 UTC is virtually absent, leads to a rough estimate for the trend of∆hover a day of 42–63 m/h or 70–107 m/orbit. In December 2003 there was a major update of the PSO which largely reduced the jump amplitude. The impact of the gain achieved is illustrated in the lowermost panel of Fig.4.
10
There is a pronounced oscillation of∆hwith a period which corresponds to one orbit, and an amplitude of approximately 1 km. This oscillation persists throughout the whole time span covered by the reprocessed MIPAS off-line data.
3.1 One orbit
In Fig.5there is shown∆hover one orbit. Clearly the extrema of the periodic variation 15
are located at the poles. The course of ∆h with latitude (lower panel of figure) can roughly be approximated by a line. Therefore a corresponding line fit was performed for all orbits considered henceforth. This fitted line is determined by an offset, i.e. the value at the equator, and a gradient, which is the slope of the line. These two quanitities related to one orbit, offset and gradient, will be examined further.
20
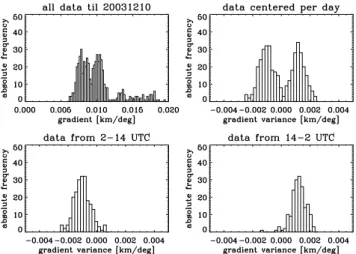
Figure 6 shows histograms of offset values where only data before the major soft-ware update in December 2003 have been considered. In what follows two values characterizing the center of the histograms, namely arithmetic mean and median, will be given in the form mean/median. In the top left panel of Fig. 6 a histogram of all data is shown. The distribution is quite broad with its center at approximately –0.97/– 25
av-ACPD
6, 13075–13110, 2006Characterization of MIPAS elevation
pointing
M. Kiefer et al.
Title Page
Abstract Introduction
Conclusions References
Tables Figures
◭ ◮
◭ ◮
Back Close
Full Screen / Esc
Printer-friendly Version
Interactive Discussion
EGU erage value of the offset was subtracted from all single offset values of that day. Hence
this procedure gives the variation of the offset around the daily mean value. In the top right panel the corresponding histogram is depicted, the centering on a daily basis of course shifts the distributions such that it is centered around zero. Clearly a double peaked distribution can be seen with the peaks approximately 350 m apart. If there 5
was only a linear drift, as assumed in the preceding paragraph, one would expect a distribution with a rather flat top. The two lower panels separate the contributors of the two respective peaks. Data from 02:00–14:00 UTC (lower left panel) has a distribution which is centered at 0.17/0.16 km, while the distribution of data from 14:00–02:00 UTC is centered at –0.20/–0.18 km.
10
For the sake of completeness we give the corresponding results for data after the 12th of December 2003 (no corresponding plot shown): All data are centered at – 0.55/–0.56 km, which is a little more than half of the average offset before that date. The data centered per day with removed data points in a 1.5 h time window around 02:00 UTC and 14:00 UTC are still distributed in a double peaked histogram that can 15
be separated into two single peaked ones. Data from 02:00–14:00 UTC is centered at –0.03/–0.04 km, and data from 14:00–02:00 UTC at 0.04/0.05 km. Hence the peak separation is about a quarter of what it was before the 12 December. Obviously the software update largely improved the pointing of MIPAS with respect to the average offset.
20
As shown in Fig.7the gradient features a behaviour similar to the offset’s. The dou-ble peaked structure can already be seen in the top left panel, which depicts the his-togram of all gradient values of data before the major PSO software update. Arithmetic mean and median of this data set are 0.010/0.009 km/◦. After data from a 1.5 h time window around 02:00 UTC and 14:00 UTC have been removed, and the procedure 25
ACPD
6, 13075–13110, 2006Characterization of MIPAS elevation
pointing
M. Kiefer et al.
Title Page
Abstract Introduction
Conclusions References
Tables Figures
◭ ◮
◭ ◮
Back Close
Full Screen / Esc
Printer-friendly Version
Interactive Discussion
EGU is located at 0.0012/0.0012 km/◦. Again an improvement of the data taken after the 12
December 2003 (not shown as plot) can be observed, however it is much smaller than the offset’s: All data is centered at 0.0096/0.0097 km/◦, data from 02:00–14:00 UTC at –0.0007/–0.0006 km/◦, and the 14:00–02:00 UTC data at 0.0009/0.0009 km/◦.
3.2 Sucessive orbits 5
In Fig.8values of ∆hfor several subsequent orbits are shown, separated for ascend-ing and descendascend-ing parts of the respective orbits. Apart from offset, gradient, drift, and the dependence of the time slots 02:00–14:00 UTC and 14:00–02:00 UTC already discussed, there are two additional features standing out clearly. First a difference between the course of∆h between ascending and descending parts of orbits is dis-10
cernible. ∆h of descending orbit parts quite well follows a straight line, while in de-scending parts it exhibits a wavy appearence. This difference between ascending and descending parts of the orbits is a common feature of all data, while the specific form of the deviation from a straight line of the descending parts is not. The reason for the phenomenon is not clear yet and still under investigation.
15
Secondly there is an obvious persistence of fine structure in each case in curves of ascending and descending orbit parts. For the orbits shown in Fig. 8, in ∆h of ascending orbit parts (upper panel), there is e.g. a marked W-shaped feature between latitudes−50◦ and−25◦, a small positive peak at about 0◦, and a small negative peak
at about 30◦. In descending orbits similar features as e.g. positive peaks at
−30◦ and
20
−5◦and a negative bump around−40◦can be seen. This persistence of fine structure
in∆hfor subsequent orbits, bound to certain latitudes, again is a characteristic feature of the whole data set.
3.3 Correlation of LOS azimuth and∆h
In the following we propose a possible reason for the persistent fine structure and 25
satel-ACPD
6, 13075–13110, 2006Characterization of MIPAS elevation
pointing
M. Kiefer et al.
Title Page
Abstract Introduction
Conclusions References
Tables Figures
◭ ◮
◭ ◮
Back Close
Full Screen / Esc
Printer-friendly Version
Interactive Discussion
EGU lite/instrument, which is not accounted for in the data processing. As already described
in Sect.1the LOS azimuthαof MIPAS is changed periodically over the orbit to enhance the coverage of high latitudes. The adjustment ofαis not done in a continuous way but rather in steps. From geometric considerations it follows that a roll angle of the system, which is not accounted for, will firstly map the orbit periodic adjustment ofα into an 5
orbit periodic variation of∆hand secondly map the azimuth steps into corresponding discontinuities in∆h. It has to be noted though, that a change of satellite pitch angle which had an appropriate orbit periodic part would create a very similar behaviour in ∆hover latitude. Indeed there is an orbit periodic change in the pitch, but its magnitude is much smaller than the effect shown in Fig.8. This will be discussed in more detail in 10
Sect.5.
Figure 9 gives an overview of the quantities involved. The left column of panels shows∆h(top) and LOSα (center) against time, and a scatter plot of both quantities (bottom). In the right column quantities derived from∆hand αare depicted. ∆(∆h) is the difference of∆hof subsequent measurement geolocations/times. ∆α is defined in 15
the same manner as the difference of the LOS azimuth of subsequent times. ∆(∆h) (top) and∆α (center) over time are shown while the bottom panel again contains the corresponding scatter plot.
∆h plotted against time shows the orbit periodic feature as already discussed in Sect. 3.1. The LOS azimuth α also shows a course periodic in time, with a period 20
of one orbit. Maxima of α of approximately 110◦ correspond to maxima in∆h, i.e. to measurements near the North Pole, while minima of α of around 75◦ belong to the southern polar region. ∆h and α seem to be linearly correlated. ∆(∆h) still exhibits some periodic feature but a strong noise component is visible. The course of∆α over time shows, that the higher the corresponding latitudes are the smaller the changes in 25
the commanded azimuthαbecome. Around the Equator, which means aroundα≈90◦,
the changes are greatest. There seems to be a good linear correlation between∆α
and∆(∆h), too.
geom-ACPD
6, 13075–13110, 2006Characterization of MIPAS elevation
pointing
M. Kiefer et al.
Title Page
Abstract Introduction
Conclusions References
Tables Figures
◭ ◮
◭ ◮
Back Close
Full Screen / Esc
Printer-friendly Version
Interactive Discussion
EGU etry to be
ρ=δh,α 1 lLOSsin2ǫ
, (2)
whereδh,α means either d∆h/dα or d∆(∆h)/d∆α,ǫis the LOS elevation angle, and
lLOSmeans the distance between instrument and tangent point.
The two lowermost plots of Fig.11give values ofδh,α of 0.045 km/◦. Withǫ≈116.5◦ 5
andlLOS ≈3200 km the roll angle for orbits 2886–2887 can be estimated to
approxi-mately 0.057◦. From the facts that near the North Pole∆his greater than average and that there the azimuth is adjusted to have the LOS more towards the pole, we can infer that the rotation of the instrument/satellite system is counterclockwise with respect to the flight direction. In other words, there is a tilt to the left if one looks along the flight 10
path.
3.4 Long term behaviour
To assess the long term trend of MIPAS pointing we again employ the quantities used in the preceding sections.
First offset and gradient which characterize the course of∆hover an entire orbit are 15
examined. Again data from the time ranges 01:30–03:00 UTC and 13:30–15:00 UTC have been excluded. Figure 10 depicts the corresponding data. The upper panel shows offset values plotted against orbit number, where every diamond represents one orbit. The thick line connecting squares is the daily average. The scatter of the single orbit data is conspicuous, as already visible in Fig. 6. Now it is obvious that it 20
has two main constituents: Firstly there is the scatter of data of one day which is the manifestation of the daily trend(s) in ∆h, and consequently in the offset, as already discussed in Sect.3.1. Secondly there is a multitude of trends of different time scales visible, some of which are separated by jumps. A major trend is visible between orbits 3500–8000 (begin of November 2002 through early September 2003). The daily mean 25
ACPD
6, 13075–13110, 2006Characterization of MIPAS elevation
pointing
M. Kiefer et al.
Title Page
Abstract Introduction
Conclusions References
Tables Figures
◭ ◮
◭ ◮
Back Close
Full Screen / Esc
Printer-friendly Version
Interactive Discussion
EGU trend of 80 m/month. After a jump of offset values down to−1.6 km around orbit 8100
there are two time ranges with quite constant values each, namely−1.6 km at at orbits
8100–8500 and−1.1 km at orbits 8600–9200. Orbits greater than approximately 9300
(which corresponds to the date of the major software update) show significantly lower scatter in daily offset values as well as a relatively stable average value. This again 5
is a manifestation of the quality gain achieved by the PSO software update. Gradient values (lower panel of Fig.10) do not exhibit any clear indication of trend while the improvement in data scatter after 12 December 2003 is small. The details of this have already been discussed at Sect.3.1.
The slopes of the fitted regression lines of azimuth angle and height offset are plotted 10
over orbit number in Fig.11. The upper panel shows the slopes of the pair∆handα, while in the lower slopes of the∆(∆h)-∆α correlation is drawn. Again only data which does not fall into the two time ranges of satellite attitude parameter updates (01:30– 03:00 UTC and 13:30–15:00 UTC) have been considered. In principle, both slopes, d∆h/dαand d∆(∆h)/d∆α should have equal values.
15
As shown in Table 1 this essentially is true. However in d∆h/dα there obviously is a slight difference between data sets restricted to 02:00–14:00 UTC and to 14:00– 02:00 UTC.
As a general result we can state that, for the entire time examined here, there is evidence for a roll angle of the MIPAS measurement geometry of about 54±6 mdeg.
20
With respect to the direction of flight the tilt is to the left.
4 MIPAS operational pointing characterisation
As stated in Sect.1.2, MIPAS pointing is particularly sensitive to the orientation of the satellite x- and y-axes (see Fig. 1). The instrument, therefore, can be exploited to determine accurate estimates of pitch and roll angles respectively. For this purpose, a 25
ACPD
6, 13075–13110, 2006Characterization of MIPAS elevation
pointing
M. Kiefer et al.
Title Page
Abstract Introduction
Conclusions References
Tables Figures
◭ ◮
◭ ◮
Back Close
Full Screen / Esc
Printer-friendly Version
Interactive Discussion
EGU driven to their end stops and the radiance emitted by bright infrared stars crossing the
IFOV is measured.
The trajectory of the stars motion inside the EFOV is dependent upon the view-ing direction. While lookview-ing in the rearward direction, due to the rotational motion of the satellite in its orbit, the stars have a trajectory approximately parallel to the nadir 5
direction and therefore nearly perpendicular to the XY-plane. In order to acquire Line-Of-Sight (LOS) measurements in the rearward looking geometry, the IFOV is placed at a fixed elevation, near an approaching star and held up until the star has completely crossed the IFOV. The difference between the measured star crossing time and the expected crossing time is directly related to MIPAS mispointing caused by an error in 10
the pitch angle.
When the instrument looks sideways, the star trajectories parallel to the nadir direc-tion are seen as circular arcs within the EFOV. In this geometry, the IFOV is moved upwards at a pseudo-constant rate in elevation while scanning also in azimuth in or-der to keep the star azimuth-centred within the IFOV. Differences between actual and 15
predicted star crossing times are again linked to the instrument pointing. Sideways measurements are particularly sensitive to mispointing due to the roll angle of the in-strument.
The accuracy of the pointing measurements is strictly related to the accuracy achieved in the determination of the time at which a given star crosses the IFOV. In 20
order to locate the star signal with a good accuracy, the signal-to-noise ratio of the measured radiance has to be increased by scanning repeatedly the same star several times and averaging the measured signals. Actually this operation is possible because MIPAS is capable of observing the same star for time intervals 40 s long (in the rear-ward direction). Therefore, since the nominal star crossing time is approximately 4 25
seconds, the same star can be observed up to ten times in succession.
During the measurements, the signal is acquired only from channels D1 and D2
(Endemann, 1999) and processed on-ground using detailed information concerning
mea-ACPD
6, 13075–13110, 2006Characterization of MIPAS elevation
pointing
M. Kiefer et al.
Title Page
Abstract Introduction
Conclusions References
Tables Figures
◭ ◮
◭ ◮
Back Close
Full Screen / Esc
Printer-friendly Version
Interactive Discussion
EGU surements with a six-parameters model that includes a bias and a sine variation of the
pitch and roll error on the platform attitude as a function of the position along the orbit. LOS measurements cover 2 subsequent orbits and about 60–80 star crossings are observed. The measurements are performed on a weekly basis and processed bi-weekly. This plan allows a proper monitoring of the pointing stability and guarantees 5
the availability of pointing data in case of missing products (unavailability of products containing LOS measurements may be caused by instrument unavailability, failure in commands execution, data transfer problems, failure in data processing, etc.). The baseline for LOS calibration foresees that the absolute bias is compared with the last value disseminated in the ground segment, then a new LOS calibration Auxiliary Data 10
File (ADF) is disseminated only if the absolute difference between the two biases is larger than 8 mdeg (corresponding to about 450 m in tangent height). The disseminated ADF contains pointing error knowledge to be used within L1b data processing to correct pointing during computation of the engineering tangent altitudes.
At the beginning of MIPAS mission, only LOS star measurements from detector D1 15
were analysed because this detector was less noisy than detector D2. However, start-ing from September 2003 the noise of channel D1 increased significantly (without im-pact on science data because this is a low frequency noise) and star signals were no longer visible. Detector D2 is currently used as backup, however, compared to the beginning of the mission, fewer stars are observed with good signal-to-noise ratio. To 20
overcome this problem a new commanding scenario has been implemented in Novem-ber 2004 in order to double the numNovem-ber of observable crossings per star and hence reduce the noise, but no evident improvements have been observed in the noise re-duction. Due to the low signal-to-noise ratio of the LOS measurements, it is now hard to determine accurately the orbital variation of MIPAS mispointing. Therefore, the above 25
ACPD
6, 13075–13110, 2006Characterization of MIPAS elevation
pointing
M. Kiefer et al.
Title Page
Abstract Introduction
Conclusions References
Tables Figures
◭ ◮
◭ ◮
Back Close
Full Screen / Esc
Printer-friendly Version
Interactive Discussion
EGU been inter-compared with restituted attitude information from the Envisat star trackers,
in preparation for future operational use of restituted attitude in off-line processing. Apart from a pitch bias of 24 mdeg, results from the MIPAS LOS campaign agree with star tracker information. Investigations are currently ongoing to find the cause of the observed pitch bias. Moreover, since November 2004, sideways measurements have 5
been interrupted because the related processed data were not reliable. The prototype software for LOS processing is suspected to be the responsible for the degradation of the sideways LOS measurements, however investigations on this regard are still in progress.
In Fig.12we report the long term trend of MIPAS mispointing determined during the 10
operational LOS characterization. The figure shows the absolute pointing bias as a function of the orbit number, in the time period from August 2002 to April 2005. Each point is obtained by averaging the values of the pointing error obtained from LOS cal-ibration measurements collected during two full orbits. The conversion of the pointing error from angle (radiants) to tangent altitude (km) was obtained simply multiplying the 15
angles by 3200 km, the average distance between the satellite and the tangent point of typical limb measurements. The pronounced variation of the pointing bias at the begin-ning of the mission was not related to the MIPAS instrument itself, but to an anomalous behaviour of the attitude of the entire ENVISAT satellite. This anomaly was the result of the erroneous response of the PSO software to the orbit control information. In fact, 20
after the update of the PSO software, implemented on 12 December 2003 (orbit 9321), the amplitude of the variations of the pointing bias was drastically reduced.
5 Results of other instruments or characterization methods
5.1 MIPAS
There is an ESA technical note on the ENVISAT Restituted Pitch Assessment (
Saave-25
ACPD
6, 13075–13110, 2006Characterization of MIPAS elevation
pointing
M. Kiefer et al.
Title Page
Abstract Introduction
Conclusions References
Tables Figures
◭ ◮
◭ ◮
Back Close
Full Screen / Esc
Printer-friendly Version
Interactive Discussion
EGU limb-viewing instruments onboard ENVISAT to obtain a characterization of the
plat-form’s pitch. Several results presented in the report can be directly compared to those of Sects.2–3, although the data ofSaavedra et al. (2005) is based on special MIPAS LOS calibration orbits (see preceding section).
The results with respect to the long term behaviour are discussed above in Sect.4. 5
As a further result there is found an indication for an orbit periodic pitch variation with an amplitude of about 3–4 mdeg. The pitch variation would have an orbit periodic effect in∆hof 170–220 m amplitude, i.e. much less than what is presented in Sect.3.3. No roll angle effects are considered bySaavedra et al.(2005).
At the 8th meeting of the MIPAS quality working group in September 2005, Anu 10
Dudhia of Oxford University has reported about retrieval results of MIPAS observations in the aircraft emission mode. This is a special mode where MIPAS is looking sideways, the respective measurements have been taken with azimuth angles of α=160◦ and
α=190◦. Anu Dudhia stated that the engineering altitudes reported in the L1b data
are about 5 km too low. This is in rough agreement with our results, both in sign and 15
magnitude, since forα=180◦we get∆h=3 km for a roll angle of 54 mdeg. 5.2 GOMOS
Saavedra et al. (2005) show analyses of GOMOS mispointing which hint to a
orbit-periodic variation of amplitude in the order of some mdeg. This in accordance with MIPAS results, see Sect.5.1.
20
Further there might be an indication of an uncorrected roll angle. This can be in-ferred from their Fig. 2-1, where GOMOS elevation mispointing is plotted over azimuth angle. The elevation mispointing clearly decreases from around zero at zero azimuth to
−20 mdeg at 80◦ azimuth. Extrapolation to 90◦ would give a value of about−25 mdeg
which corresponds to a tangent altitude offset of 1.4 km. It has to be noted though, 25
ACPD
6, 13075–13110, 2006Characterization of MIPAS elevation
pointing
M. Kiefer et al.
Title Page
Abstract Introduction
Conclusions References
Tables Figures
◭ ◮
◭ ◮
Back Close
Full Screen / Esc
Printer-friendly Version
Interactive Discussion
EGU 5.3 SCIAMACHY
A spatial and temporal characterization of SCIAMACHY limb pointing errors is pre-sented by von Savigny et al. (2005). A specific feature of the height profile of O3 radiation in the UV is employed to gain information about the true tangent altitudes. Since the method relies on horizontally homogeneous atmospheres, the results are 5
valid only in a latitude band of±20◦around the equator. The differences of engineering
tangent altitudes and retrieved tangent altitudes are averaged over orbits only for these equatorial geolocations. The resulting quantity is called offset. The time span covered is July 2002 through February 2005 with a data gap of 3.5 months in the summer of 2003.
10
The main results are, that there is a mean offset, a drift, a seasonal variation, and an occurence of two daily jumps. The characteristics of the respective phenomena are different before and after the major update of the PSO-algorithm software on 12 December 2003. While the drift, the amplitude of the seasonal variation, and the mag-nitude of the 14:00 UTC jump are lower after the software update, the average offset 15
increases as well as the magnitude of the 02:00 UTC jump.
To compare the offset results presented in von Savigny et al.(2005) with ∆h, it is important to note that SCIAMACHY is looking forward with respect to the MIPAS flight path. The definition of the height difference as above gives a reversal of sign compared to our definition. The impact of the two combined facts is that the SCIAMACHY results 20
should be directly comparable to the data presented here, given that both instrument’s main source for mispointing is the attitude error of the platform.
The constant offset component seen with SCIAMACHY is 500 m before and 1 km after 12 December 2003. The sign of the change seems to be compatible with our results while, due to the drift and jump features discussed in Sect. 3.4 there is no 25
ACPD
6, 13075–13110, 2006Characterization of MIPAS elevation
pointing
M. Kiefer et al.
Title Page
Abstract Introduction
Conclusions References
Tables Figures
◭ ◮
◭ ◮
Back Close
Full Screen / Esc
Printer-friendly Version
Interactive Discussion
EGU least in sign to 30 m/month reported for the SCIAMACHY data of the time before 12th
of December 2003. Asvon Savigny et al.(2005) we see that the jump at 14:00 UTC nearly vanishes after this date, however our data basis is not sufficient to either confirm or deny their statement that the 02:00 UTC jump has become worse.
6 Summary and conclusions 5
We have presented a characterization of MIPAS pointing elevation for two quantities which, on different stages of the data processing, represent the knowledge of the tan-gent altitudes. The results of the operation LOS calibration measurements based on star tracking are discussed in Sect.4, while in Sects.2–3results of a LOS retrieval are presented.
10
We have examined several aspects of the mispointing which is gained as retrieval result from the L1b data. First there is a height dependence of the differences between retrieved tangent altitudes and engineering tangent altitudes. However this height de-pendence is very systematic and quite stable over a time span of almost two years. Further it is compatible with the estimates of systematic errors which are to be ex-15
pected for the LOS retrieval (von Clarmann et al., 2003). We take the well defined shape of the height dependence as justification to regard one single value, namely the average of the differences, as a representative quantity for the mispointing at a given geolocation.
Before 12 December 2003 jumps, which occur twice a day, are a regular feature of 20
time series of the mispointing. The first jump at around 02:00 UTC usually is small while the second one at around 14:00 UTC is conspicuous and can reach values of 2 km. Most quantities which characterize the mispointing show a clear dependence on whether they are calculated in the interval 02:00–14:00 UTC or 14:00–02:00 UTC. The cause for the jumps has been identified by ESA to be the erroneous response of the 25
ACPD
6, 13075–13110, 2006Characterization of MIPAS elevation
pointing
M. Kiefer et al.
Title Page
Abstract Introduction
Conclusions References
Tables Figures
◭ ◮
◭ ◮
Back Close
Full Screen / Esc
Printer-friendly Version
Interactive Discussion
EGU much reduced. Our finding is confirmed byvon Savigny et al.(2005), who additionally
state that the size of the 02:00 UTC jump has increased after the respective software update.
The result that there is a strong depence on latitude of the mispointing, together with the observation that there are common small scale features in successive orbits, leads 5
us to suggest that there is a roll angle in the platform/instrument system which currently is not accounted for. A roll angle of 54±6 mdeg, corresponding to a tilt to the left,
referring to the flight direction, would explain a bigger part of the latitudinal behaviour of the mispointing. An explanation of the latitude dependence based on an orbit periodic pitch variation alone can be ruled out, since the operational LOS calibration for MIPAS 10
and GOMOS gives values for this effect, which are an order of magnitude below what we actually find. However the particular course of the mispointing on descending orbit parts remains to be explained.
For examination of the longterm behaviour we took the retrieval results as well as dedicated LOS calibration measurements. Although the results can not be compared 15
directly, because the LOS calibration measurements give absolute pointing deviations, while the engineering altitudes already contain corrections for mispointing gained by the LOS calibration, it is interesting to see, that some features are well visible in both data sets. This is depicted in Fig.13 which shows data from the jump in mispointing around orbit 8100 until the end of March 2004 (major MIPAS failure) and includes the 20
date of the PSO software update on 12 December 2003. Apart from the fact that the absolute mispointing has shifted up by 1.1 km the overall runs of the two datat sets do match quite well.
Finally it has to be noted that it is impossible to give a general and simple correction scheme for the engineering tangent altitudes. Although some of the systematic devia-25
tions could be reduced, e.g. the impact of the roll angle, many others, less well defined ones, can not.
prod-ACPD
6, 13075–13110, 2006Characterization of MIPAS elevation
pointing
M. Kiefer et al.
Title Page
Abstract Introduction
Conclusions References
Tables Figures
◭ ◮
◭ ◮
Back Close
Full Screen / Esc
Printer-friendly Version
Interactive Discussion
EGU ucts, and avoid tangent altitudes as reference. To avoid confusion: L2 data products
generated with the IMK processor are not affected by the detected pointing fluctuations because the retrieved pointing information is used.
Acknowledgements. F. Niro (Serco), and R. Koopman (ESA/ESRIN) have provided data and
documents. 5
References
Bertaux, J. L., Hauchecorne, A., Dalaudier, F., Cot, C., Kyr ¨ol ¨a, E., Fussen, D., Tamminen, J., Leppelmeier, G. W., Sofieva, V., Hassinen, S., Fanton d’Andon, O., Barrot, G., Mangin, A., Th ´eodore, B., Guirlet, M., Korablev, O., Snoeij, P., Koopman, R., and Fraisse, R.: First results on GOMOS/ENVISAT, Adv. Space Res., 33, 1029–1035, 2004. 13077
10
Bovensmann, H., Burrows, J. P., Buchwitz, M., Frerick, J., No ¨el, S., Rozanov, V. V., Chance, K. V., and Goede, A. P. H.: SCIAMACHY: Mission objectives and measurement modes, J. Atmos. Sci., 56, 127–150, 1999. 13077
Endemann, M.: MIPAS Instrument Concept and Performance, in Proceedings of European Symposium on Atmospheric Measurements from Space, Noordwijk, Netherlands, 18–22 15
January, vol. WPP-161, pp. 29–43, European Space Agency, ESTEC, Noordwijk, The Netherlands, 1999. 13088
Fischer, H. and Oelhaf, H.: Remote sensing of vertical profiles of atmospheric trace con-stituents with MIPAS limb-emission spectrometers, Appl. Opt., 35, 2787–2796, 1996. 13077 Kyr ¨ol ¨a, E., Tamminen, J., Leppelmeier, G. W., Sofieva, V., Hassinen, S., Bertaux, J. L., 20
Hauchecorne, A., Dalaudier, F., Cot, C., Korablev, O., Fanton d’Andon, O., Barrot, G., Man-gin, A., Th ´eodore, B., Guirlet, M., Etanchaud, F., Snoeij, P., Koopman, R., Saavedra, L., Fraisse, R., Fussen, D., and Vanhellemont, F.: GOMOS on Envisat: an overview, Adv. Space Res., 33, 1020–1028, 2004. 13077
Ridolfi, M., Carli, B., Carlotti, M., von Clarmann, T., Dinelli, B., Dudhia, A., Flaud, J.-M., H ¨opfner, 25
M., Morris, P. E., Raspollini, P., Stiller, G., and Wells, R. J.: Optimized Forward and Retrieval Scheme for MIPAS Near-Real-Time Data Processing, Appl. Opt., 39, 1323–1340, 2000. 13077,13079
Saavedra, L., Mantovani, R., and Dehn, A.: ENVISAT Restituted Pitch Assessment, Technical Note ENVI-SPPA-EOPG-TN-05-0011, ESA, 2005. 13090,13091
ACPD
6, 13075–13110, 2006Characterization of MIPAS elevation
pointing
M. Kiefer et al.
Title Page
Abstract Introduction
Conclusions References
Tables Figures
◭ ◮
◭ ◮
Back Close
Full Screen / Esc
Printer-friendly Version
Interactive Discussion
EGU von Clarmann, T., Glatthor, N., Grabowski, U., H ¨opfner, M., Kellmann, S., Kiefer, M., Linden,
A., Mengistu Tsidu, G., Milz, M., Steck, T., Stiller, G. P., Wang, D. Y., Fischer, H., Funke, B., Gil-L ´opez, S., and L ´opez-Puertas, M.: Retrieval of temperature and tangent altitude pointing from limb emission spectra recorded from space by the Michelson Interferometer for Passive Atmospheric Sounding (MIPAS), J. Geophys. Res., 108, 2003. 13077,13078,13093 5
von Savigny, C., Kaiser, J. W., Bovensmann, H., Burrows, J. P., McDonald, I. S., and Leblanc, T.: Spatial and temporal characterization of SCIAMACHY limb pointing errors during the first three years of the misson, Atmos. Chem. Phys., 5, 2593–2602, 2005,
ACPD
6, 13075–13110, 2006Characterization of MIPAS elevation
pointing
M. Kiefer et al.
Title Page
Abstract Introduction
Conclusions References
Tables Figures
◭ ◮
◭ ◮
Back Close
Full Screen / Esc
Printer-friendly Version
Interactive Discussion
EGU Table 1.Statistics of slopes of fitted lines.
Statistics of d∆h/dα
time range mean [km/◦] std. dev. [km/◦] median [km/◦]
02:00–14:00 UTC 0.036 0.005 0.036
14:00–02:00 UTC 0.044 0.004 0.044
00:00–24:00 UTC 0.040 0.004 0.040
Statistics of d∆(∆h)/d∆α
time range mean [km/◦] std. dev. [km/◦] median [km/◦]
02:00–14:00 UTC 0.042 0.004 0.042
14:00–02:00 UTC 0.042 0.007 0.043
ACPD
6, 13075–13110, 2006Characterization of MIPAS elevation
pointing
M. Kiefer et al.
Title Page
Abstract Introduction
Conclusions References
Tables Figures
◭ ◮
◭ ◮
Back Close
Full Screen / Esc
Printer-friendly Version
Interactive Discussion
EGU htg
x
y
z
v
EFOVsideways
a
e
IFOV EFOVrearward
Da
De
ACPD
6, 13075–13110, 2006Characterization of MIPAS elevation
pointing
M. Kiefer et al.
Title Page
Abstract Introduction
Conclusions References
Tables Figures
◭ ◮
◭ ◮
Back Close
Full Screen / Esc
Printer-friendly Version
Interactive Discussion
EGU Fig. 2. Altitude dependence of ∆hi for all orbits of the four days indicated in the panel’s
ACPD
6, 13075–13110, 2006Characterization of MIPAS elevation
pointing
M. Kiefer et al.
Title Page
Abstract Introduction
Conclusions References
Tables Figures
◭ ◮
◭ ◮
Back Close
Full Screen / Esc
Printer-friendly Version
Interactive Discussion
EGU Fig. 3. Rms-values of ∆hi-profiles, collected for all geolocations of one orbit each, plotted
ACPD
6, 13075–13110, 2006Characterization of MIPAS elevation
pointing
M. Kiefer et al.
Title Page
Abstract Introduction
Conclusions References
Tables Figures
◭ ◮
◭ ◮
Back Close
Full Screen / Esc
Printer-friendly Version
Interactive Discussion
EGU Fig. 4. ∆hin the course of a day for four different dates. The upper threee panels represent
ACPD
6, 13075–13110, 2006Characterization of MIPAS elevation
pointing
M. Kiefer et al.
Title Page
Abstract Introduction
Conclusions References
Tables Figures
◭ ◮
◭ ◮
Back Close
Full Screen / Esc
Printer-friendly Version
Interactive Discussion
EGU Fig. 5. ∆hof orbit 2881 plotted against UTC (upper panel) and against geographical latitudeβ
ACPD
6, 13075–13110, 2006Characterization of MIPAS elevation
pointing
M. Kiefer et al.
Title Page
Abstract Introduction
Conclusions References
Tables Figures
◭ ◮
◭ ◮
Back Close
Full Screen / Esc
Printer-friendly Version
Interactive Discussion
EGU Fig. 6. Histograms of the offset of ∆h. Top left panel: All data before 10 December 2003
ACPD
6, 13075–13110, 2006Characterization of MIPAS elevation
pointing
M. Kiefer et al.
Title Page
Abstract Introduction
Conclusions References
Tables Figures
◭ ◮
◭ ◮
Back Close
Full Screen / Esc
Printer-friendly Version
Interactive Discussion
EGU Fig. 7. Histograms of the gradient of∆hwith respect to latitude. Type of data restrictions as in
ACPD
6, 13075–13110, 2006Characterization of MIPAS elevation
pointing
M. Kiefer et al.
Title Page
Abstract Introduction
Conclusions References
Tables Figures
◭ ◮
◭ ◮
Back Close
Full Screen / Esc
Printer-friendly Version
Interactive Discussion
EGU Fig. 8. ∆hof several orbits, separated into ascending (upper panel) and descending (lower
ACPD
6, 13075–13110, 2006Characterization of MIPAS elevation
pointing
M. Kiefer et al.
Title Page
Abstract Introduction
Conclusions References
Tables Figures
◭ ◮
◭ ◮
Back Close
Full Screen / Esc
Printer-friendly Version
Interactive Discussion
EGU Fig. 9. Correlation of∆hand azimuthα. Left column shows∆handαagainst time (top and
middle panel, respectively), and the corresponding scatter plot (bottom). Right column has
ACPD
6, 13075–13110, 2006Characterization of MIPAS elevation
pointing
M. Kiefer et al.
Title Page
Abstract Introduction
Conclusions References
Tables Figures
◭ ◮
◭ ◮
Back Close
Full Screen / Esc
Printer-friendly Version
Interactive Discussion
EGU Fig. 10. Offset (top) and gradient (lower panel) drawn over orbit number. Only days with at
ACPD
6, 13075–13110, 2006Characterization of MIPAS elevation
pointing
M. Kiefer et al.
Title Page
Abstract Introduction
Conclusions References
Tables Figures
◭ ◮
◭ ◮
Back Close
Full Screen / Esc
Printer-friendly Version
Interactive Discussion
EGU Fig. 11. Slope of the lines fitted to∆handα(upper panel) and to∆(∆h) and∆α(lower panel)
ACPD
6, 13075–13110, 2006Characterization of MIPAS elevation
pointing
M. Kiefer et al.
Title Page
Abstract Introduction
Conclusions References
Tables Figures
◭ ◮
◭ ◮
Back Close
Full Screen / Esc
Printer-friendly Version
Interactive Discussion
EGU
-4 -3 -2 -1 0 1
2000 4000 6000 8000 10000 12000 14000 16000 18000
Average pointing error (km)
Orbit number #
ACPD
6, 13075–13110, 2006Characterization of MIPAS elevation
pointing
M. Kiefer et al.
Title Page
Abstract Introduction
Conclusions References
Tables Figures
◭ ◮
◭ ◮
Back Close
Full Screen / Esc
Printer-friendly Version
Interactive Discussion
EGU Fig. 13.Comparison of quantities characterizing the mispointing: Big filled circles are the same