www.atmos-meas-tech.net/4/1713/2011/ doi:10.5194/amt-4-1713-2011
© Author(s) 2011. CC Attribution 3.0 License.
Measurement
Techniques
Development of a high spectral resolution surface albedo product
for the ARM Southern Great Plains central facility
S. A. McFarlane1, K. L. Gaustad1, E. J. Mlawer2, C. N. Long1, and J. Delamere2 1Pacific Northwest National Laboratory, Richland, WA, USA
2Atmospheric and Environmental Research Inc., Lexington, MA, USA
Received: 22 April 2011 – Published in Atmos. Meas. Tech. Discuss.: 24 May 2011 Revised: 4 August 2011 – Accepted: 22 August 2011 – Published: 1 September 2011
Abstract. We present a method for identifying dominant surface type and estimating high spectral resolution surface albedo at the Atmospheric Radiation Measurement (ARM) facility at the Southern Great Plains (SGP) site in Okla-homa for use in radiative transfer calculations. Given a set of 6-channel narrowband visible and near-infrared ir-radiance measurements from upward and downward look-ing multi-filter radiometers (MFRs), four different surface types (snow-covered, green vegetation, partial vegetation, non-vegetated) can be identified. A normalized difference vegetation index (NDVI) is used to distinguish between veg-etated and non-vegveg-etated surfaces, and a scaled NDVI in-dex is used to estimate the percentage of green vegetation in partially vegetated surfaces. Based on libraries of spec-tral albedo measurements, a piecewise continuous function is developed to estimate the high spectral resolution surface albedo for each surface type given the MFR albedo values as input. For partially vegetated surfaces, the albedo is es-timated as a linear combination of the green vegetation and non-vegetated surface albedo values. The estimated albedo values are evaluated through comparison to high spectral res-olution albedo measurements taken during several Intensive Observational Periods (IOPs) and through comparison of the integrated spectral albedo values to observed broadband albedo measurements. The estimated spectral albedo values agree well with observations for the visible wavelengths con-strained by the MFR measurements, but have larger biases and variability at longer wavelengths. Additional MFR chan-nels at 1100 nm and/or 1600 nm would help constrain the high resolution spectral albedo in the near infrared region.
Correspondence to:S. A. McFarlane ([email protected])
1 Introduction
Radiative closure calculations, in which radiative transfer model calculations are compared to irradiance (flux) or ra-diance measurements, can serve as a testbed to evaluate the specification of atmospheric column properties retrieved from measurements (including surface conditions, water va-por amount, and aerosol and cloud properties), radiative transfer model calculations, and the radiative measurements themselves (e.g., Michalsky et al., 2006; McFarlane and Evans, 2004; Turner et al., 2004; Halthore and Schwartz, 2000; Mlawer et al., 2000). Previously, studies using data from the Atmospheric Radiation Measurement (ARM) Pro-gram have performed such comparisons in the longwave spectral region to refine treatment of the longwave water va-por continuum and to improve the specification of the atmo-spheric water vapor column. Through these closure studies, the uncertainty in calculated, clear-sky longwave irradiances at the surface has been reduced to less than 2 Wm−2for the range of measured precipitable water vapor values (Turner et al., 2004). The ARM community is now pursuing similar closure studies of broadband and spectral measurements in the shortwave to evaluate retrieved cloud and aerosol proper-ties and to improve understanding of the shortwave spectral region.
transfer applications, specification of a daily-averaged broad-band albedo may be sufficient, but in other cases, specifica-tion of temporally and spectrally resolved surface albedo is needed. Previous studies have indicated that even in broad-band closure studies, use of a spectrally resolved albedo can impact calculated diffuse irradiances due to the fact that at-mospheric constituents such as aerosol, molecules, and wa-ter vapor have spectrally dependent scatwa-tering and absorption properties (Michalsky et al., 2003). For spectral closure stud-ies, spectrally resolved surface albedo is even more critical.
There are few available data products that provide high spectral resolution surface albedo that can be used for high spectral resolution radiative transfer modeling or that can be easily averaged over the various wavelength ranges used in different radiative transfer models. Satellite products provide important information about spatial variability of albedo, but they have limited temporal and spectral sampling and must be corrected for atmospheric effects (Schaaf et al., 2002). Al-though detailed surface albedo measurements are often gath-ered for specific field experiments (e.g., Michalsky et al., 2003; Li et al., 2002; Liang et al., 2002) for closure studies to be most useful in identifying issues with the inputs, mea-surements, or models, calculations need to be run routinely under a wide range of atmospheric conditions.
The primary goal of this study is to develop and evalu-ate a routine long-term spectral albedo product for the ARM Southern Great Plains (SGP) site that can be used for radia-tive transfer calculations with a variety of models in combi-nation with other measurements from the site. At the SGP central facility (CF), spectral irradiance is measured by two sets of upward-looking 6-channel multi-filter rotating shad-owband radiometers (MFRSRs) combined with downward-looking multi-filter radiometers (MFRs) located on a 10 m tower and at the 25 m level on a 60 m tower. Since the MFR measurements only cover the spectral range from 415– 940 nm, prediction of the spectral albedo at longer wave-lengths is challenging. We present a method for producing a high resolution spectral albedo product that consists of cre-ating best estimate broadband and spectral channel albedos from MFRSR and MFR irradiance measurements, identify-ing the dominant observed surface type, and usidentify-ing libraries of high spectral resolution albedo for various surface types to extrapolate the 6-channel MFR albedo measurements from 820 to 50 000 cm−1 (0.2 to 12 µm) at 10 cm−1 resolution. The uncertainties in the extrapolated albedos are evaluated by comparison to high spectral resolution measurements taken during several field experiments at the site and by comparing integrated spectral albedos to measured broadband albedos.
2 Data
2.1 Radiometer measurements
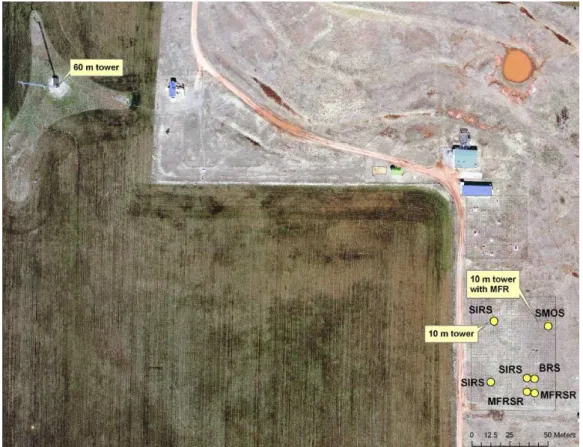
The SGP site has several suites of radiometers, as indicated on the map in Fig. 1. At the CF radiometer area, there are two ground-based MFRSRs (mfrsrC1 and mfrsrE13) and three sets of ground-based Eppley precision spectral pyra-nometers (PSPs) and pryheliometers that are part of the Solar and Infrared Radiation Station (SIRS) and Broadband Ra-diometer Station (BRS) networks. Additionally there are two 10 m towers (the SIRS tower in the upper left corner of the radiometer area and the Surface Meteorological Observ-ing System (SMOS)), both of which have downward-lookObserv-ing PSPs. The SMOS tower also has a downward looking MFR. A second looking MFR (along with a downward-looking PSP) is located at the 25 m level of the 60 m tower, approximately 300 m from the CF radiometer area. (For sim-plicity, in the remainder of the paper, we will refer to this second tower and the instruments located on it as the 25 m tower.)
The MFRs measure shortwave global irradiance in six nar-rowband channels (415, 500, 615, 673, 870, and 940 nm) and one broadband channel at 20 s intervals. The narrowband fil-ters have a 10 nm full width at half maximum bandwidth and are periodically calibrated using lamp calibrations and Lan-gley plots, except for the 940 nm channel which only uses lamp calibrations (Flynn and Hodges, 2005). The silicon broadband channel has a wavelength range of 300–1100 nm. The MFRSRs measure total and diffuse downwelling spec-tral irradiance at the same channels as the MFRs. A rotating shadowband periodically blocks the solar disk for the diffuse measurement, and then the direct downwelling irradiance is derived by subtracting the diffuse irradiance from the total irradiance.
Fig. 1. Map of SGP central facility indicating the location of the radiometers used in this study. Photo courtesy of Aerial Oklahoma, Inc. Map annotations provided by Alice Cialella, Brookhaven National Laboratory.
The two MFRs measure upwelling spectral irradiance above different surface types: the 10 m MFR is located in an un-mowed pasture while the 25 m MFR is located in a culti-vated field. Prior to the fall of 2004 the field under the 25 m MFR was planted with winter wheat, since then the field has been planted with various crops including corn, wheat, and soybeans. These two sites are representative of typical sur-faces in the area surrounding the CF, although they do not cover the full range of variability of vegetation types. The spectral albedo of the surfaces under the two towers varies considerably over the year as the vegetation characteristics change or crops or planted and harvested.
2.2 Best estimate MFR and broadband albedos
To produce near continuous best estimate albedos in the six MFR spectral channels, we determine the best estimate of the downwelling and upwelling irradiance values mea-sured by the MFRSRs and MFRs, fill in missing irradiance values where possible, calculate the albedo for periods for which the irradiance data existed, and then fill in the re-maining gaps in the narrowband spectral albedo where pos-sible. A brief description of the process used in each of these steps is presented below; further details are available in McFarlane et al. (2011).
2.2.1 Downwelling irradiance
For each day, the MFR and MFRSR 20 s samples are first averaged up to 60 s to match the time resolution of the BE-Flux data. The MFRSR broadband data are then calibrated by calculating a linear scaling factor in comparison to the BEFlux data for each instrument. Simple ratio tests between the mfrsrC1, mfrsrE13, and BEFlux datasets are used to de-termine whether to use mfrsrC1, mfrsrE13 or an average of the two measurements as the preferred MFRSR broadband measurement. Cases where both mfrsrC1 and mfrsrE13 are missing or neither is within 10 % of the BEFlux value are labeled missing. The MFRSR broadband measurements are used primarily to quality control and fill in missing values of the narrowband values, as described below.
measurement is chosen. For smaller or larger ratios, the sam-ple is labeled as bad.
To estimate downwelling broadband values for missing data, the average value of the ratio of the downwelling MFRSR broadband value to the BEFlux value is calculated for good samples occurring immediately before and/or after the missing period. For each sample during the missing pe-riod, the BEFlux value is multiplied by the calculated ratio. Samples for which BEFlux is missing or less than 200 Wm−2 are not corrected. Only data gaps less than 30 min long are filled, and there must be at least as many good samples im-mediately preceding or following the gap as there are miss-ing samples. Once the broadband values are corrected, es-timates are made for missing narrowband values using the same procedure but using ratios of the given narrowband value to the broadband value. At this time, no dependence on solar zenith angle or cloud cover is considered when fill-ing in missfill-ing narrowband values, although the ratio of nar-rowband to broadband irradiance does depend somewhat on these factors (Liang, 2000).
2.2.2 Upwelling irradiance
For the upwelling irradiance values, suspect irradiance data are removed through a variety of techniques including ratio tests between the available measurements, the application of minimum, maximum, and standard deviation limits identi-fied through seasonal and diurnal analysis, and filtering for suspect conditions such as small irradiance values and large solar zenith angles. Large standard deviations often occur at low sun angles, so all samples with cosine of solar zenith angle (µ0) less than 0.15 are removed from the analysis. As described for the downwelling irradiance values, missing and bad upwelling irradiance values are estimated using expected ratios between the irradiances needed and a known good ref-erence value. For the broadband 10 m and 25 m MFR up-welling values, the reference value is the corresponding 10 m or 25 m PSP value. For the narrowband MFR upwelling irra-diances, the reference value is the corresponding upwelling broadband value (which has already been quality controlled). 2.2.3 Albedo calculations
MFR broadband and narrowband surface albedo values are calculated for both the 10 m and 25 m towers by dividing the best estimate of the upwelling irradiance from the MFR for the appropriate tower by the best estimate of the MFRSR downwelling irradiance for the central facility. Due to un-certainty in calculated albedos when downwelling and up-welling irradiances are small, broadband albedos are not cal-culated for periods where the BEFlux is less than 50 Wm−2. Narrowband albedos are calculated for all samples for which both the narrowband data is considered good and for which a broadband albedo could be calculated. Albedo values for
which one of the input irradiance values was estimated as de-scribed above are flagged and labeled “irradiance estimated” in the analysis presented in Sect. 4.
For periods with missing or bad albedo values, estimates of the broadband and narrowband albedo are made, however the albedo estimation method depends on whether the sky conditions are classified as diffuse (direct irradiance<15 % of total irradiance) or direct. For diffuse conditions, there is little dependence of surface albedo on solar zenith angle, and so the albedo value near solar noon can be used to represent the entire day. The near noon albedo for both the 10 m and 25 m towers is calculated for all days for which there are a sufficient number of samples under diffuse conditions during the one hour periods before or after solar noon. For days not meeting that condition, the near noon albedo is estimated by interpolating from surrounding days.
For direct conditions there is a strong dependence of albedo on solar zenith angle, which must be taken into ac-count in estimating the albedo over the course of the day (Henderson-Sellers and Wilson, 1983). For days with suffi-cient number of samples under direct albedo conditions, the slope and offset of the best fit line relating direct albedo to µ0 are calculated and used to estimate the missing albedos (McFarlane et al., 2011). For days without enough direct albedo samples, the values of the albedo slope and offset are interpolated from surrounding days.
Broadband and narrowband MFR albedos are calculated using the same methodology, but with different near noon albedo values and different fit coefficients for direct con-ditions. Albedo values estimated using the procedures de-scribed above are flagged and are labeled as “albedo esti-mated” in later analysis. The final dataset contains a near continuous set of measured or estimated broadband and nar-rowband albedo values for all samples whereµ0>0.15.
PSP broadband albedo values are calculated using the 10 m and 25 m PSP upwelling irradiance values and the downwelling irradiance from the BEFlux dataset. As in the other datastreams, samples with BEFlux <200 Wm−2 are flagged as indeterminate and albedo calculations are not made for samples with µ0<0.15. As the PSP broadband albedo is mainly used to evaluate the spectral albedo estima-tion, no estimates are made to correct for missing or bad PSP albedo values.
2.3 Spectroradiometer measurements
During several intensive observational periods (IOPs) con-ducted 14–19 August 2002, 20–26 October 2004 and 8– 12 February 2004, spectral surface albedo measurements were taken over a wide variety of surface conditions at vari-ous locations around the SGP central facility (Trishchenko et al., 2003). During the August 2002 IOP, albedo was mea-sured with a GER3700 spectroradiometer (320–2500 nm) and during the 2004 IOPs, albedo was measured with an Analytical Spectral Devices (ASD) FieldSpec Pro spectro-radiometer (350–2500 nm). The ASD had spectral sampling resolution of 1.5 nm over the full range, although there were often sampling gaps between∼1300 to 1450 nm, between 1800 to 1950 nm, and beyond 2000 nm. The location of the gaps shifted somewhat between measurements. The GER had spectral sampling resolution of 1.5 nm over the range 300–1050 nm, 6.2 nm over the range 1050–1900 nm, and 9.5 nm over the range 1900–2500 nm and could take mea-surements with 3◦
or 9◦
field of view or 180◦
if a diffuser was used. The GER measurements often had sampling gaps between 1900–2000 nm. In general, the measured spectral albedos tended to be noisier for wavelengths longer than 1600 nm.
For each measurement, the time of measurement, surface conditions, cloud cover, and photographs of the measurement sites were documented in field reports (Trishchenko et al., 2003, 2004a, b). Measurements were taken below the 10 m and 25 m MFRs and at other sites around the CF. Surface conditions included bare soil, various stages in the growth cycle of grass, wheat and soybeans, corn/wheat stubble, and snow. The snow occurred just prior to the start of the Octo-ber 2004 IOP and melted during the first two days of the IOP. During this IOP there were several occasions where the spectral albedo measurements were unexpectedly high and noisy at wavelengths beyond 1000 nm. Examination of the photographs and measurement logs indicated that during these observations, residual ice or snow on the ground may have affected the measured albedo. These cases were not used in the following analysis. The high spectral resolution measurements from the IOPs are used in Sect. 4.1 to evaluate the method of extrapolating the MFR narrowband albedos to a broader wavelength range and higher spectral resolution.
3 Identification of surface type
The spectral albedo of a land surface is a function of the ex-istence, extent, and type of vegetation that covers the area; if two different areas have the same surface characteristics then their spectral albedos will also be similar (Liang et al., 1999). We assume that if a set of surface types that charac-terize a site and result in unique spectral albedo signatures can be identified, they can also be used to predict the spectral albedo. Estimating spectral albedo for all times at the SGP
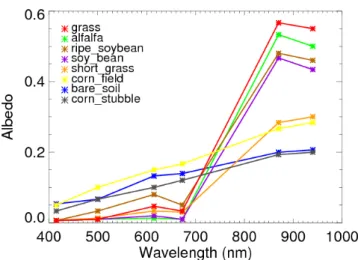
Fig. 2.Spectral albedo values at the MFR wavelengths for different surface types, adapted from figures in Liang et al. (2002).
central facility requires that a set of surface types be iden-tified using only the albedos corresponding to the six MFR operating wavelengths. Figure 2 shows the values of the nar-rowband albedos at the six MFR wavelengths for the spectral measurements presented in Liang et al. (2002). The MFR operating wavelengths do not contain enough information to distinguish between particular types of lush green vegetation (i.e. soybean and wheat in Fig. 2) but there are distinct differ-ences at the MFR wavelengths between lush vegetated sur-faces (soybean, etc.), partially vegetated sursur-faces in which green vegetation exists, but is not lush enough to completely shield the soil (grass, short grass) and brown surfaces (bare soil, corn stubble).
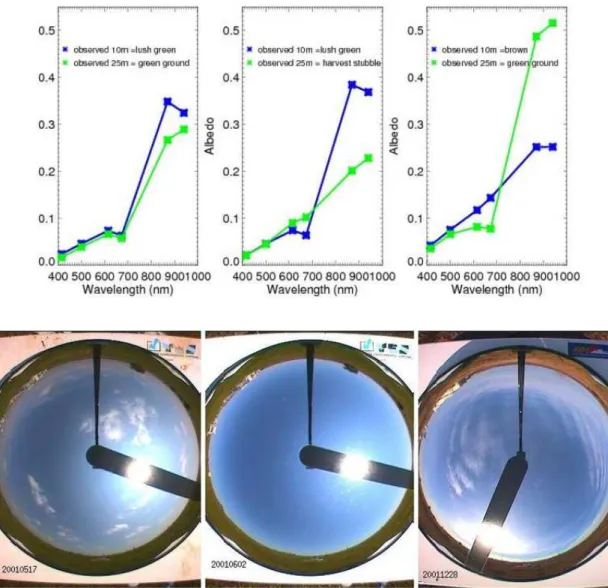
To further assess the utility of the MFR wavelengths for distinguishing between vegetated and non-vegetated sur-faces, we examined a dataset consisting of visual assess-ments made by site personnel during 2001 (the sgpsur-flogC1.c1 data stream; hereafter referred to as surflog) and images from the Total-Sky Imager (TSI). The TSI, which is located near the 10 m tower has a hemispheric mirror that reflects the sky to observe clouds. Around the edges of the TSI image, the surface conditions near the 10 m tower can be seen (e.g., Fig. 3 top panels). The surflog visual assess-ments were performed roughly twice a month at the central facility, limiting the dataset to approximately 25 days spread across 2001.
Fig. 3.Examples of (top) MFR measurements and (bottom) TSI images for several different surface types as indicated by observers in the surflog datastream.
very similar characteristics, representative of green vegeta-tion, with low values in the visible, a dip in albedo between 615 and 673 nm, and high values in the near-IR. For the sec-ond case, 31 May 2001 the surflog report indicates that the winter wheat under the 25 m tower had been recently har-vested and the MFR albedo shows characteristics of bare soil or dead vegetation, with a fairly linear relationship between the visible and near-IR albedos. The 10 m tower is still “lush green” as reported in the surflog and seen in the TSI im-ages (from 2 June 2001) and the MFR albedos. Finally, in the last case, on 28 December 2001, winter wheat under the 25 m tower is growing as indicated by the “green ground” report from the surflog and the MFR albedos. However, at the 10 m tower, the grass is dry and brown as evidenced by the TSI image and the surflog report: “brown”, and the MFR albedos for the 10 m tower show the typical characteristics of bare soil or dead vegetation. These examples show how three
distinct surface types can be identified from the MFR wave-lengths. In the following analysis, we will refer to these three types as vegetated, partially vegetated, and non-vegetated. The non-vegetated cases may consist of soil or of dying or dead vegetation.
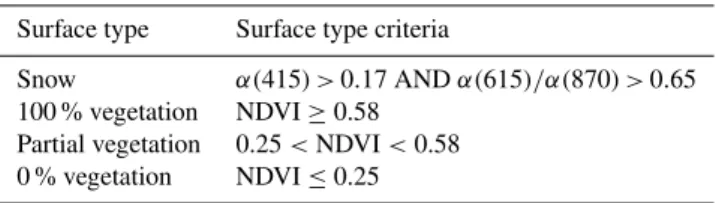
Table 1.Albedo and NDVI thresholds for determining surface type.
Surface type Surface type criteria
Snow α(415) >0.17 ANDα(615)/α(870) >0.65
100 % vegetation NDVI≥0.58
Partial vegetation 0.25<NDVI<0.58
0 % vegetation NDVI≤0.25
data during conditions where scattered snow and ice existed on a surface indicate that the six MFR narrowband measure-ments may not be sufficient to identify snow as it starts melt-ing and the underlymelt-ing surface begins to show. Thus, in use of the MFR data operationally, the extrapolated albedos for several days after an identified snow case should be treated with caution.
To remove the influence of solar zenith angle, we estimate surface type once per day using the average albedo for the two hour period around solar noon. If the surface is not snow-covered, we determine whether it is vegetated, partially vegetated, or non-vegetated. We examined several methods for quantitatively separating vegetated, partially vegetated, and non-vegetated surfaces, and determined that a version of the Normalized Difference Vegetation Index (NDVI) was the most robust indicator of vegetated surfaces. The NDVI is an established indicator used by the remote sensing community to measure the amount of green vegetation in a surface (My-neni et al., 1995) and is based on the fact that green vegeta-tion preferentially absorbs radiavegeta-tion at visible spectral wave-lengths and reflects radiation at near-infrared wavewave-lengths. It is calculated as the ratio of the difference between the near-infrared reflectance (αNIR) and the red reflectance (αRED) to the sum of these same values:
NDVI=(αNIR−αRED)/(αNIR+αRED) (1) For the MFR instruments, we use the 870 nm (channel 5) measurement as theαNIRvalue and the 673 nm (channel 4) measurement as the αRED value. In general, dense vege-tation has a high NDVI, bare soil has low positive values, and water has negative values due to strong NIR absorption (Myneni et al., 1995). Although NDVI is a useful tool for studying vegetation characteristics, the thresholds for deter-mining whether a surface is vegetated or not depend on the details of the surface under consideration, the field of view of the instrument, and the wavelength channels used. Previous studies have shown that NDVI sensitivity decreases at high values, and the maximum NDVI usually occurs near 0.5–0.8 for dense vegetation, but can vary with vegetation type (Carl-son and Ripley, 1997). Similarly, bare soil values can vary considerably with the soil type.
To define thresholds for non-vegetated and 100 % vege-tated surfaces, we visually inspected the MFR narrowband albedos from several years and identified days that could be considered vegetated and non-vegetated. Based on the NDVI
values in these cases, as well as examination of the differ-ences between measured and estimated albedos (discussed further in next section), we obtained the threshold values given in Table 1. We also examined the use of other MFRSR channels, but found that the 673 nm and 870 nm channels gave the best separation.
For partial vegetation cases, we assume that the albedo can be estimated as a weighted average between the spectral albe-dos of fully vegetated and non-vegetated surfaces,
αp=f α100+(1−f )α0, (2)
wheref is the vegetation fraction andαp,α100, andα0are the albedos of the partially vegetated surface, fully vegetated surface, and non-vegetated surface, respectively (Jiang et al., 2006). Several studies (Wittich and Hansing, 1995; Kustas et al., 1993) have indicated a linear relationship between veg-etation fraction and a scaled NDVI value,
f= (NDVI−NDVI0)
(NDVI100−NDVI0), (3)
where NDVI100 and NDVI0are the NDVI threshold values from Table 1 for the fully and non-vegetated surfaces, re-spectively. Other studies found that vegetation fraction was related to the square of the scaled NDVI value.
Direct evaluation of the daily surface type and fractional vegetation are not possible for our dataset as there are no ver-ification datasets. We perform an indirect evaluation of the surface type and percent vegetation estimates by comparing our estimates of extrapolated spectral albedo to field mea-surements of spectral albedo for different surfaces. Results of these comparisons are shown in the next section. Exami-nation of the linear and square relationships between vegeta-tion fracvegeta-tion and scaled NDVI found that the linear relavegeta-tion- relation-ship gave smaller standard deviation between estimated and actual values (not shown) so the linear relationship was used in the remainder of the study.
3.1 Time series of daily surface type
Fig. 4.Time series of daily percent vegetation derived from MFR measurements for (top) 2001–2008 at 10 m tower, (middle) 2001–2004 at 25 m tower, and (bottom) 2005–2008 at 25 m tower. Days with missing data and days classifed as snow are not included in the plots.
methodology, although the actual values of percent vegeta-tion cannot be directly evaluated.
The annual cycle at the 25 m tower is more complicated because it is a managed field and there was a change in crops during the analysis period. Information on the culti-vation practices of the managed field comes from the SGP site operations personnel (Pat Dowell, personal communica-tion, 2011). From 2001 through the spring of 2004, the field under the 25 m MFR was planted in winter wheat, which is typically planted in September/October and harvested in June (USDA). Also during this period, the field was typically tilled two or three times during the summer months after the wheat harvest. The seasonal cycle of the percent vegetation (Fig. 4b), illustrates the impact of these activities. The site shows 100 % vegetation in the colder months (November to May) due to the growth of winter wheat. A minimum in
veg-etation occurs around June in most years due to the harvest. Some years show an increase in vegetation again immedi-ately after the presumed harvest, which is likely due to weeds growing in the fallow fields (as seen in images in the field re-ports). A second dip in vegetation percentage in August and greening up in September in most years is due to the peri-odic tilling and re-growth of weeds, although it may also be impacted by variations in precipitation from year to year. A gradual greening up of the 25 m tower site begins again in fall, when the winter wheat is planted (although this did not happen in the fall of 2004 due to the change in crops).
percent vegetation under the 25 m MFR is quite variable dur-ing 2005–2008 (Fig. 4c) due to the variety of crops planted (corn, wheat, and soybeans), which are planted and harvested at different times of the year. In 2005, corn was planted in the spring and harvested in August, then winter wheat was planted into the corn stubble in the fall. In 2006, the wheat was harvested in late June, soybeans were planted roughly a week later and harvested in November, and wheat was planted again in November. In 2007, which had an extremely wet summer, part of the wheat crop was harvested in July, but the remainder was not harvested until early September, and the field was left fallow the remainder of the year. In 2008, corn was planted in late April and harvested in late Septem-ber and wheat was planted a week later.
In general the surface type retrieval is in agreement with the major activities noted in the field notes. Quite often, the percent vegetation begins to decline from 100 % before the noted date of harvest. This may be due to the fact that broad-leafed herbicides are often sprayed in the fields a few weeks before harvest or due to the tendency for some crops to turn yellow as they are ready to be harvested.
4 Estimation of high spectral resolution surface albedo
Given the limited information available at the MFR wave-lengths, we have to use other information about the typical spectral structure of albedo to extrapolate to high spectral resolution and to wavelengths outside of the MFR measure-ments. Our goal is to produce an estimate of the albedo at high spectral resolution that is representative of the given sur-face type, that matches the MFR albedo values at the avail-able wavelengths, and that reasonably reproduces the broad-band albedo.
Several libraries of observed high spectral resolution albe-dos of various surface types (Bowker, 1985; ASTER, 1999) were used to develop a spectral extrapolation method. Peaks and troughs in the observed spectral albedo values and dif-ferences between vegetated and non-vegetated surfaces were used to identify distinct spectral regions. Separately for vege-tated and non-vegevege-tated surfaces, piecewise continuous func-tions were developed to estimate the albedo across each spec-tral region given the input MFR albedos and the characteris-tics of the spectral libraries. Seven soil types, ranging from very dark grayish brown loam to dark reddish brown fine sandy loam, and over 20 vegetation types including wheat, various grasses, and other crops were composited to derive these functions. Since the MFR measurements only cover the spectral range from 415 to 940 nm, the extrapolation be-yond these wavelengths is expected to be more uncertain.
The surface type and percent vegetation estimate is made once per day, using an average of the MFR data for a two hour period around solar noon. Then, for each MFR sam-ple time the six narrowband albedos are used to scale the function for the appropriate surface type. The functions
pro-duce albedo from 820 to 50 000 cm−1 (0.2 to 12.0 µm) at 10 cm−1 resolution. We provide values down to 820 cm−1 (12.0 µm) for completeness as different solar radiative trans-fer codes have diftrans-ferent longwave cut-offs; values at smaller wavenumbers (longer wavelength) have large uncertainties and are not meant to be used for longwave emissivity. For partially vegetated surfaces, the spectral albedos for vege-tated and non-vegevege-tated surfaces are calculated separately and then weighted appropriately using Eq. (2).
For vegetation, the spectrum is broken into 21 spectral re-gions. As discussed in Bowker et al. (1985), different factors control reflectance in the different spectral regions. Below 700 nm, the reflectance is controlled primarily by absorption by leaf pigments (such as chlorophyll). A sharp increase in albedo occurs around 700 nm, and between 700–1300 nm reflectance is dominated by leaf cellular structure. Beyond 1300 nm, reflectance is primarily controlled by leaf water content. Troughs in albedo due to water absorption bands occur near 1400 and 1950 nm and weaker water absorption features are seen at 980 and 1240 nm. The strength of these water absorption features in observed vegetative surfaces de-pends on the leaf water content and can vary both by plant type and by environmental conditions.
For non-vegetated surfaces, 24 spectral regions are used in the estimation. In this study, the non-vegetated surfaces are modeled like the “Type 2” soil surfaces discussed in Bowker et al. (1985), which have a roughly linear slope to 600 nm, and then a slightly convex shape from the visible re-gion to 1400 nm. The water absorption bands at 1400 and 1950 nm are sharper than in the vegetated surfaces, how-ever the strength of these absorption features depends on soil moisture. The non-vegetated surfaces are also assumed to have an absorption band at 2200 nm. This is associated with OH absorption and is often seen in soils (particularly clay soil) but may not be present in dead (yellow) vegetation (Bowker et al., 1985).
4.1 Evaluation of estimated spectral albedo
The ASD and GER high resolution spectral measurements were used to evaluate the albedo estimation method. For each measurement, the values closest to the MFR wavelengths were extracted and input to the surface type and albedo ex-trapolation algorithms, and then the estimated albedo was compared to the measurements. The measurements and field reports were used to identify cases of non-vegetated surfaces (bare soil, dry wheat, wheat stubble, and some grass/pasture cases in February), 100 % green vegetated surfaces (grass, soybeans, milo, wheat, and alfalfa), and partially vegetated surfaces (grass, wheat, corn stubble) for evaluation of the methodology.
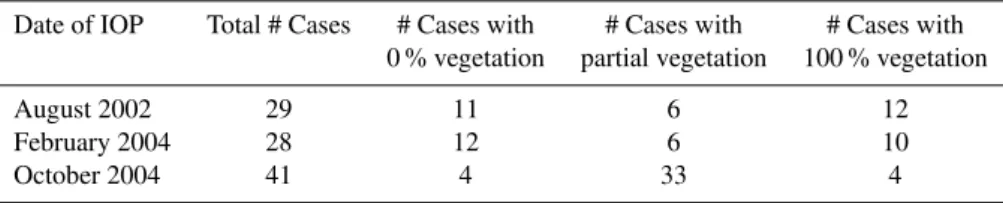
Table 2. Number of cases of each surface type (as identified from current methodology) measured with spectroradiometer for each IOP period.
Date of IOP Total # Cases # Cases with # Cases with # Cases with
0 % vegetation partial vegetation 100 % vegetation
August 2002 29 11 6 12
February 2004 28 12 6 10
October 2004 41 4 33 4
(3◦
, 10◦
or 180◦
) or on consecutive days. Each of these is treated as a separate measurement.
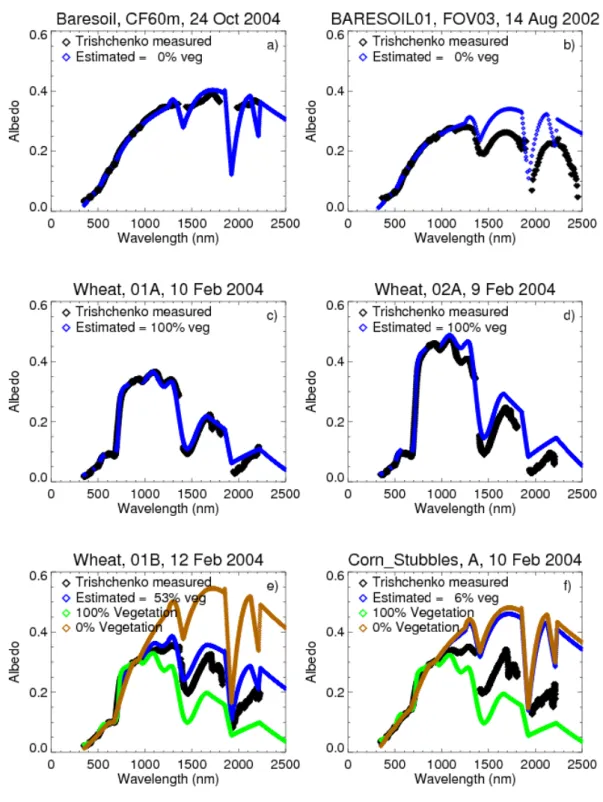
Some examples of measured and extrapolated spectral albedos are presented for each of the three surface types in Fig. 5 and are discussed below. The panels in the left-hand column are examples of cases where the surface type (includ-ing percent vegetation) and albedo extrapolation methodol-ogy appeared to work well, whereas the panels in the right-hand column show examples of cases where either the per-cent vegetation estimation was incorrect or the spectral ex-trapolation was not a good match to the measurements. 4.1.1 Non-vegetated surfaces
Two cases of bare, plowed soil near the SGP central facility are examined. The first (Fig. 5a) is a field near the 25 m tower observed on 24 October 2004 under clear skies. In this case, the general shape of the spectral curve and the magnitude of the albedo are well-matched. However, there is a suggestion that the extrapolated albedo over-estimates the sharpness of the water absorption features at 1400 and 1950 nm relative to the measured albedo. In the second bare soil case (Fig. 5b), observed in the central facility area on 14 August 2002, the shape of the curve is again well matched up to 1900 nm, and the extrapolation captures the magnitude of the albedo be-tween 400 and 1300 nm. Beyond 1300 nm, the extrapolation overestimates the magnitude of the albedo. The difference in the magnitude of the albedo beyond 1300 nm in the esti-mate and observation may be due to the effects of soil mois-ture; wet soil has lower reflectance in the visible and near-IR (Lobell and Asner, 2002). Examination of the surface meteorological data at the SGP shows precipitation>15 mm on both 12 and 13 August 2002 while less than 0.5 mm is recorded in the several days preceding the 24 October 2004 case.
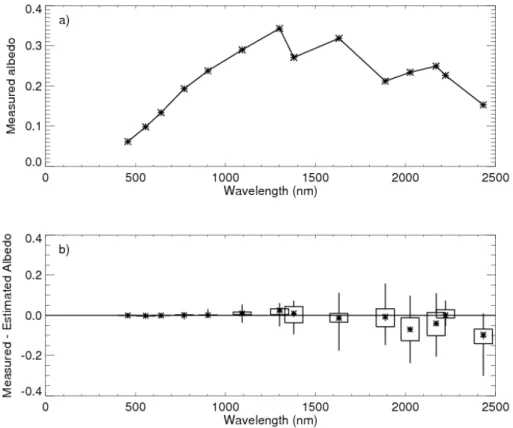
To assess the spectral extrapolation methodology across various spectral regions, we also look at the statistics of the differences between the measured and extrapolated albedos in each of the spectral regions used in the algorithm. Fig-ure 6 shows the average measFig-ured albedo and a box-whisker diagram of the albedo differences (measured-estimated) in each spectral region up to 2500 nm based on all 27 of the non-vegetated cases. In the box-whisker diagram, + marks the mean difference in the spectral bin, x marks the median difference, the boxes give the 25th and 75th percentile
val-ues, and the whiskers give the minimum/maximum values. In general, the means and medians are quite close and not distinguishable from each other in the plots. Standard devia-tions in each spectral region are also calculated, although not shown. For these comparisons, the spectral albedo for each case is estimated at the same wavelength resolution as the measured albedo, so multiple residuals are included within a given spectral region for each IOP surface measurement.
Generally, the estimated albedos for the non-vegetated cases have small errors (mean error <7 %) and variabil-ity (standard deviation <8 %) in spectral regions less than 1350 nm. Mean errors are still less than 7 % in the 1350 to 1920 nm region, but the standard deviation increases to 11– 30 %. For spectral regions beyond 1920 nm, the mean er-rors are significant (>16 %) and the estimated albedo tends to overestimate the observed value. One reason for the large variability and mean error at the longer wavelengths is that the strength and locations of the estimated absorption fea-tures are not always a good match to the observations. In particular, the OH absorption band at 2200 nm, which is one of the boundaries of the estimated spectral regions, is not really seen in the observations and the observations have a more curved shape in the 2200–2600 region than the esti-mated albedos (e.g., Fig. 5b). In future work, the estiesti-mated albedo methodology might be adapted to include information on soil moisture, which is available from the SGP central fa-cility site beginning in December, 2002.
4.1.2 Vegetated surfaces
Fig. 6. Evaluation of methodology for all non-vegetated cases during IOP.(a)Average measured albedo within each spectral region and
(b)box-whisker diagram showing differences between measured and estimated albedo in each spectral region.
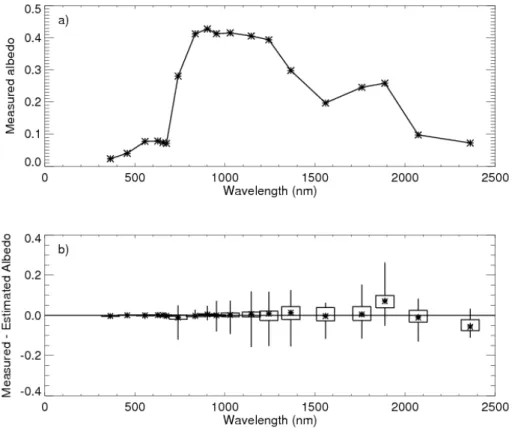
Examination of the statistics of the 26 cases with 100 % vegetation (Fig. 7) shows that there is good agreement, with little bias, between the estimated and measured albedo values up to 1850 nm. For the 1850–1920 nm region, the method tends to overestimate the measured albedo and for the 2220– 2500 region, it tends to underestimate the albedo. All spec-tral regions have the occasional outlier (large min/max val-ues), but mean differences are less than 5 % and relative stan-dard deviation is less than 11 % for regions between 613– 1280 nm. The first spectral bin (313–415 nm) is biased high by 16 % and has a high relative standard deviation (12.6 %), but the albedo values are very low in this region. The 500– 613 nm region also has a large bias (19 % underestimation) and relative standard deviation (16 %). Examination of indi-vidual cases shows that the albedo estimation methodology tends to underestimate the peak albedo in this region (which occurs around 550 nm) for some of the vegetation cases, al-though it matches well for others. To improve the albedo estimation in this region, an additional MFR measurement at 550 nm would be useful.
The estimated albedo methodology produces sharp changes in slope at 1923 nm and 2232 nm. In some of the observed 100 % vegetation cases, the measured albedos tend to mirror these slope changes, in other cases the observations in this region are quite noisy. The vegetation cases show the general feature of a plateau in the near-infrared between 700
and 1400 nm associated with leaf cellular structure and wa-ter absorption bands cenwa-tered at 980 and 1240 nm. The ex-act magnitude of the peaks between 700–1400 nm depend on the characteristics of the vegetation, including cell diameter, number of air/cell interfaces, and leaf water content (Daw-son et al., 1998). These characteristics may vary between vegetation types and within the same vegetation type over the growing season. In the extrapolated albedo methodol-ogy, these peaks all have approximately the same magnitude, which also occurred in the observed wheat and grass cases. However in some of the other vegetation cases the 3rd peak was lower in magnitude than the first peak (soybean and milo cases). Examples of spectral albedo from other measurement campaigns (e.g., Liang et al., 2002) indicate that the behavior of vegetation in the 700–1400 nm region can vary consider-ably. The MFR has two measurements (at 873 and 940 nm) that constrain the magnitude of the first peak; having addi-tional measurements (at 1100 and 1300 nm) would help con-strain the magnitude of the other two peaks.
4.1.3 Partially vegetated surfaces
100 % vegetation are also shown. Clearly, the partial vegeta-tion estimate is a better fit than either the 0 % or 100 % veg-etation estimates. The magnitude of the albedo is fairly well matched up to 1400 nm, but then the estimated albedo has a weaker absorption feature at 1400 nm and overestimates the albedo beyond 1400 nm. The shape of the estimated albedo is also not a very good match beyond 1900 nm. In the second case (Fig. 5f), corn stubble observed on 10 February 2004, a percent vegetation of 6 % is retrieved, which appears to be too low when examining the observed spectral albedo. Since the percent vegetation is so low, the shape of the estimated albedo is dominated by the 0 % vegetation curve and is also not a good match.
The 45 partial vegetation cases (Fig. 8) show good agree-ment between 415 and 1280 nm, with mean differences<7 % and relative standard deviation <8 %, but tend to overes-timate the measured albedo for wavelengths greater than 1280 nm, except in the band at 1852–1923 nm where the mean difference is<2 % although the variability is signifi-cant. The overestimate at longer wavelengths may be due an underestimate of the percent vegetation (as seen in Fig. 5f) as soil tends to have higher albedo beyond 1200 nm than vege-tated surfaces do. An MFR measurement beyond 1200 nm could help constrain the percent vegetation and the albedo values at these longer wavelengths.
4.2 Comparison to broadband albedo measurements
As a further evaluation of the albedo estimation methodol-ogy, we examine differences between the broadband albedo calculated from integrating the high spectral resolution albedo and that measured by the broadband PSP instruments. Given a specification of spectral surface albedo values such as described in the previous section, a corresponding broad-band albedoαBBcan be defined by
αBB=
R
αλSλdλ R
Sλdλ
(4) whereαλare the spectral albedo values andSλare the spec-tral downwelling solar irradiances at the surface. TheSλ val-ues serve as weights for the integration of the spectral albedo values, indicating that the same surface will have different broadband albedos should the atmospheric conditions result in different relative spectral distributions of solar irradiance reaching the surface. The spectral downwelling irradiance at the surface differs from the incoming spectral irradiance spectrum at the top of the atmosphere due to spectrally de-pendent absorption and scattering of solar radiation in the at-mosphere. Among the atmospheric properties that can have an important impact on the relative attenuation of solar radia-tion are the amount of water vapor (the greatest source of ab-sorption) and scattering by aerosols, clouds, and molecules. In addition, a change in solar zenith angle may result in a modified spectral distribution of surface solar irradiance even if the atmospheric properties are unchanged.
There are no appropriate spectral measurements of sur-face solar irradiance,Sλ, at SGP, and radiative transfer cal-culations ofSλfor each case would be computationally pro-hibitive. Instead, we apply Eq. (4) utilizing Sλ values ob-tained from a high-resolution radiative transfer calculation for a single case associated with atmospheric conditions typ-ical for SGP. In particular, we use a calculation by the Line-by-Line Radiative Transfer Model (LBLRTM) and Code for High resolution Accelerated Radiative Transfer and Scat-tering (CHARTS) (Clough et al., 2005) for 4 May 2000, 15:48 UT, at SGP. This case, which was utilized for a recent radiation code intercomparison (Oreopoulos and Mlawer, 2010), corresponds to clear-sky conditions with a solar zenith angle of 40.6 and water vapor column amount and aerosol optical depths typical for the site. This ensures that the relative spectral distribution of calculated surface irradiance will be reasonably typical, providing some universality to the shape of the spectrum used in the weighting.
We examine the difference between the integrated albedo and measured broadband albedo from the PSPs at each tower for near-noon values for each day between 2003–2008 for which a valid surface type and valid PSP measurements exist (Fig. 9 and Table 3). The albedo values calculated from mea-sured irradiance values, calculated from estimated irradiance values, and estimated from near-noon albedo values are plot-ted separately. In general, the agreement between the inte-grated and measured broadband albedos is good, with mean and median residuals less than 0.01 and standard deviation less than 0.015 for both towers (Table 3). There is some de-pendence on vegetation type, with 100 % vegetation having the smallest mean residuals at both towers, but the largest standard deviation at the 10 m tower. At the 10 m tower, the integrated values slightly underestimates the PSP broadband albedo, while the opposite is true at the 25 m tower.
Several outliers are obvious in both the 10 m and 25 m cases. We first examined whether the outliers were caused by cases where the MFR narrowband albedos were estimated due to missing irradiance or albedo values (purple and or-ange points in Fig. 9). These estimated points do have larger standard deviation than the non-estimated points, but similar means (“Estimated” points in Table 3), and they do not ac-count for all of the large outliers. Further analysis of the individual points with residuals greater than 0.1 indicated that they were all due to problems with the input data sets that were not caught during the initial quality control checks. Cases with residuals between 0.05 and 0.1 were typically as-sociated with either bad input data, cases of broken clouds (where rapid changes in direct irradiance and the spatial sep-aration of the downwelling and upwelling instruments can cause noise in the albedo values), or cases with broadband downwelling irradiance<200 Wm−2.
Fig. 7.Evaluation of methodology for all 100 % vegetation cases during IOP.(a)Average measured albedo within each spectral region and
(b)box-whisker diagram showing differences between measured and estimated albedo in each spectral region.
Fig. 8.Evaluation of methodology for all partially vegetated cases during IOP.(a)Average measured albedo within each spectral region and
Table 3. Mean, median, and standard deviation of differences be-tween broadband albedo values calculated from integrating spectral albedo or measured from the PSPs.
10 m near-noon residuals (Integrated – PSP)
Type # points mean median standard dev
All points 2159 −0.0074 −0.0082 0.0136
100 % veg 510 −0.0010 −0.0100 0.0177
Partial veg 851 −0.0058 −0.0080 0.0115
0 % veg 655 −0.0089 −0.0010 0.0130
Estimated 192 −0.0078 −0.0080 0.0194
25 m near-noon residuals (Integrated – PSP)
Type # points mean median standard dev
All points 2159 0.0066 0.0063 0.0148
100 % veg 543 0.0042 0.0039 0.0138
Partial veg 1099 0.0088 0.0089 0.0144
0 % veg 282 0.0084 0.0113 0.0207
Estimated 195 0.044 0.0063 0.0242
is not appropriate. In the final albedo dataset, times with broadband residuals greater than 0.05 but less than 0.1 are flagged as indeterminate and times with broadband residuals equal to or greater than 0.1 are flagged as bad.
4.3 Effects of cloud cover and solar zenith angle
Although the intrinsic albedo of the surface does not change with cloud cover, the measured albedo may be different under clear sky and cloudy conditions because spectrally-varying absorption and scattering of radiation by clouds may change the percentage of radiation incident on the surface in each spectral region relative to the clear sky insolation (Liang et al., 1999). Additionally, cloud cover affects the average angle of solar insolation on the surface. Under clear skies, the solar insolation at the surface is from a narrow range of angles (direct radiation) while under cloudy conditions solar insolation at the surface is diffuse (radiation incident on the surface from multiple angles). Since most natural surfaces do not scatter isotropically, cloud cover changes the angu-lar weighting of the surface reflectance relative to that under clear skies. In the current work, no correction for cloud cover has been implemented.
To evaluate the effect of cloud cover on the spectral albedo estimates, we examine our multi-year record of estimated albedos in concert with a hemispheric cloud fraction dataset determined from broadband radiometer measurements (Long and Ackerman, 2000). A comparison between the integrated spectral albedo and the measured broadband albedo for all of the 1 min retrievals from 2004–2008 (close to a million points for each tower) shows no clear dependence on cloud cover (Fig. 10). The scatter appears wider at 0 % and 100 %
cloud fraction primarily because of the much larger number of points that are completely clear or completely overcast. Note that for Figs. 10 and 11, we use the final albedo dataset, in which points with residuals having magnitudes greater than 0.1 have been removed.
To further examine the role of cloud fraction, we break the cloud fraction down into 11 bins, each with width of 0.1, and examine the residuals in each bin (Fig. 10). The first bin is centered on a cloud fraction of zero and the last bin centered on cloud fraction of one. Approximately 27 % of the data is in the first cloud fraction bin and 28 % in the last cloud fraction bin with the other bins each containing between 3.2 and 8.1 % of the data. For all cloud fraction bins, the me-dian residual and the values of the 25th and 75th quartiles are very similar, although the minimum and maximum values of the residual vary somewhat with cloud fraction. The albedo values calculated from estimated irradiances show more vari-ability with cloud fraction, with slightly larger mean residu-als for overcast clouds than for other cloud conditions. De-spite the potential effect of clouds on surface albedo condi-tions discussed above, we find little dependence of the resid-uals on cloud fraction. Possible reasons for the lack of de-pendence on cloud cover are that both the narrowband MFR albedos and the broadband PSP albedos are measured under the same cloudiness conditions or that the effects of cloud cover may be smaller than other sources of error in the com-parison of the integrated and measured albedos.
Surface albedo is dependent on solar zenith angle during non-overcast conditions, because of the contribution of the direct solar beam (Liang, 2000). However, since we are es-timating the spectral albedo for the same solar zenith angles at which the MFR albedo measurements are taken, the blend of direct and diffuse radiation at that instant is taken into ac-count and we do not expect significant errors in the extrapo-lated albedo due to solar zenith angle dependence. To exam-ine the effect of solar zenith angle on the estimated spectral albedo, we again compare the integrated spectral albedo to the measured broadband albedo (Fig. 11) as a function of µ0. Here we splitµ0into 8 bins between 0.20 and 1.0 with bin width of 0.10. (For consistency with the cloud fraction dataset, which does not have values forµ0<0.2 we only in-clude points withµ0>0.2 in this analysis). We see only a slight dependence on solar zenith angle, with larger variabil-ity for cases of lower sun angles near sunrise and sunset. We note that the first bin (low sun angles) has only 6.7 % of the data and has the largest variability while the other bins each contain between 10.2 to 16.0 % of the data.
Fig. 9.Comparison of integrated spectral albedo to measured broadband albedo near noon for (top) 10 m tower measurements and (bottom) 25 m tower measurements. Surface type and mean, median, standard deviations of differences (measured-integrated) are given in the plots. Points for which irradiance values (orange) or albedo values (purple) are estimated are also indicated.
for the BEFlux algorithm to identify the bad instrument, and it appears that some bad data may not have been flagged in this case.
5 Impact of spectrally resolved surface albedo
To illustrate the impact of employing a spectral specifica-tion of surface albedo instead of a broadband value for clear-sky solar irradiance calculations, we perform two spectrally-detailed solar radiative transfer calculations (Fig. 12). Ra-diative transfer calculations using the LBLRTM/CHARTS model were performed for conditions corresponding to those observed in the afternoon of 4 May 2000, at the SGP site. This is the same case used for the spectral integration in Part 4. First, a line-by-line radiative transfer calculation using the spectral surface albedo for 100 % vegetation (panel a) was performed (black curves in panels b and d). The spectral albedo was then integrated to obtain a broadband albedo and this spectrally constant broadband value was used in a sec-ond line-by-line radiative transfer calculation (red curves in
panel b and d) while all other inputs to the model were the same as in the first calculation. By construction, the two cal-culations produced the same spectrally integrated upwelling irradiance at the surface due to the identical broadband sur-face albedo values employed, although the two correspond-ing spectral distributions of upwellcorrespond-ing irradiance differed sig-nificantly (not shown).
Fig. 10. Broadband albedo residual (integrated spectral minus measured PSP albedo) as a function of cloud fraction for the period 2004– 2008. Residuals are plotted separately for points for which albedo is directly measured (black and blue symbols), albedo is estimated due to missing or bad values (purple and orange) and albedo is calculated from estimated irradiances (brown and green). Panels show(a)10 m and 25 m individual values,(b)box-whisker plot for 10 m values, and(c)box-whisker plot for 25 m values.
then is back-scattered to the ground by Rayleigh scattering. This decrease in diffuse radiation is not fully compensated for by increases in diffuse radiation in other spectral regions where the surface albedo is relatively high, resulting in a net 6.6 Wm−2decrease in the integrated downwelling irradiance computed using the spectral albedo. From this analysis, it is clear that the use of a spectrally constant surface albedo was an important factor in past studies (e.g., Halthore et al., 2005) that concluded that radiative transfer models overesti-mated diffuse irradiance for clear sky conditions, in contrast to those studies that used a spectrally varying surface albedo and found no such discrepancy (e.g., Michalsky et al., 2006).
6 Discussion and conclusions
Fig. 11.As in Fig. 10, but residuals are plotted as a function of the cosine of the solar zenith angle.
each surface type given the input MFR narrowband albedos. For partially vegetated surfaces, the albedo was estimated as a linear combination of the green vegetation and non-vegetated surface albedo values. The final dataset, named sgpsurfspecalb1mlawerC1, includes the daily surface type and the quality-controlled MFR and MFRSR narrowband ir-radiances and albedos, estimated spectral albedo, integrated broadband albedos and various quality control flags at 1-min resolution. It is freely available from the ARM archive (www.archive.arm.gov).
The estimated spectral albedos were evaluated by compar-ison to measurements from four intensive observation peri-ods undertaken at the SGP site. The estimated albedo val-ues were in reasonably good agreement (mean differences <7 % and relative standard deviation<11 %) for all surface
Fig. 12.Results of calculations using LBLRTM/CHARTS with spectrally varying and fixed albedo for the 4 May 2000 case. Panels show
An additional measurement at a near-IR wavelength would be useful in improving the albedo extrapolation beyond 1000 nm, particularly for vegetated and partially vegetated cases. A 1600 nm channel has recently been added to sev-eral MFR heads at the SGP central facility and the data is currently being analyzed. In future work, we will expand the albedo estimation algorithm to allow input of a 1600 nm mea-surement, examine how that improves the spectral estimation at longer wavelengths, and apply the updated algorithm to the new MFR measurements.
As an additional evaluation, the spectral albedos were in-tegrated across the solar spectrum and compared to measured broadband albedos from the measurement towers at the SGP site over several years. For both towers, the agreement be-tween integrated and measured broadband albedo was good, with mean residuals less than 0.01 and standard deviation less than 0.015. Analysis of the residuals as a function of cloud fraction and solar zenith angle found a small depen-dence on solar zenith angle, with larger variability at lower solar elevations, but no dependence on cloud fraction.
For cloudy sky radiative transfer calculations, the influ-ence of the albedo of the surrounding area should also be taken into consideration. Surface heterogeneity can have a significant impact on the local radiation field, with the area of influence depending on the cloud height (Pirazzini and Raisa-nen, 2008; Li et al., 2002). In this initial study, we only pro-duce time series of spectrally resolved albedo that are charac-teristic of the local conditions under each tower. However, by comparing the albedo products derived from the two towers, we can determine periods when the surface heterogeneity (on a 300-m scale) is relatively low. In the next step of product development, we will investigate using cloud height from the ACRF measurements and land-cover or satellite information to combine with the local-scale albedos to produce an areal-average albedo.
Albedo spectral libraries tend to represent fairly homoge-neous surfaces. Due to the small scale nature of the mea-surements represented in such libraries, they do not cap-ture the effects of surface struccap-ture (such as mixed vege-tation heights, gaps in vegevege-tation, etc.) on the anisotropy of the reflectance field, which affects the overall albedo. Thus, when using the tower measurements to characterize the albedo of the larger spatial area, information on the bidirectional reflectance function at “landscape-level” scales (90 m) from aircraft measurements should also be included (Rom´an et al., 2011).
The radiative transfer calculation performed in Sect. 5 showed the importance of using a reasonable specification of the spectrally resolved surface albedo for radiative trans-fer calculations. The spectral albedos calculated using the methodology described in this paper will be used as input to the ARM Broadband Heating Rate Profiles (BBHRP) and Shortwave Quality Measurement Experiment (SW QME) projects, which compare calculated and measured radiative irradiances to assess our understanding of the various
as-pects involved in calculating radiative irradiances. In the current work, the effect of large-scale spatial heterogeneity on the estimated albedo was not considered, and no correc-tion for cloud cover was implemented. As part of the radia-tive transfer modeling associated with the BBHRP and SW QME projects, the impact of neglecting these factors will be investigated.
Acknowledgements. We thank Alice Cialella for creating and annotating the map of the SGP site. This work was supported by the Department of Energy’s Office of Biological and Environ-mental Research (OBER) as part of the Atmospheric Radiation Measurement (ARM) Program.
Edited by: M. Weber
References
Baldridge, A. M., Hook, S. J., Grove, C. I., and Rivera, G.: The ASTER Spectral Library Version 2.0, Remote Sens. Environ., 711–715, 1999.
Bowker, D. E., Davis, R. E., Myrick, D. L., Stacy, K., and Jones, W. T.: Spectral reflectances of natural targets for use in remote sensing, Tech. rep., NASA Ref Pub., 1139, 1985.
Carlson, T. N. and Ripley, D. A.: On the relation between NDVI, fractional vegetation cover, and leaf area index, Remote Sens. Environ., 62, 241–252, 1997.
Clough, S. A., Shephard, M. W., Mlawer, E. J., Delamere, J. S., Iacono, M. J., Cady-Pereira, K., Boukabara, S., and Brown, P. D.: Atmospheric radiative transfer modeling: a summary of the AER codes, J. Quant. Spectosc. Radiat. Transfer, 91, 233–244, 2005. Dawson, T. P., Curran, P. J., and Plummer, S. E.: LIBERTY –
Mod-eling the effects of leaf biochemical concentration on reflectance spectra, Remote Sens. Environ., 65, 50–60, 1998.
Flynn, D. M. and Hodges, G.: Multi-filter Rotating Shadowband Radiometer handbook, Tech. rep., United States Department of Energy, DOE/SC-ARM/TR-059, 2005.
Gardener, A. S. and Sharp, M. J.: A review of snow and ice albedo and the development of a new physically based broad-band albedo parameterization, J. Geophys. Res., 115, F01009, doi:10.1029/2009JF001444, 2010.
Halthore, R. N. and Schwartz, S.: Comparison of model-estimated and measured diffuse downward irradiance at surface in cloud-free skies, J. Geophys. Res., 105, 20165–21077, 2000.
Halthore, R. N., Crisp, D., Schwartz, S. E., Anderson, G. P., Berk, A., Bonnel, B., Boucher, O., Chang, F.-L., Chou, M.-D., Cloth-iaux, E. E., Dubuisson, P., Fomin, B., Fouquart, Y., Freidenre-ich, S., Gautier, C., Kato, S., Laszlo, I., Li, Z., Mather, J. H., Plana-Fattori, A., Ramaswamy, V., Ricchiazzi, P., Shiren, Y., Tr-ishchenko, A., and Wiscombe, W.: Intercomparison of shortwave radiative transfer codes and measurements, J. Geophys. Res., 110, D11206, doi:10.1029/2004JD005293, 2005.
Henderson-Sellers, A. and Wilson, M. F.: Surface albedo data for climatic modeling, Rev. Geophys., 21, 1743–1778, 1983. Jiang, Z., Huete, A. R., Chen, J., Chen, Y., Li, J., Yan, G., and
Kustas, W. P., Schumugge, T. J., Jumes, K. S., Jackson, T. H., Parry, R., and Weltz, M. A.: Relationships between evaporative fraction and remotely sensed vegetation index and microwave brightness temperature for semiarid rangelands, J. Appl. Met., 32, 1781– 1790, 1993.
Li, Z., Cribb, M. C., and Trishchenko, A. P.: Impact of surface inho-mogeneity on solar radiative transfer under overcast conditions, J. Geophys. Res., 116, 4294, doi:10.1029/2001JD000976, 2002. Liang, S.: Narrowband to broadband conversions of land surface albedo: 1. Algorithms, Remote Sens. Environ., 76, 213–238, 2000.
Liang, S., Stahler, A., and Walthall, C.: Retrieval of land surface albedo from satellite observations: A simulation study, J. Appl. Meteorol., 38, 712–725, 1999.
Liang, S., Fang, H., Chen, M., Shuey, C. J., Walthall, C., Daugh-try, C., MOrisette, J., Schaaf, C., and Strahler, A.: Validating MODIS land surface reflectance and albedo products: methods and preliminary results, Remote Sens. Environ., 83, 149–162, 2002.
Lobell, D. B. and Asner, G. P.: Moisture effects on soil reflectance, Soil Sci. Soc. Am. J., 66, 722–727, 2002.
Long, C. N. and Ackerman, T. P.: Identification of clear skies from broadband pyranometer measurements and calculation of down-welling shortwave cloud effects, J. Geophys. Res., 105, 15609– 15626, 2000.
McFarlane, S. A. and Evans, K. F.: Clouds and shortwave fluxes at Nauru. Part I: retrieved cloud properties, J. Atmos. Sci., 61, 733–744, 2004.
McFarlane, S., Gaustad, K., Long, C., and Mlawer, E.: ARM Cli-mate Research Facility Spectral Surface Albedo Value-Added Product (VAP) Report, DOE/SC-ARM/TR-096, 2011.
Michalsky, J., Min, Q., Barnard, J., Marchand, R., and Pilewski,
P.: Simultaneous spectral albedo measurements near the
Atmospheric Radiation Measurement Southern Great Plains (ARM SGP) central facility, J. Geophys. Res., 108, D4254, doi:10.1029/2002JD002906, 2003.
Michalsky, J., Anderson, G. P., Barnard, J., Delamere, J., Guey-nard, C., Kato, S., Kiedron, P., McComiskey, A., and Ricchi-azzi, P.: Shortwave radiative closure studies for clear skies dur-ing the Atmospheric Radiation Measurement 2003 Aerosol In-tensive Observation Period, J. Geophys. Res., 111, D14S90, doi:10.1029/2005JD006341, 2006.
Mlawer, E. J., Brown, P. D., Clough, S. A., Harrison, L. C., Michal-sky, J. J., Kiedron, P. W., and Shippert, T.: Comparison of spec-tral direct and diffuse solar irradiance measurements and calcu-lations for cloud-free conditions, Geophys. Res. Lett., 27, 2653– 2656, 2000.
Myneni, R. B., Hall, F. G., Sellers, P. J., and Marshak, A. L.: The interpretation of spectral vegetation indexes, IEEE T. Geosci. Re-mote Sens., 33(2), 481–486, 1995.
Oreopoulos, L. and Mlawer, E.: The Continual Intercomparison of Radiation Codes (CIRC), B. Am. Meteorol. Soc., 91, 305–310, doi:10.1175/2009BAMS2732.1, 2010.
Pirazzini, R. and Raisanen, P.: A method to account for surface albedo heterogeneity in single-column radiative transfrer calcula-tions under overcast condicalcula-tions, J. Geophys. Res., 113, D20109, doi:10.1029/2008JD009815, 2008.
Rom´an, M. O., Gatebe, C. K., Schaaf, C. B., Poudyal, R., Wang, Z., and King, M. D.: Variability in surface BRDF at different spatial scales (30 m–500 m) over a mixed agricultural landscape as retrieved from airborne and satellite spectral measurements, Remote Sens. Environ., 115, 2184–2203, 2011.
Schaaf, C. B., Gao, F., Strahler, A. H., Lucht, W., Li, X. W., Tsang, T., Strugnell, N., Zhang, X. Y., Jin, Y. F., Muller, J. P., Barnsley, M., Hobson, P., Disney, M., Roberts, G., Dunderdale, M., Doll, C., D’Entremont, R. P., Hu, B. X., Liang, S. L., and Privette, J. L.: First operational BRDF, albedo and nadir reflectance prod-ucts from MODIS, Remote Sens. Environ., 83, 135–148, 2002. Shi, Y. and Long, C. N.: Best estimate radiation flux Value Added
Product: Operational details and explanations, Tech. rep., US Department of Energy, DOE/SC-ARM/TR-008, 2002.
Trishchenko, A. P., Luo, Y., Cribb, M., Li, Z., and Hamm, K.: “Surface spectral albedo intensive operational period at the ARM SGP site in August 2002: Results, analysis, and future plans.”, in: Proceedings of the Thirteenth Atmospheric Radiation Measure-ment (ARM) Program Science Team Meeting, US DepartMeasure-ment of Energy, Richland, Washington, 2003.
Trishchenko, A. P., Luo, Y., Khlopenkov, K., and Jeong, M.
J.: Field Report 3rd Surface Albedo IOP Southern Great
Plains (SGP) Cart Site February 8–12, 2004, available at: http://iop.archive.arm.gov/arm-iop-file/2004/sgp/sfcalb-fall/ trishchenko-asd/Report SurfaceAlbedoIOP October2004.pdf, 2004a.
Trishchenko, A. P., Luo, Y., Khlopenkov, K., and Cribb, M.: Field Report 4th Surface Albedo IOP Southern Great Plains (SGP) Cart Site October 20–26, 2004, available at: http://iop.archive.arm.gov/arm-iop-file/2004/sgp/sfcalb-winter/ trishchenko-asd/Trishchenko SrfAlbedo Feb2004 Report.pdf, 2004b.
Turner, D. D., Tobin, D., Clough, S. A., Brown, P. D., Ellingson, R. G., Mlawer, E. J., Knuteson, R. O., Revercomb, H. E., Ship-pert, T. R., Smith, W. L., and Shephard, M. W.: The QME AER-ILBLRTM: A closure experiment for downwelling high spectral resolution infrared radiance, J. Atmos. Sci., 61(22), 2657–2675, 2004.
USDA: Usual planting and harvesting dates for U.S. field crops, United States Department of Agriculture, 1997.