AMTD
6, 6613–6643, 2013High spectral resolution ozone absorption – Part 2
A. Serdyuchenko et al.
Title Page
Abstract Introduction
Conclusions References
Tables Figures
◭ ◮
◭ ◮
Back Close
Full Screen / Esc
Printer-friendly Version
Interactive Discussion
Discussion
P
a
per
|
D
iscussion
P
a
per
|
Discussion
P
a
per
|
Discuss
ion
P
a
per
|
Atmos. Meas. Tech. Discuss., 6, 6613–6643, 2013 www.atmos-meas-tech-discuss.net/6/6613/2013/ doi:10.5194/amtd-6-6613-2013
© Author(s) 2013. CC Attribution 3.0 License.
Atmospheric Measurement
Techniques
Open Access
Discussions
Geoscientiic Geoscientiic
Geoscientiic Geoscientiic
This discussion paper is/has been under review for the journal Atmospheric Measurement Techniques (AMT). Please refer to the corresponding final paper in AMT if available.
High spectral resolution ozone absorption
cross-sections – Part 2: Temperature
dependence
A. Serdyuchenko, V. Gorshelev, M. Weber, W. Chehade, and J. P. Burrows
Institute of Environmental Physics, Bremen University, Bremen, Germany
Received: 12 May 2013 – Accepted: 12 June 2013 – Published: 19 July 2013
Correspondence to: A. Serdyuchenko ([email protected])
AMTD
6, 6613–6643, 2013High spectral resolution ozone absorption – Part 2
A. Serdyuchenko et al.
Title Page
Abstract Introduction
Conclusions References
Tables Figures
◭ ◮
◭ ◮
Back Close
Full Screen / Esc
Printer-friendly Version
Interactive Discussion
Discussion
P
a
per
|
D
iscussion
P
a
per
|
Discussion
P
a
per
|
Discuss
ion
P
a
per
|
Abstract
We report on the temperature dependence of ozone absorption cross-sections mea-sured in our laboratory in the spectral range 213–1100 nm with a spectral resolution of 0.02–0.24 nm (Full Width Half Maximum, FWHM) in the atmospherically relevant temperature range from 193 to 293 K. The temperature dependence of ozone
absorp-5
tion cross-sections was established using measurements at eleven temperatures. The methodology of the absolute broadband measurements, experimental procedures and spectra processing were described in our companion paper together with the associ-ated error budget. In this paper, we report in detail on our data below room temperature and compare them with literature data using direct comparisons as well as the
stan-10
dard approach using a quadratic polynomial in temperature fitted to the cross-section data.
1 Introduction
Accurate information on the temperature dependence of the absorption cross-sections is vital for the retrievals of ozone profiles and columns from UV and visible spectra
15
measured by modern remote sensing instruments. The origin of the temperature de-pendence of the ozone absorption cross section arises from changes in the popula-tion distribupopula-tion in the rotapopula-tional vibrapopula-tional states of the ground electronic state. The features and structure of the ozone absorption spectra and their changes with temper-ature were subject of extensive studies, mainly stimulated by ozone remote sensing
20
applications (Barnes and Mauersberger, 1987; Brion et al., 1993; Bogumil et al., 2003; Burkholder and Talukdar, 1994; Burrows et al., 1999; Malicet et al., 1989, 1995; Paur and Bass, 1984; Voigt et al., 2001). The Hartley absorption band in the ultraviolet (UV) comprises of a very broad continuum with series of narrow peaks superimposed near the absorption maximum. At the maximum of the Hartley band around 254 nm, the
tem-25
Mauers-AMTD
6, 6613–6643, 2013High spectral resolution ozone absorption – Part 2
A. Serdyuchenko et al.
Title Page
Abstract Introduction
Conclusions References
Tables Figures
◭ ◮
◭ ◮
Back Close
Full Screen / Esc
Printer-friendly Version
Interactive Discussion
Discussion
P
a
per
|
D
iscussion
P
a
per
|
Discussion
P
a
per
|
Discuss
ion
P
a
per
|
berger, 1987; Malicet et al., 1989). The temperature variations in the Huggins band are much larger (Brion et al., 1993; Malicet et al., 1995; Paur and Bass, 1984). The Chappuis absorption band in the visible consists of a continuum with a series of peaks superimposed on the blue side of the spectrum. Weak temperature dependence was found for absorption cross sections on the top of the band (Burkholder and Talukdar,
5
1994). The Wulf absorption band in the near-infrared (NIR) wavelength region consists of a series of peaks superimposed on the continuum of the visible.
Table 1 provides an overview of the most relevant ozone cross-sections in the UV, visible, and near IR available at more than one temperature. More details on these datasets can be found in the review by Orphal (2003). In our companion paper
(Gor-10
shelev et al., 2013), we found typical accuracies of 2–3 % in the spectral regions with strong absorption (maximum of Hartley, Huggins, and Chappuis bands) for all literature data including our own measurements.
Among the datasets available at high spectral resolution (below 0.1 nm), only the data from Brion, Malicet, and Daumont team (often abbreviated as BMD) were
ob-15
tained from absolute measurements. Unfortunately, these data are only available for temperatures down to 218 K and for limited spectral regions only. The measurements by Bass and Paur (BP) were scaled to Hearn’s value at 253.65 nm at room temperature (Hearn, 1961) and consequently used for scaling the broadband low-resolution data by Bogumil et al. (2003). Low-resolution data by Burrows et al. (1999) were measured
20
absolutely using the titration method at 293 K and scaled at all temperatures assuming invariant integrated optical densities. The integrated absorption cross-sections of Bur-rows et al. (1999) were later used for absolute scaling of the broadband high-resolution data by Voigt et al. (2001). Measurements by Burkholder and Talukdar (1994) were normalized using the absolute absorption cross sections of Anderson and
Mauers-25
berger (1992) measured at five specific wavelengths near the peak of the Chappuis band at 298 K.
poly-AMTD
6, 6613–6643, 2013High spectral resolution ozone absorption – Part 2
A. Serdyuchenko et al.
Title Page
Abstract Introduction
Conclusions References
Tables Figures
◭ ◮
◭ ◮
Back Close
Full Screen / Esc
Printer-friendly Version
Interactive Discussion
Discussion
P
a
per
|
D
iscussion
P
a
per
|
Discussion
P
a
per
|
Discuss
ion
P
a
per
|
nomial fit (details will be given below). Liu et al. (2007) derived polynomial coefficients from the BMD data at four temperatures excluding the 273 K data. Polynomial coeffi -cients obtained from BP measurements are included in HITRAN 2008, a well-known high-resolution transmission molecular absorption database (Rothman et al., 2009).
Absolute cross-sections measurements at single wavelengths by El Helou
5
et al. (2005) and Barnes and Mauersberger (1987) were performed at all tempera-tures using pure ozone, while data by Enami et al. (2004) were scaled using Hearn’s value.
There is an obvious lack of consistent and consolidated data on O3absorption
cross-sections. None of the available literature data fulfils the criteria to be available for many
10
temperatures including the lowest atmospheric temperatures (below 200 K) and having broad spectral coverage from the UV to NIR and sufficient spectral resolution (better than 0.1 nm in the UV).
In this paper, we present the results on the temperature dependence of our new ozone cross-section measurements in the broad spectral region from 213 to 1100 nm
15
and obtained for temperatures from 293 to 193 K in steps of 10 K. The new data are compared with the data listed in Table 1. The experimental set up and methods for comparisons are discussed in detail in the companion paper (Gorshelev et al., 2013).
2 Experimental set-up and uncertainties budget
Our companion paper provides details on the performance of the experimental setups
20
equipped with an Echelle spectrometer and Fourier Transform spectrometer (FTS), used for measurements in the UV and UV/vis/NIR spectral ranges respectively. It also contains information on the ozone generators, gas supply, cooling systems, and the liquid nitrogen trap for preparation of pure ozone for absolute measurements. Abso-lute measurements were done in the spectral regions with strong absorptions
(Hart-25
spec-AMTD
6, 6613–6643, 2013High spectral resolution ozone absorption – Part 2
A. Serdyuchenko et al.
Title Page
Abstract Introduction
Conclusions References
Tables Figures
◭ ◮
◭ ◮
Back Close
Full Screen / Esc
Printer-friendly Version
Interactive Discussion
Discussion
P
a
per
|
D
iscussion
P
a
per
|
Discussion
P
a
per
|
Discuss
ion
P
a
per
|
tra separately at each temperature. Relative spectra at 213–310 nm and 350–450 nm were recorded using the Echelle spectrometer, which is a cross-dispersion instrument with spectral resolution of 0.02 nm in the 213–450 nm spectral region. Relative mea-surements were also performed for 335–350 nm and 780–1100 nm using the FTS with a spectral resolution of 1 and 2 cm−1, respectively. Cross-sections were calibrated
indi-5
vidually at each temperature, using absolute broadband measurements at 310–335 nm and 450–780 nm, recorded with the FTS at 1 cm−1 spectral resolution. This way, the new data are independent for every temperature and free from uncertainties of previ-ous studies.
For accurate investigation of the temperature dependence, measurements were
per-10
formed at eleven temperatures from 293 K down to 193 K in 10 K steps. Gas tempera-ture in the double jacketed quartz absorption cells was stabilized by continuous flow of ethanol provided by the cryostats (Haake CT 90 W Phoenix 2). For relative measure-ments performed at gas flow regimes, a system was equipped with pre-cooling units to assure efficient cooling of the oxygen-ozone mixture, which spent only limited time
15
in the absorption cells. The pre-cooler is a 10 m long copper pipe fitted into the Haake thermostat vessel. The length of the pipeline exposed to ambient air is approximately 50 cm. Such an arrangement, with proper thermal insulation, reduces ozone-oxygen mixture heating on its way from the cooler to the cell. In order to suppress the copper’s catalytic activity to destroy ozone, the inner surface of the pipe was passivized.
20
The cryostats were capable of limiting the statistical fluctuations to less than±0.3 K
for all temperatures. The calibration of the internal sensors of the thermostats was ver-ified using several alcohol thermometers. An agreement to within 1 K or better was found over the full range of operations. Several Pt-sensors were used to assess the temperature homogeneity inside the cell and in the cell jacket, which was found to be
25
AMTD
6, 6613–6643, 2013High spectral resolution ozone absorption – Part 2
A. Serdyuchenko et al.
Title Page
Abstract Introduction
Conclusions References
Tables Figures
◭ ◮
◭ ◮
Back Close
Full Screen / Esc
Printer-friendly Version
Interactive Discussion
Discussion
P
a
per
|
D
iscussion
P
a
per
|
Discussion
P
a
per
|
Discuss
ion
P
a
per
|
comparison of measured O2absorption spectrum with synthetic spectra calculated for different temperatures using line parameters from HITRAN 2008. The algorithm in-volves an iterative fitting of the rotational structure of the A-band using the dependence of line intensities on rotational temperature. The output is the mean over the cell tem-perature. The accuracy of the HITRAN parameters is about 1 % and the signal-to-noise
5
of the oxygen absorption spectrum was better than 1 %.
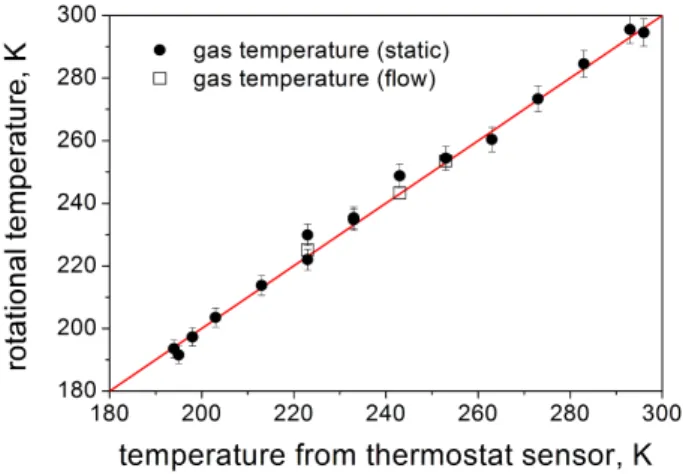
The Pt-sensors, the cryostat internal sensor, and spectroscopic measurements both in the static and flow regime were found to agree within 1–3 K for almost all tempera-tures, resulting in an uncertainty of 0.3–1.5 % for the whole range of the temperatures. The rotational temperature is shown in Fig. 1 as a function of the temperature measured
10
by the cryostat sensor. A relative uncertainty of 1.5 % can be taken as the upper limit for the temperature related error in the absolute measurements (also shown in Fig. 1 for convenience). For all absolute absorption measurements, ozone concentration was derived using the temperature measured by the cryostat internal sensor.
The error budget is shown in Table 2. For most of the spectral regions, the largest
15
contribution to the total uncertainty is due to the determination of the absolute ozone concentration. In our quartz cell the ozone concentration was found to fall by 10 % after 10–12 h at room temperature, and at temperatures below 243 K the decay rate is lower by at least one order of magnitude. Ozone decay in the cell during gas accumulation before measurements and during spectral recording had to be taken into account only
20
for temperatures above 243 K. The uncertainty of the ozone pressure is about 1 % and better, improving towards lower temperatures.
During the absolute measurements, light source stability was 0.2 and 2 % for Chap-puis and Huggins bands respectively. The uncertainty of the absolute calibration trans-lates as well into the relative spectra that were concatenated. For the majority of the
25
uncer-AMTD
6, 6613–6643, 2013High spectral resolution ozone absorption – Part 2
A. Serdyuchenko et al.
Title Page
Abstract Introduction
Conclusions References
Tables Figures
◭ ◮
◭ ◮
Back Close
Full Screen / Esc
Printer-friendly Version
Interactive Discussion
Discussion
P
a
per
|
D
iscussion
P
a
per
|
Discussion
P
a
per
|
Discuss
ion
P
a
per
|
tainties, spectral limits of concatenated regions and corresponding measured optical densities can be found in our companion paper (Gorshelev et al., 2013).
3 Results and discussion
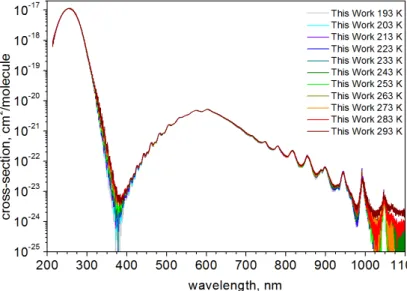
The absorption cross-sections from this work are presented in Fig. 2. The data cover the spectral region 213–1100 nm and span over more than seven orders of magnitude.
5
We analysed the absorption cross-sections of O3at different temperatures by
– determining scaling factors between the new and published band-integrated cross-sections;
– comparing our results and published datasets at wavelengths of the Hg lamp (254 nm) and those used routinely in ozone remote sensing;
10
– determining scaling factors and wavelength shifts in the Hartley, Huggins and Chappuis bands with respect to the high resolution BMD and BP datasets and low-resolution data obtained by Bogumil et al. (2003).
3.1 Band-integrated cross-section comparison
Band-integrated absorption cross-sections are convenient for comparison of datasets
15
with different spectral resolution. When available, considered cross-sections were in-tegrated using the spectral regions suggested by Orphal (2003): 245–340 nm in Hart-ley band, 325–340 nm in Huggins band, 410–690 nm in Chappuis band. For the inte-gration in the Wulf band we used the range 663–1000 nm suggested by Banichevich et al. (1993) from theoretical studies of the potential energy surfaces of ozone in its
20
ground and the lowest lying eight excited states.
AMTD
6, 6613–6643, 2013High spectral resolution ozone absorption – Part 2
A. Serdyuchenko et al.
Title Page
Abstract Introduction
Conclusions References
Tables Figures
◭ ◮
◭ ◮
Back Close
Full Screen / Esc
Printer-friendly Version
Interactive Discussion
Discussion
P
a
per
|
D
iscussion
P
a
per
|
Discussion
P
a
per
|
Discuss
ion
P
a
per
|
Burrows et al., 1999; Bogumil et al., 2003; Voigt et al., 2001; Burkholder and Talukdar, 1994). Among these datasets only two were measured absolutely (BMD and Burrows et al., 1999). This table also contains ratios of the published datasets over our new dataset.
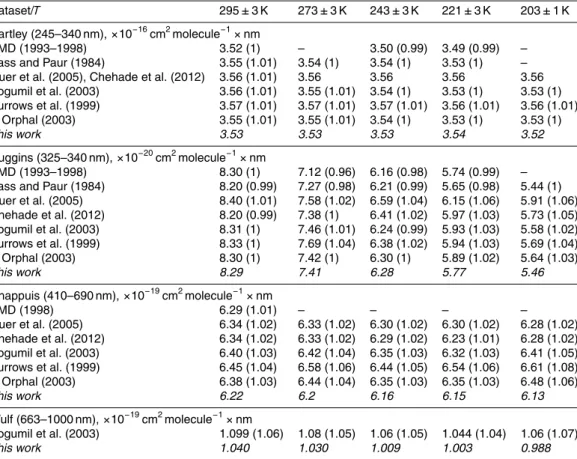
Integrated cross-sections in the Hartley band agree to within 1 % or better for all
con-5
sidered datasets. In the Huggins band data agree within 0.1–6 %, with less agreement towards lower temperatures and at 273 K. In the Chappuis and Wulf bands the new data are lower than the published datasets.
The agreement of our new data with BMD is within 2 % for all values, except for the Huggins band at 273 K. The Bogumil et al. (2003) dataset exceeds our new data
10
by about 3–5 % for all temperatures in all bands. In the Hartley and Chappuis bands, our data are only slightly lower (1–2 %) than the broadband dataset obtained by Guer et al. (2005) and recently revised by Chehade et al. (2012) for GOME 2. The new experimental data deviate from the mean values obtained by Orphal by about 1–3 % in the Hartley and Huggins bands and up to 6 % in the Chappuis band. The later is
15
partly due to the low absorption in the region near the ozone absorption minimum (near 380 nm), which is overestimated by most of the datasets except for BMD and this work. This is particularly evident at lower temperatures.
3.2 Temperature dependence in the Hartley band
The temperature dependence in the Hartley band was investigated in many studies,
20
including the works mentioned above. The absorption by the Hartley band system was found to shift towards longer wavelength with increasing temperature due to vibrational excitation, resulting in a redistribution of the vibrational state populations in the ground state (Baiamonte et al., 1966). We fitted a Gaussian profile to the Hartley band between the shortest wavelength available and 300 nm and analysed the centre position of the
25
AMTD
6, 6613–6643, 2013High spectral resolution ozone absorption – Part 2
A. Serdyuchenko et al.
Title Page
Abstract Introduction
Conclusions References
Tables Figures
◭ ◮
◭ ◮
Back Close
Full Screen / Esc
Printer-friendly Version
Interactive Discussion
Discussion
P
a
per
|
D
iscussion
P
a
per
|
Discussion
P
a
per
|
Discuss
ion
P
a
per
|
temperature change. The BMD data reveal a more pronounced shift of 0.36 nm from 218 to 295 K.
Different groups reported a weak increase of cross-sections of about 1 % for tem-perature change from 295 to 229 K in the Hartley band (Barnes and Mauersberger, 1987; Malicet et al., 1989; Paur and Bass, 1985). Our new data also show a weak
tem-5
perature dependence (about 2 % in the range 193–293 K). Figure 3 shows our cross-section spectra at 193 and 293 K near 250 nm and the temperature dependence of var-ious datasets including ours at 253.65 nm, corresponding to the Hg lamp line. There is a very good agreement between new and BMD data, while Bogumil et al. (2003) dataset is higher than the new dataset by about 2 %. The Bogumil et al. (2003) dataset
10
does not show any clear temperature dependence, while the absorption cross-sections reported in this study slightly increase with decreasing temperature.
3.3 Temperature dependence in the Huggins band
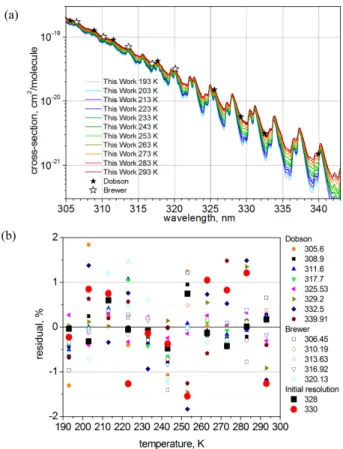
The new cross-section data at eleven temperatures in the Huggins band are shown in Fig. 4a. The band contains the spectral window (325–335 nm) used for the ozone total
15
column retrievals with the DOAS technique (Coldewey-Edbes et al., 2005).
3.3.1 Polynomial parameterization
The Bass–Paur parameterization empirically describes the temperature dependence of the cross-sections in the DOAS window as a second order polynomial, making it possible to interpolate between temperatures (Paur and Bass, 1985). Commonly used
20
equation for the temperature dependence is
σ(λ)=10−20 ·
h
C0(λ)+C1(λ)·T+C2(λ)·T2i, (1)
where T is the temperature in degrees Celsius and C0, C1 and C2 are wavelength
AMTD
6, 6613–6643, 2013High spectral resolution ozone absorption – Part 2
A. Serdyuchenko et al.
Title Page
Abstract Introduction
Conclusions References
Tables Figures
◭ ◮
◭ ◮
Back Close
Full Screen / Esc
Printer-friendly Version
Interactive Discussion
Discussion
P
a
per
|
D
iscussion
P
a
per
|
Discussion
P
a
per
|
Discuss
ion
P
a
per
|
We analyzed the temperature dependence of the new ozone absorption cross-section in the spectral channels of two ground-based instruments: Dobson and Brewer spectrophotometers (Scarnato et al., 2009). The channels fall on maxima and minima of the spectral features in the region 305–340 nm (wavelengths are indicated in Fig. 4a). For a rough resolution matching with the instrumental slit functions, we convolved our
5
new dataset to 1 and 0.4 nm using a rectangular slit function for analysis at Dobson and Brewer wavelengths, respectively. In addition, we investigated the temperature be-havior at initial spectral resolution of about 0.02 nm at 328 and 330 nm, which are local absorption minimum and maximum.
The deviations of the new cross-sections from the polynomial fits at described above
10
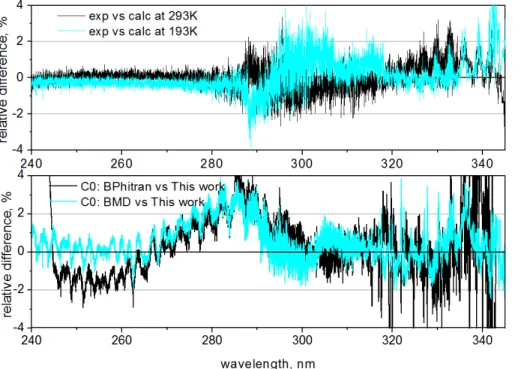
wavelengths are shown in Fig. 4b. The quadratic polynomial (Eq. 1) describes the temperature dependence for most wavelengths to within 1 %, which is within the ex-perimental uncertainty. Generally, wavelengths near ozone absorption maxima exhibit smaller deviations. Figure 5 (upper panel) shows the difference between the experi-mental data and calculated data for two temperatures: 193 and 293 K. Deviations are
15
generally less than 2 %. In principle, calculated data have better signal-to-noise level compared to the experimental ones, as artifacts from measurements at a single tem-perature are smoothed out.
Differences between coefficients C0(λ) obtained in several works are shown in the
lower panel in Fig. 5. We analyzed data from this work and those obtained by Bass
20
and Paur from their measurements in the range 203–298 K and by Liu et al. (2007) using BMD measurements at 218, 228, 243 and 295 K. Deviations are within 2 % in the Huggins band but increase at longer wavelengths. BP data become noisier above 335 nm. Some of the differences between the coefficients can be explained by slight resolution mismatch and errors in the wavelength calibration in any of the considered
25
AMTD
6, 6613–6643, 2013High spectral resolution ozone absorption – Part 2
A. Serdyuchenko et al.
Title Page
Abstract Introduction
Conclusions References
Tables Figures
◭ ◮
◭ ◮
Back Close
Full Screen / Esc
Printer-friendly Version
Interactive Discussion
Discussion
P
a
per
|
D
iscussion
P
a
per
|
Discussion
P
a
per
|
Discuss
ion
P
a
per
|
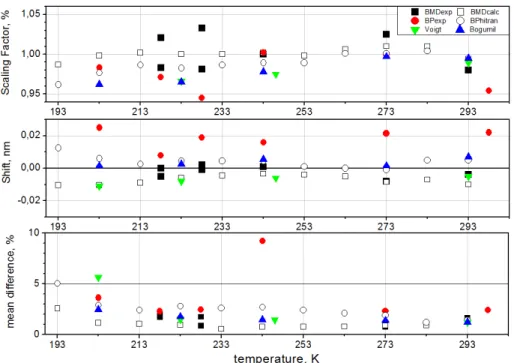
3.3.2 Comparison with high and low spectral resolution datasets
We performed detailed comparisons of the new cross-sections in the spectral region 325–340 nm with the high-resolution datasets (BMD, BP and Voigt et al., 2001) and the low-resolution Bogumil et al. (2003) dataset. Data were analyzed by determining scaling factors and wavelength shifts between the considered datasets and mean
dif-5
ferences. Data were interpolated on a common wavelength grid, converted to vacuum wavelength and then shifted and scaled until the smallest mean difference over the spectral region was reached. For comparison with the low resolution dataset by Bogu-mil et al. (2003) our new data were convolved with the Gaussian profile with FWHM of 0.2 nm. To check the linearity of the shifts and scaling factors, we performed the
analy-10
sis for three different spectral regions: 323–330 nm, 332–340 nm and 323–340 nm and averaged values to obtain uncertainties. More details on the comparison routine are given in our companion paper (Gorshelev et al., 2013).
We compared the experimental BMD data to the temperature parameterized BMD data obtained by Liu et al. (2007) in order to provide an additional independent check
15
for the uncertainty due to the assumption of the quadratic temperature dependence. The parameterized BMD spectrum deviates from the experimental BMD within the ex-perimental accuracy limits both in absolute values and shifts. Mean difference in the spectral region 325–340 nm is about 1 %. Therefore, in the following comparisons we used both the original and parameterized cross-sections, which are practical in case of
20
missing data at some temperatures.
We found differences between the parameterized BMD and the parameterized BP datasets, which are outside of the accuracy limits reported for both datasets. Wave-length shifts of 0.015–0.02 nm were found. After correcting for waveWave-length shifts the mean difference is about 3 % with larger deviations at low temperatures.
25
AMTD
6, 6613–6643, 2013High spectral resolution ozone absorption – Part 2
A. Serdyuchenko et al.
Title Page
Abstract Introduction
Conclusions References
Tables Figures
◭ ◮
◭ ◮
Back Close
Full Screen / Esc
Printer-friendly Version
Interactive Discussion
Discussion
P
a
per
|
D
iscussion
P
a
per
|
Discussion
P
a
per
|
Discuss
ion
P
a
per
|
to the published datasets to match the new dataset. The remaining deviations after scaling and shifting are then due to non-linear spectral/wavelength calibration diff er-ences, differences in the instrumental slit functions and resolution mismatch between the datasets. In addition, slight mismatch of temperatures has to be taken into account when comparing original experimental data in this region because of the high sensitivity
5
of the Huggins band spectral features to the temperature.
We compared our new data at 213 K with the experimental BP data obtained at 218 K and our data at 223 K with BP data at 218 and 228 K and found scaling factors of up to−6 % needed to minimize the differences which are also due to the
temper-ature mismatch of 5 K. We observed wavelength shifts of 0.015–0.02 nm between the
10
BP and our new data (similar to that have been seen when comparing BP to BMD) and the mean difference of about 2–3 %, increasing to 4–5 % at low temperatures. HI-TRAN 2008 version accommodates polynomial coefficients obtained for the BP data after wavelength correction performed on the base of Voigt et al. measurements. Com-parison with the data calculated using these coefficients revealed scaling factors of 1 %
15
for most temperatures and a relatively small wavelength shift (0.005–0.01 nm).
We compared our data at 213 and 223 K to the experimental BMD data at 218 K and our data at 223 and 233 K to the BMD data at 228 K and found scaling factors of±2 %
needed for minimizing the differences. Small mean shifts of 0.005 nm and less are observed for the window 323–340 nm between the new data and experimental BMD.
20
However, real shifts are non-linear because we found different wavelength shifts for smaller regions 323–330 nm and 332–340 nm. The same was reported by Orphal. The mean relative difference is about 1–2 % at 325–340 nm, which is within the experimen-tal accuracy limits. Calculated BMD data agree with our new experimenexperimen-tal data within accuracy limits both with respect to absolute values and spectral shifts.
25
AMTD
6, 6613–6643, 2013High spectral resolution ozone absorption – Part 2
A. Serdyuchenko et al.
Title Page
Abstract Introduction
Conclusions References
Tables Figures
◭ ◮
◭ ◮
Back Close
Full Screen / Esc
Printer-friendly Version
Interactive Discussion
Discussion
P
a
per
|
D
iscussion
P
a
per
|
Discussion
P
a
per
|
Discuss
ion
P
a
per
|
3.4 Temperature dependence in Chappuis and Wulf bands
Few experimental data are available in the weak absorption region between the Hug-gins and Chappuis absorption bands (∼375 nm). The BP dataset does not cover this
region. Figure 7 shows our results, and BMD and Bogumil et al. (2003) data in this region. The BMD experimental data are only available down to 218 K and for all
tem-5
peratures below that, Bass–Paur temperature parameterization must be used. Cross-sections calculated using temperature coefficients obtained by Liu et al. (2007) from the BMD experimental data drastically fall at 203 K. The low-resolution dataset by Bogu-mil et al. (2003) overestimates the minimum absorption. Near the bottom of the weak absorption region (370–390 nm), our new data appears to be noisier than the BMD
10
dataset. We expect improvement of this region from our future measurements.
Very weak temperature dependence was observed in our new measurements around 600 nm (about 1 % between 193 and 293 K), with a small increase of cross-sections with falling temperatures.
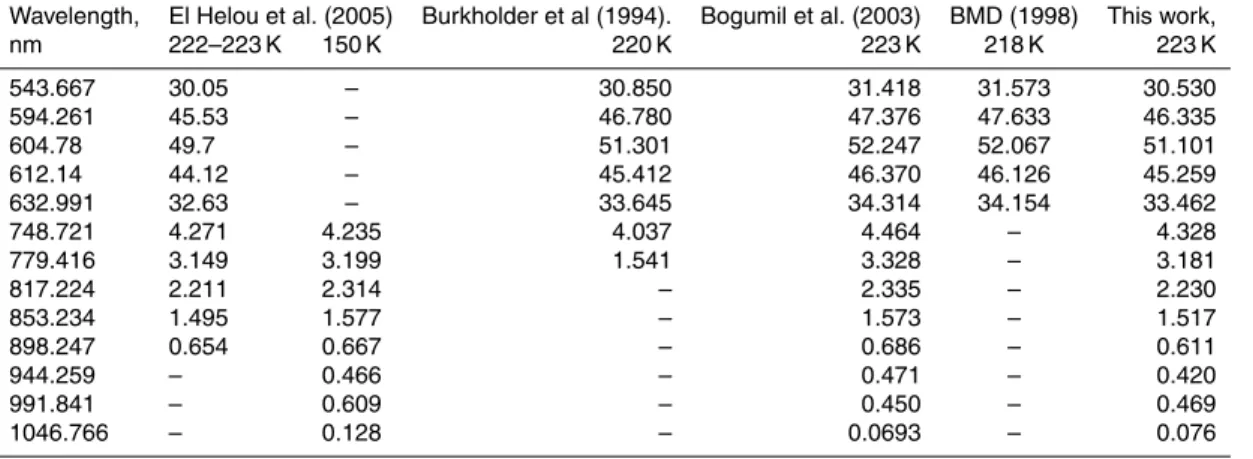
Only few studies were performed below 293 K in the Chappuis (Fig. 8) and Wulf
15
(Fig. 9) bands, especially in the NIR region. The most extensive dataset obtained so far was reported by Bogumil et al. (2003). In the Chappuis band and NIR, our new data are lower than the Bogumil et al. (2003) dataset (2–4.5 % in the region 540–850 nm) and agree very well in the region 540–630 nm with the data of Burkholder and Taluk-dar (0.4–1 %) which have reported accuracy of 1 % and better for wavelengths longer
20
than 450 nm. There is a good agreement between our data and the data of El Helou et al. (2005); however, the latter show a reversed temperature dependence around 600 nm. In Table 4, several datasets are compared at discrete wavelengths taken from El Helou et al. (2005). High spectral resolution BMD data in the Chappuis band are only available for 218 K. Our data are lower by 2–3 %. BMD report a systematic error of
25
AMTD
6, 6613–6643, 2013High spectral resolution ozone absorption – Part 2
A. Serdyuchenko et al.
Title Page
Abstract Introduction
Conclusions References
Tables Figures
◭ ◮
◭ ◮
Back Close
Full Screen / Esc
Printer-friendly Version
Interactive Discussion
Discussion
P
a
per
|
D
iscussion
P
a
per
|
Discussion
P
a
per
|
Discuss
ion
P
a
per
|
In the 540–630 nm region our data are slightly lower (1–2.5 %) than the GOME-2 FM3 data obtained by Guer et al. and the recently revised GOME-GOME-2 FM3 data by Chehade et al. The region around 760 nm contains an absorption band of oxygen, which is visible in the Bogumil et al. (2003) dataset due to the oxygen/ozone mixture used during the measurements. The Bogumil et al. (2003) data does not show any
5
clear temperature dependence. The new dataset measured using pure ozone is free of oxygen absorption and shows a clear temperature dependence (Fig. 8b). Absolute values are lower by a few percent (3–4 %) compared to Bogumil et al. (2003). The data of Enami et al. (2004) show similar temperature dependence, but cross-sections are higher than the new data (about 2–3 %).
10
There is good agreement in the NIR spectral region between this study and the data of Bogumil et al. (2003) and El Helou et al. (2005), both in absolute values and in the temperature dependence. Measurements of El Helou et al. (2005) performed at 150 K are only slightly different from that at 223 K.
Temperature dependence in the NIR region around 1000 nm is somewhat masked
15
by the low signal-to-noise ratio in the Bogumil et al. (2003) dataset. The new dataset reveals a clear temperature dependence, and resolves the rotational structure (Fig. 9). At wavelengths longer than 1050 nm our cross-sections drastically drop and have low signal-to-noise ratio. Our FTS setup was not optimized for this spectral region.
4 Conclusions
20
Most of the broadband datasets measured so far for different temperatures were either limited in spectral region or resolution, or were scaled to literature data, thus, inheriting uncertainties from previous studies. Our experimental setup made it possible to ob-tain absolute high-resolution broadband data at various temperatures down to a record low 193 K. The uncertainty of the absolute measurements related to the ozone decay
25
mea-AMTD
6, 6613–6643, 2013High spectral resolution ozone absorption – Part 2
A. Serdyuchenko et al.
Title Page
Abstract Introduction
Conclusions References
Tables Figures
◭ ◮
◭ ◮
Back Close
Full Screen / Esc
Printer-friendly Version
Interactive Discussion
Discussion
P
a
per
|
D
iscussion
P
a
per
|
Discussion
P
a
per
|
Discuss
ion
P
a
per
|
surements of the oxygen A-band was used to obtain an independent estimate of the mean gas temperature across the absorption cell in addition to the commonly used contact temperature sensors.
The new data are in a very good agreement with the BMD dataset at all temper-atures. The new broadband dataset offers additional information on the temperature
5
dependence of the ozone absorption cross-sections, both inside and outside of the previously available temperatures range. Our study confirms that a second order poly-nomial reproduces the temperature dependence of the experimental data in the Hug-gins band within the experimental uncertainty limits. The new dataset obtained at 11 temperatures is expected to provide more accurate temperature parameterization
com-10
pared to that typically derived from 4 to 5 temperature points in the literature data that are currently used in the ozone retrievals.
We found a weak temperature dependence on the top of the Hartley and Chappuis bands, which is however within experimental uncertainties. In the Wulf band we ob-tain a clear temperature dependence in agreement with low resolution measurements
15
reported by Bogumil et al. (2003). We plan to investigate temperature dependence in the NIR region in more details using an improved dual channel FTS setup with higher signal-to-noise ratio. Improved measurements in the thermal IR can also be of interest for comparisons between UV, visible, NIR and thermal IR ozone retrievals in the current and future remote sensing missions. The NIR measurements as well as new
measure-20
ments near 380 nm (absorption minimum between Higgins and Chappuis bands) are on-going.
The new ozone cross-sections are available on the homepage of the Molec-ular Spectroscopy laboratory of the Institute of the Environmental Physics, Uni-versity of Bremen (http://www.iup.uni-bremen.de/gruppen/molspec/databases/index.
25
AMTD
6, 6613–6643, 2013High spectral resolution ozone absorption – Part 2
A. Serdyuchenko et al.
Title Page
Abstract Introduction
Conclusions References
Tables Figures
◭ ◮
◭ ◮
Back Close
Full Screen / Esc
Printer-friendly Version
Interactive Discussion
Discussion
P
a
per
|
D
iscussion
P
a
per
|
Discussion
P
a
per
|
Discuss
ion
P
a
per
|
Acknowledgements. This study was produced within the framework of a project devoted to the harmonization of the satellite cross-sections datasets, initiated at the University of Bremen and supported in part by the European Space Agency (within the ESA HARMONICS project), by the State of Bremen, University of Bremen, and DLR.
References 5
Anderson, S. M. and Mauersberger, K.: Laser measurements of ozone absorption cross sec-tions in the Chappuis band, Geophys. Res. Lett., 19, 933–936, 1992.
Baiamonte, V. D., Snelling, D. R., and Bair, E. J.: Vibrational energy of ozone during photolytic explosion, J. Chem. Phys., 44, 673–682, 1966.
Banichevich, A., Peyerimhoff, S. D., and Grein, F.: Potential energy surfaces of ozone in its 10
ground state and in the lowest-lying eight excited states, Chem. Phys., 178, 155–188, 1993. Barnes, J. and Mauersberger, K.: Temperature dependence of the ozone absorption cross
section at the 253.7 nm Mercury line, J. Geophys. Res., 92, 14861–14864, 1987.
Bogumil, K., Orphal, J., Homann, T., Voigt, S., Spietz, P., Fleischmann, O. C., Vogel, A., Hart-mann, M., BovensHart-mann, H., Frerick, J., and Burrows, J. P.: Measurements of molecular ab-15
sorption spectra with the SCIAMACHY pre-flight model: instrument characterization and ref-erence data for atmospheric remote-sensing in the 230–2380 nm region, J. Photoch. Photo-bio. A., 157, 157–167, 2003.
Brion, J., Chakir, A., Daumont, D., Malicet, J., and Parisse, C.: High-resolution laboratory ab-sorption cross section of O3, temperature effect, Chem. Phys. Lett., 213, 610–612, 1993. 20
Brion, J., Chakir, A., Charbonnier, J., Daumont, D., Parisse, C., and Malicet, J.: Absorption spectra measurements for the ozone molecule in the 350–830 nm region, J. Atmos. Chem., 30, 291–299, 1998.
Burkholder, J. B. and Talukdar, R. K.: Temperature dependence of the ozone, Geophys. Res. Lett., 21, 581–584, 1994.
25
AMTD
6, 6613–6643, 2013High spectral resolution ozone absorption – Part 2
A. Serdyuchenko et al.
Title Page
Abstract Introduction
Conclusions References
Tables Figures
◭ ◮
◭ ◮
Back Close
Full Screen / Esc
Printer-friendly Version
Interactive Discussion
Discussion
P
a
per
|
D
iscussion
P
a
per
|
Discussion
P
a
per
|
Discuss
ion
P
a
per
|
Chehade, W., Gür, B., Spietz, P., Gorshelev, V., Serdyuchenko, A., Burrows, J. P., and We-ber, M.: Temperature dependent ozone absorption cross section spectra measured with the GOME-2 FM3 spectrometer and first application in satellite retrievals, Atmos. Meas. Tech. Discuss., 5, 7983–8015, doi:10.5194/amtd-5-7983-2012, 2012.
Coldewey-Egbers, M., Weber, M., Lamsal, L. N., de Beek, R., Buchwitz, M., and Burrows, J. P.: 5
Total ozone retrieval from GOME UV spectral data using the weighting function DOAS ap-proach, Atmos. Chem. Phys., 5, 1015–1025, doi:10.5194/acp-5-1015-2005, 2005.
El Helou, Z., Churassy, S., Wannous, G., Bacis, R., and Boursey, E.: Absolute cross sections of ozone at atmospheric temperatures for the Wulf and the Chappuis bands, J. Chem. Phys., 122, 244311, doi:10.1063/1.1937369, 2005.
10
Enami, S., Ueda, J., Nakano, Y., Hashimoto, S., and Kawasaki, M.: Temperature-dependent absorption cross sections of ozone in the Wulf-Chappuis band at 759–768 nm, J. Geophys. Res., 109, D05309, doi:doi:10.1029/2003JD00409, 2004
Gorshelev, V., Serdyuchenko, A., Weber, M., Chehade, W., and Burrows, J. P.: High spectral resolution ozone absorption cross-sections — Part 1: Measurements, data analysis and com-15
parison with previous measurements around 293 K, Atmos. Meas. Tech. Discuss., 6, 6567– 6611, doi:10.5194/amtd-6-6567-2013, 2013.
Guer, B., Spietz, P., Orphal, J., and Burrows, J. P.: Absorption Spectra Measurements with the GOME-2 FMs using the IUP/IFE-UB’s Calibration Apparatus for Trace Gas Absorption Spec-troscopy CATGAS, Final Report, Contract No. 16007/02/NL/SF, ESA/EUMETSAT, Bremen, 20
2005.
Hearn, A. G.: The absorption of ozone in the ultra-violet and visible regions of the spectrum, P. Phys. Soc., 78, 932–940, 1961.
Liu, X., Chance, K., Sioris, C. E., and Kurosu, T. P.: Impact of using different ozone cross sections on ozone profile retrievals from Global Ozone Monitoring Experiment (GOME) ul-25
traviolet measurements, Atmos. Chem. Phys., 7, 3571–3578, doi:10.5194/acp-7-3571-2007, 2007.
Malicet, J., Brion, J., and Daumont, D.: Temperature dependence of the absorption cross-section of ozone at 254 nm, Chem. Phys. Lett., 158, 293–296, 1989.
Malicet, J., Daumont, D., Charbonnier, J., Chakir, C., Parisse, A., and Brion, J.: Ozone UV 30
AMTD
6, 6613–6643, 2013High spectral resolution ozone absorption – Part 2
A. Serdyuchenko et al.
Title Page
Abstract Introduction
Conclusions References
Tables Figures
◭ ◮
◭ ◮
Back Close
Full Screen / Esc
Printer-friendly Version
Interactive Discussion
Discussion
P
a
per
|
D
iscussion
P
a
per
|
Discussion
P
a
per
|
Discuss
ion
P
a
per
|
Orphal, J.: A critical review of the absorption cross-sections of O3 and NO2 in the ultraviolet and visible, J. Photoch. Photobio. A, 157, 185–209, 2003.
Paur, R. J. and Bass, A. M.: The ultraviolet cross-sections of ozone: II. Results and temperature dependence, in: Atmospheric Ozone, edited by: Zeferos, C. S. and Ghazi, A., Proc. Quaren-nial Ozone Symposium, Halkidiki, Greece, 1984, Reidel, D., Dordrecht, 611–615, 1985. 5
Rothman, L. S., Gordon, I. E., Barbe, A., Benner, C. D., Bernath, P. F., Birk, M., Boudon, V., Brown, L. R., Campargue, A., Champion, J.-P., Chance, K., Coudert, L. H., Dana, V., Devi, V. M., Fally, S., Flaud, J.-M., Gamache, R. R., Goldman, A., Jacquemart, D., Kleiner, I., Lacome, N., Lafferty, W. J., Mandin, J.-Y., Massie, S. T., Mikhailenko, S. N., Miller, C. E., Moazzen-Ahmadi, N., Naumenko, O. V., Nikitin, A. V., Orphal, J., Perevalov, V. I., Perrin, 10
A., Predoi-Crosss, A., Rinsland, C. P., Rotger, M., Šimečkova, M., Smith, M. A. H., Sung, K., Tashkun, S. A., Tennyson, J., Toth, R. A., Vandaele, A. C., and Auwera Vander, J.: The HITRAN 2008 molecular spectroscopic database, J. Quant. Spectrosc. Ra., 110, 533–572, 2009.
Scarnato, B., Staehelin, J., Peter, T., Groebner, J., and Stuebi, R.: Temperature and slant path 15
effects in Dobson and Brewer total ozone measurements, J. Geophys. Res., 114, D24303, doi:10.1029/2009JD012349, 2009.
Voigt, S., Orphal, J., Bogumil, K., and Burrows, J. P.: The temperature dependence (203– 293 K) of the absorption cross sections of O3in the 230–850 nm region measured by Fourier-Transform spectroscopy, J. Photoch. Photobio. A, 143, 1–9, 2001.
AMTD
6, 6613–6643, 2013High spectral resolution ozone absorption – Part 2
A. Serdyuchenko et al.
Title Page
Abstract Introduction
Conclusions References
Tables Figures
◭ ◮
◭ ◮
Back Close
Full Screen / Esc
Printer-friendly Version
Interactive Discussion
Discussion
P
a
per
|
D
iscussion
P
a
per
|
Discussion
P
a
per
|
Discuss
ion
P
a
per
|
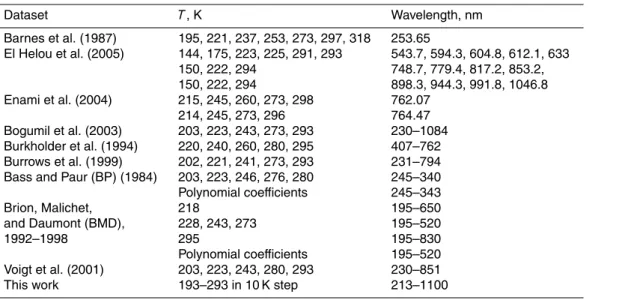
Table 1.Characteristics of the datasets on ozone absorption cross-sections.
Dataset T, K Wavelength, nm
Barnes et al. (1987) 195, 221, 237, 253, 273, 297, 318 253.65
El Helou et al. (2005) 144, 175, 223, 225, 291, 293
150, 222, 294 150, 222, 294
543.7, 594.3, 604.8, 612.1, 633 748.7, 779.4, 817.2, 853.2, 898.3, 944.3, 991.8, 1046.8
Enami et al. (2004) 215, 245, 260, 273, 298
214, 245, 273, 296
762.07 764.47
Bogumil et al. (2003) 203, 223, 243, 273, 293 230–1084
Burkholder et al. (1994) 220, 240, 260, 280, 295 407–762
Burrows et al. (1999) 202, 221, 241, 273, 293 231–794
Bass and Paur (BP) (1984) 203, 223, 246, 276, 280
Polynomial coefficients
245–340 245–343 Brion, Malichet,
and Daumont (BMD), 1992–1998
218
228, 243, 273 295
Polynomial coefficients
195–650 195–520 195–830 195–520
Voigt et al. (2001) 203, 223, 243, 280, 293 230–851
AMTD
6, 6613–6643, 2013High spectral resolution ozone absorption – Part 2
A. Serdyuchenko et al.
Title Page
Abstract Introduction
Conclusions References
Tables Figures
◭ ◮
◭ ◮
Back Close
Full Screen / Esc
Printer-friendly Version
Interactive Discussion
Discussion
P
a
per
|
D
iscussion
P
a
per
|
Discussion
P
a
per
|
Discuss
ion
P
a
per
|
Table 2.Uncertainty in the absorption cross-section obtained from absolute measurements at 50 mbar and 193–293 K and path lengths of 135 and 270 cm in the Huggins and Chappuis bands.
Systematic uncertainty Statistical uncertainty
Ozone impurity: Ozone decay<1 %
−oxygen impurity 0.005 % Pressure fluctuations<0.08 % (<0.04 mbar)
−leaks<0.1 % Temperature fluctuations<0.1–0.16 % (<0.3 K)
Accuracy of pressure sensors 0.04 % (0.02 mbar) Light source stability 0.2 % (vis)/2 % (UV)
Temperature measurements<0.3–1.6 % (1–3 K) (relative to optical density OD=1)
Temperature non-uniformity in the system<0.3 % (1 K)
Cell length<0.04–0.07 % (<1 mm)
AMTD
6, 6613–6643, 2013High spectral resolution ozone absorption – Part 2
A. Serdyuchenko et al.
Title Page
Abstract Introduction
Conclusions References
Tables Figures
◭ ◮
◭ ◮
Back Close
Full Screen / Esc
Printer-friendly Version
Interactive Discussion
Discussion
P
a
per
|
D
iscussion
P
a
per
|
Discussion
P
a
per
|
Discuss
ion
P
a
per
|
Table 3.Integrated cross-sections, and their ratios (in brackets) to our new dataset.
Dataset/T 295±3 K 273±3 K 243±3 K 221±3 K 203±1 K
Hartley (245–340 nm),×10−16cm2molecule−1
×nm
BMD (1993–1998) 3.52 (1) – 3.50 (0.99) 3.49 (0.99) – Bass and Paur (1984) 3.55 (1.01) 3.54 (1) 3.54 (1) 3.53 (1) – Guer et al. (2005), Chehade et al. (2012) 3.56 (1.01) 3.56 3.56 3.56 3.56 Bogumil et al. (2003) 3.56 (1.01) 3.55 (1.01) 3.54 (1) 3.53 (1) 3.53 (1) Burrows et al. (1999) 3.57 (1.01) 3.57 (1.01) 3.57 (1.01) 3.56 (1.01) 3.56 (1.01) J. Orphal (2003) 3.55 (1.01) 3.55 (1.01) 3.54 (1) 3.53 (1) 3.53 (1)
This work 3.53 3.53 3.53 3.54 3.52
Huggins (325–340 nm),×10−20cm2molecule−1
×nm
BMD (1993–1998) 8.30 (1) 7.12 (0.96) 6.16 (0.98) 5.74 (0.99) – Bass and Paur (1984) 8.20 (0.99) 7.27 (0.98) 6.21 (0.99) 5.65 (0.98) 5.44 (1) Guer et al. (2005) 8.40 (1.01) 7.58 (1.02) 6.59 (1.04) 6.15 (1.06) 5.91 (1.06) Chehade et al. (2012) 8.20 (0.99) 7.38 (1) 6.41 (1.02) 5.97 (1.03) 5.73 (1.05) Bogumil et al. (2003) 8.31 (1) 7.46 (1.01) 6.24 (0.99) 5.93 (1.03) 5.58 (1.02) Burrows et al. (1999) 8.33 (1) 7.69 (1.04) 6.38 (1.02) 5.94 (1.03) 5.69 (1.04) J. Orphal (2003) 8.30 (1) 7.42 (1) 6.30 (1) 5.89 (1.02) 5.64 (1.03)
This work 8.29 7.41 6.28 5.77 5.46
Chappuis (410–690 nm),×10−19cm2molecule−1
×nm
BMD (1998) 6.29 (1.01) – – – –
Guer et al. (2005) 6.34 (1.02) 6.33 (1.02) 6.30 (1.02) 6.30 (1.02) 6.28 (1.02) Chehade et al. (2012) 6.34 (1.02) 6.33 (1.02) 6.29 (1.02) 6.23 (1.01) 6.28 (1.02) Bogumil et al. (2003) 6.40 (1.03) 6.42 (1.04) 6.35 (1.03) 6.32 (1.03) 6.41 (1.05) Burrows et al. (1999) 6.45 (1.04) 6.58 (1.06) 6.44 (1.05) 6.54 (1.06) 6.61 (1.08) J. Orphal (2003) 6.38 (1.03) 6.44 (1.04) 6.35 (1.03) 6.35 (1.03) 6.48 (1.06)
This work 6.22 6.2 6.16 6.15 6.13
Wulf (663–1000 nm),×10−19cm2molecule−1
×nm
Bogumil et al. (2003) 1.099 (1.06) 1.08 (1.05) 1.06 (1.05) 1.044 (1.04) 1.06 (1.07)
AMTD
6, 6613–6643, 2013High spectral resolution ozone absorption – Part 2
A. Serdyuchenko et al.
Title Page
Abstract Introduction
Conclusions References
Tables Figures
◭ ◮
◭ ◮
Back Close
Full Screen / Esc
Printer-friendly Version
Interactive Discussion
Discussion
P
a
per
|
D
iscussion
P
a
per
|
Discussion
P
a
per
|
Discuss
ion
P
a
per
|
Table 4.Comparison of some datasets at low temperatures in the Chappuis and Wulf bands,
×10−22cm2molecule−1.
Wavelength, El Helou et al. (2005) Burkholder et al (1994). Bogumil et al. (2003) BMD (1998) This work,
nm 222–223 K 150 K 220 K 223 K 218 K 223 K
543.667 30.05 – 30.850 31.418 31.573 30.530
594.261 45.53 – 46.780 47.376 47.633 46.335
604.78 49.7 – 51.301 52.247 52.067 51.101
612.14 44.12 – 45.412 46.370 46.126 45.259
632.991 32.63 – 33.645 34.314 34.154 33.462
748.721 4.271 4.235 4.037 4.464 – 4.328
779.416 3.149 3.199 1.541 3.328 – 3.181
817.224 2.211 2.314 – 2.335 – 2.230
853.234 1.495 1.577 – 1.573 – 1.517
898.247 0.654 0.667 – 0.686 – 0.611
944.259 – 0.466 – 0.471 – 0.420
991.841 – 0.609 – 0.450 – 0.469
AMTD
6, 6613–6643, 2013High spectral resolution ozone absorption – Part 2
A. Serdyuchenko et al.
Title Page
Abstract Introduction
Conclusions References
Tables Figures
◭ ◮
◭ ◮
Back Close
Full Screen / Esc
Printer-friendly Version
Interactive Discussion
Discussion
P
a
per
|
D
iscussion
P
a
per
|
Discussion
P
a
per
|
Discuss
ion
P
a
per
|
Fig. 2. Overview of our new ozone cross-sections data in the UV/VIS/NIR measured at 11
AMTD
6, 6613–6643, 2013High spectral resolution ozone absorption – Part 2
A. Serdyuchenko et al.
Title Page
Abstract Introduction
Conclusions References
Tables Figures
◭ ◮
◭ ◮
Back Close
Full Screen / Esc
Printer-friendly Version
Interactive Discussion
Discussion
P
a
per
|
D
iscussion
P
a
per
|
Discussion
P
a
per
|
Discuss
ion
P
a
per
|
Fig. 3. Temperature dependence of the new experimental cross-sections in the UV region:
AMTD
6, 6613–6643, 2013High spectral resolution ozone absorption – Part 2
A. Serdyuchenko et al.
Title Page
Abstract Introduction
Conclusions References
Tables Figures
◭ ◮
◭ ◮
Back Close
Full Screen / Esc
Printer-friendly Version
Interactive Discussion
Discussion
P
a
per
|
D
iscussion
P
a
per
|
Discussion
P
a
per
|
Discuss
ion
P
a
per
|
Fig. 8.Ozone cross-sections in the Chappuis and Wulf bands at different temperatures:(a)near maximum of the Chappuis band, squares – El Helou et al. (2005), circles – Anderson and Mauersberger (1987), red dashed line – Bogumil et al. (2003) and Chehade et al. (2012), light blue solid lines – BMD, dash-dot line – Burkholder et al. (1994), black solid lines – this work;
AMTD
6, 6613–6643, 2013High spectral resolution ozone absorption – Part 2
A. Serdyuchenko et al.
Title Page
Abstract Introduction
Conclusions References
Tables Figures
◭ ◮
◭ ◮
Back Close
Full Screen / Esc
Printer-friendly Version
Interactive Discussion
Discussion
P
a
per
|
D
iscussion
P
a
per
|
Discussion
P
a
per
|
Discuss
ion
P
a
per
|