to r. u fc. b r 1984-2201
Copyright © 2002, Universidade Federal do Ceará
SURFACE TEMPERATURE AND ALBEDO IN
THE ILHA SOLTEIRA REGION, SÃO PAULO
(*) CORRESPONDING AUTHOR
Address: ICAT-UFAL, Av. Lourival Melo Mota, s/n, Tabuleiro dos Martins, Maceió - AL, Brasil. CEP 57072-900. Tel: (+55 82) 3214-1369 E-mail: [email protected]
ABSTRACT
The main purpose was to perform a dynamic analysis in the ields of soil heat lux, albedo and surface
temperature, with a 10-year interval, for the region of Ilha Solteira. The data used were obtained through multispectral images from TM Landsat 5’s sensor, corresponding to orbit 222, point 74, for May 13, 2000 and April 10, 2011. Using the results obtained, the surface albedo was estimated with minimum values of
3.7% and a maximum of 53.2% for May 13, 2000 and minimum values of 2.0 and a maximum of 58.4% for April 10 2011, showing an increase in the surface relexivity of the study area. With the increase of
the surface albedo, the mean surface temperature rose from 24.5°C, in 2000, to 25.2°C, in 2011, a rise of
0.7°C. For soil heat lux, the variations were of 62.9 W.m-2 in May 13, 2000, to 58.0 W.m-2 in April 10,
2011, revealing a greater heat retention in the soil.
Keywords: Remote Sensing, Vegetation, Surface Temperature.
RESUMO/RESUMEN
TEMPERATURA DA SUPERFÍCIE E ALBEDO NA REGIÃO DE ILHA SOLTEIRA, SÃO PAULO O principal objetivo foi realizar análise dinâmica nos campos de luxo de calor no solo, albedo e tempe -ratura da superfície com intervalo de 10 anos, para a região de Ilha Solteira. Os dados utilizados foram obtidas através de imagens multiespectrais do sensor TM Landsat 5 correspondentes a órbita 222, ponto 74, para 13/05/2000 e 10/04/2011. Mediante os resultados obtidos, o albedo da superfície foi estimado
com valores mínimos de 3,7% e máximos de 53,2% para o dia 13/05/2000 e valores mínimos de 2,0% e 58,4% para o dia 10/04/2011 constatando um aumento na reletividade da superfície da área de estudo.
Com o aumento do albedo da superfície, o valor médio da temperatura da superfície passou de 24,5ºC,
em 2000, para 25,2ºC, em 2011, o que nos mostra uma elevação de 0,7ºC. Para o luxo de calor no solo, as variações foram de 62,9 W.m-2 em 13/05/2000 para 58,0 W.m-2 em 10/04/2011 evidenciando uma
maior retenção de calor no solo.
Palavras-chave: Sensoriamento Remoto, Vegetação, Temperatura da Superfície.
TEMPERATURA DE LA SUPERFICIE Y ALBEDO EN LA REGIÓN DE ISLA SOLTERA, SÃO PAULO
El principal objetivo fue realizar análisis dinámico en los campos de lujo de calor en el suelo, albedo y temperatura de la supericie con intervalo de 10 años, para la región de Ilha Solteira. Los datos utilizados
fueron obtenidos a través de imágenes multiespectrales del sensor TM Landsat 5 correspondientes a la órbita 222, punto 74, para 13/05/2000 y 10/04/2011. En los resultados obtenidos, el albedo de la
super-icie fue estimado con valores mínimos y máximos de 3,7% y 53,2% para el día 13/05/2000, y valores mínimos y máximos de 2,0% y 58,4% para el día 10/04/2011, constatando un aumento en la relectancia de la supericie en el área de estudio. Con el aumento del albedo de la supericie, el valor medio para la temperatura de la supericie pasó de 24,5ºC, en 2000, a 25,2ºC, en 2011, lo que nos muestra una elevación de 0,7ºC. Para el lujo de calor en el suelo, las variaciones fueron de 62,9 W.m -2 en 13/05/2000 a 58,0 W.m -2 para el día 10/04/2011, evidenciando una mayor retención de calor en el suelo.
Palabras claves: Teledetección, Vegetación, Temperatura de la supericie. (a) Phd. in Meteorology, Instituto de Ciências Atmosféricas (ICAT/UFAL). http://lattes.cnpq.br/5514144631922874 (b) MSc.in Meteorology, Instituto de Ciências Atmosféricas (ICAT/UFAL). http://lattes.cnpq.br/1201692883506898 (c) Phd. in Meteorology, Instituto de Ciências Atmosféricas (ICAT/UFAL). http://lattes.cnpq.br/1798232201205174 (d) MSc. in Meteorology, Instituto de Ciências Atmosféricas (ICAT/UFAL). http://lattes.cnpq.br/8873800903145303
A rti cl e h is tor y: Re ce ive d 22 A pri l, 2017 A cc ept
ed 20 M
ay , 2017 P ubl is he r 15 A ugus t, 2017
GOMES, Heliofabio Barros;a * CAVALCANTE, Lucas Barbosa; b
w
w
w
.me
rca
to
INTRODUCTION
The use of Orbital Remote Sensing is considered a breakthrough in the study of urban envi-ronments and ecosystems due to its ability to work on regional scales, at a low economic cost, and its functionality and speed in data collection. In addition, when compared with traditional methods, it is capable of making a permanent registration of the area or object of study with a high degree of accuracy (FERREIRA et al., 2001).
It is known that the growth of urban areas and agricultural land use modiies the characteristics
of the local climate, altering the patterns and the magnitude of the interaction between solar radiation
and the soil and, consequently, the energy exchange processes in the soil-plant-atmosphere system
(GARTLAND, 2008).
In this context, the modiications caused by the installation of the Ilha Solteira Hydroelectric
Power Plant in 1978 caused profound changes in the region of the homonymous municipality, both in its geography and in the way of life of its inhabitants and, principally, in its environmental com-position. In the case of the latter, the remaining native vegetation was, for the most part, devastated
during the occupation of the area, being replaced by anthropic ields and pastures (SILVA, 1991
and FREITAS-LIMA et. al., 1997). As the suppression of vegetation favors the incidence of solar rays on the surface and raises the temperature (CASTRO et. al., 2013), it is important to study the behavior of the temperature at the site and apply this information to improve agricultural produc-tivity, as well as the urban planning of the locality (COELHO, 2004).
In this regard, the present work aims to estimate the albedo, the earth’s surface temperature
and the soil heat lux on two days, over a period of 11 years, for the region of Ilha Solteira/SP. To
this end, data from images of Thematic Mapper’s sensor aboard the satellite Landsat 5 were used
in conjunction with a number of variables collected in the ield and using the SEBAL algorithm
(Surface Energy Balance Algorithm for Land), proposed by Bastiaanssen (1995).
MATERIALS AND METHODS
AREA OF STUDY
The study area covers the city of Ilha Solteira/SP (20°25’58’’S; 51°20’33’’W; 335m), and is
part of the Mesoregion of Araçatuba, in the administrative region of Andradina. In the state of São Paulo, it has geographical boundaries with the municipalities of Itapura, Pereira Barreto, Suzanó-polis, Rubinénia and Andradina. In the state of Mato Grosso do Sul it borders the municipalities
of Três Lagoas and Selvíria. It has an area of 659.4 Km² and is bathed by the Paraná River (West),
and the Tietê (South) and São José dos Dourados (Center) Rivers (IBGE, 2008).
CLIMATE AND VEGETATION
The climate of the municipality is classiied as tropical rainforest, characterized by summer rains and drought in winter. The annual mean temperature is 28°C, with the mean annual maximum reaching 31°C, and a pluviometric index of 1.300mm per year (PMIS, 2014).
Formations of tropical broadleaf forest, humid forest, broadleaf forest, and cerrado compose the remaining natural vegetation. Most of this original cover was devastated during the occupation
of the land and currently anthropic ields and pastures represent the main soil cover (SILVA, 1991).
RADIOMETRIC DATA
to
r.
u
fc.
b
r
Thematic Mapper – TM, aboard the satellite Landsat 5, and a few additional surface data. The Landsat 5 – TM images used in the study were obtained from the DGI (Division of Images Generation) of the INPE (National Institute for Space Research), and consist of orbit 222 and point 074, obtained
at approximately 12:57:50 and 13:11:53, on 13 May 2000 and 10 April 2011, respectively. These
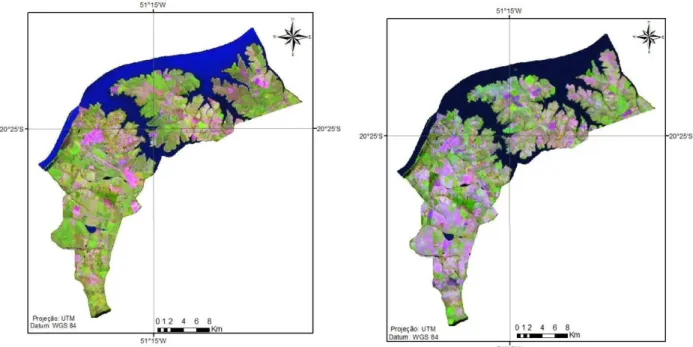
days were selected due to the absence of cloud coverage over the study area during the passage of Landsat 5 over it, as well as the images being collected in the same season (autumn) and at an interval superior to 10 years. They are composed of 07 spectral bands, whose main characteristics are described in Table 1. The cutouts of the days selected for the study are represented in images
of RGB composition for bands 4, 3, 2 of the TM sensor (igures 1a and 1b).
Table 1 - Description of the bands of the Thematic Mapper (TM) of Landsat 5, with the corresponding intervals of wavelength, calibration coeicients (minimum radiance – a; and maximum – b)
and spectral irradiances at the top of the atmosphere (TOA)
Description of the Bands
Calibration Coeicients (Wm−2sr −1ìm −1)
Spectral Irradiance at the TOA
Kλi(Wm−2ìm −1) Processing Date
From 01/March/1984 to 04/ May/2003
From 05/ May/2003
Lmin=a Lmax=b Lmin=a Lmax=b
Band 1 (blue) -1,520 152,100 -1,520 193,000 1957
Band 2 (green) -2,840 296,810 -2,840 365,000 1826
Band 3 (red) -1,170 204,300 -1,170 264,000 1554
Band 4 (IV near) -1,510 206,200 -1,510 221,000 1036
Band 5 (IV medium) -0,370 27,190 -0,370 30,200 215
Band 6 (IV thermal) 1,2378 15,303 1,2378 15,303
-Band 7 (IV medium) -0,150 14,380 -0,150 16,500 80,67
Fonte: Chander; Markram, 2003.
Air temperature data were collected from UNESP’s station of in Ilha Solteira (20°25’24,4’’S;
51°21’13,1’’W; 337m), and registered 23.9°C for 13 May 2000, and 24.8°C for 10 April 2011.
w
w
w
.me
rca
to
IMAGE PROCESSING
The processing of the satellite images was performed with the ERDAS Imagine 2014 and QGIS 2.14 software, and the mathematical operations for the intra and inter spectral bands with
the Model Maker tool. The TM – Landsat 5 measures the spectral radiance of each pixel in seven diferent spectral bands, and stores them in digital form; their intensity varies from 0 to 255 (8 bits). The images of the TM sensor have a spatial resolution of 30m x 30m in bands 1, 2, 3, 4, 5 and 7, and of 120m x 120m in band 6, which must be resampled in the pre-processing in order to have the same spatial resolution of the other bands so that they will it during the staking process. The
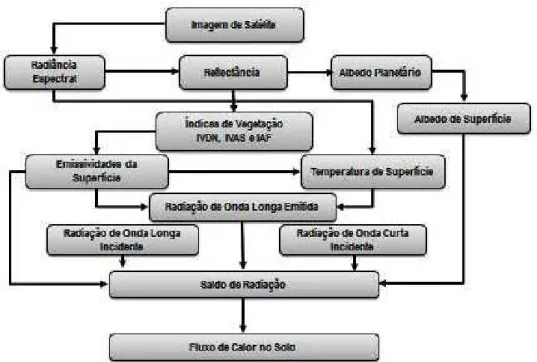
TM sensor measures the spectral radiance of the targets and stores them in the form of gray levels or digital numbers, whose values vary from 0 to 255 (8 bits). The SEBAL algorithm was used for the processing and development of the images (Figure 2).
Figure 2 – Diagram of the SEBAL algorithm steps used in the study. Source: Adapted from Gomes et. al. (2009)
RADIOMETRIC CALIBRATION – STEP 1
This consists of the calculation of the spectral radiation in each band (Lλi), in which the digital number of each pixel of the image is converted into monochrome spectral radiance. This radiance represents the solar energy relected by each pixel, per area unit, time, solid angle and wavelength,
measured at Landsat satellite level for bands 1, 2, 3, 4, 5, 7 and, for band 6, the calibration is carried out according to Markham and Baker (1987).
ND 255
a b a
L i i i
λi
(1)
Where: a and b are the minimum and maximum spectral radiances (Wm2sr1μm1 , Table 1);
ND is the intensity of the pixel (digital number – whole number from 0 to 255); and i corresponds
to r. u fc. b r
MONOCHROMATIC REFLECTANCE – STEP 2
This was deined as being the ratio between the relected radiation lux and the incident radia
-tion lux, obtained according to the equa-tion (ALLEN et. al., 2002):
λi r λi λi d . cos . k L . π ρ Z (2)
Where “Lλi” is the spectral radiance of each band, k λi is the spectral solar irradiance of each
band at the top of the atmosphere (Wm2 μm1 , Table 1), Z is the solar zenith angle (in degrees,
with Z = 90 – E, and E = elevation angle) and dr is the square of the ratio between the average distance Earth—Sun (ro) and the distance Earth-Sun (r) on a given day of the year (DSA) which, according to Iqbal (1983), is given by:
Γ 2 sen 0,000077 Γ 2 cos 0,000719 senΓ 0,001280 cosΓ 0.034221 1,000110 2 r r o (3)
Where:
Γ
360
(DJ
1)
/
365)
(o) and DJ is the Julian day. On 24 September 2000 we had DJ = 267, dr = 0.9935 and Z= 31.5719 and, for 06 October 2010 we obtained DJ = 279, dr = 1.005 and Z = 26.9799.PLANETARY ALBEDO – STEP 3
O albedo planetário, também conhecido como albedo não corrigido, é obtido através da
com-binação linear das relectâncias monocromáticas, qual seja:
7 5 4 3 2 1
toa 0,293ρ 0,274ρ 0,233ρ 0,157ρ 0,033ρ 0,011ρ
α (4)
Where ρ1,ρ2,ρ3,ρ4,ρ5 e ρ7 are the monochromatic relectances of bands 1, 2, 3, 4, 5 and 7.
onde são as relectâncias monocromáticas das bandas 1, 2, 3, 4, 5 e 7.
ATMOSPHERIC TRANSMISSIVITY – STEP 4
Under clear sky conditions, it can be obtained as in Allen et. al. (2002):
z 2.10 0,75 τ 5 sw
(5)
Where: z is the altitude of each pixel, in meters, for the study area the result was a value of τsw = 0.75858; considering the area’s average altitude of 419 meters (IBGE). For the purpose of
this study, the average altitude was considered for the entirety of the study terrain, thus obtaining a constant atmospheric transmissivity for the whole area.
SURFACE ALBEDO – STEP 5
The surface albedo is the albedo corrected of atmospheric efects:
2 sw p toa τ α α α
(6)
-w w w .me rca to
ric transmissivity, obtained for clear sky conditions in relation to the altitude of each pixel, in an
equation proposed by Allen et. al. (2002).
NDVI, SAVI AND LAI – STEP 6
The Normalized Diference of Vegetation Index, NDVI, is an important element for the study of climatic changes, using vegetation as the calculation index, attributing a determined value to the
study area that will depend on the current state of the vegetation (LOPES and VALERIANO, 2010).
The Normalized Diference of Vegetation Index is obtained from the ratio between the dife
-rence of the near-infrared relectivity ( IV ρ ) and the red ( V ρ ), and their sum:
V IV V IV ρ ρ ρ ρ NDVI (7)
Where ρIV e ρV correspond, respectively, to bands 4 and 3 of Landsat 5 – TM.
The NDVI acts as a sensitive indicator of the amount and condition of green vegetation. Its values vary from -1 to +1. For surfaces with some vegetation, the NDVI varies from 0 and 1; for water and clouds the NDVI is generally lower than zero.
The SAVI (Soil-adjusted Vegetation Index) is an index that seeks to mitigate the “background” efects of the soil. It is calculated using the following equation (HUETE, 1988):
) ρ ρ (L ) ρ L)(ρ (1 SAVI V IV V IV (8)
The LAI, Leaf Area Index is deined by the ratio between the leaf areas of all the vegetation per unit of area occupied by this vegetation. This index is a good indicator of the biomass of each image pixel, being calculated by the empirical equation proposed by Allen et. al. (2002):
0,91 0,59 SAVI 0,69 ln IAF (9)
EMISSIVITY – STEP 7
The inverted Planck equation is used to obtain the surface temperature, valid for a blackbody.
As each pixel does not emanate electromagnetic radiation as a blackbody, it is necessary to intro
-duce each pixel’s emissivity into the spectral domain of the thermal band εNB , namely: 10.4 – 12.5
μm. In turn, when calculating the long wave radiation emitted by each pixel, the emissivity in the broadband domain (5 – 100 μm) is considered. According to Allen et. al. (2002), the emissivity
NB
ε (3.9) and ε0 (3.10) can be obtained, for NDVI > 0 and IAF < 3, by:
IAF 0,00331 0,97
εNB (10)
IAF 0,01 0,95
ε0 (11)
For pixels with IAF3, εNBε00,98. For bodies of water (NDVI<0), in the case
of Sobradinho Lake and the São Francisco Riverbed, Silva & Cândido (2004) used values of
NB
ε 0,99 e ε0 0,985,
to r. u fc. b r
SURFACE TEMPERATURE – STEP 8
The spectral radiance of the thermal band Lλ,6 and the emissivity εNB obtained in the previous
step were used to obtain the surface temperature (Ts). Thus, the surface temperature (K) (3.11) is
obtained through the following expression:
1 L K ε ln K T λ,6 1 NB 2 s (12)
Where K1
1 1
2 μm
sr
Wm
607,76
e K2 1260,56K are calibration constants of the thermal
band of Landsat 5 – TM (ALLEN et. al., 2002). In May 13, 2000, the result obtained was Ta 297.05 K, and for April 10, 2011 it was 297.95 K.
OUTGOING LONGWAVE RADIATION – STEP 9
The outgoing longwave radiation emitted from the surface RL (Wm )
2
is obtained through the Stefan-Boltzmann equation:
4 s 0
L ε .σ.T
R (13)
Where ε0 represents the emissivity of each pixel,
σ
is the Stefan-Boltzmann constant )K
Wm
5,67.10
(σ 8 2 4 and Ts is the surface temperature (K)
INCIDENT SHORTWAVE RADIATION – STEP 10
The incident shortwave radiation Rs (Wm )
2
is the lux of direct and difuse solar radiation that hits the Earth’s surface, which, for clear sky conditions is given by the following expression
(ALLEN et. al., 2002):
sw r
s S.cos .d .τ
R Z
(14)
Where S is the solar constant (1367 Wm2)
, Z is the solar zenith angle, dr is the inverse of the
square of the relative Earth-Sun distance, and τsw is the atmospheric transmissivity. Rs can be considered constant throughout the study area, when the area is small in size.
INCIDENT SHORTWAVE RADIATION – STEP 11
The incident shortwave radiation emitted by the atmosphere towards the surface RL (Wm )
2
can be calculated by the Stefan-Boltzmann equation:
4 a a
L ε .σ.T
R
(15)
Where εa represents the atmospheric emissivity obtained by:
0,09 sw
a 0,85.( lnτ )
ε (ALLEN
w
w
w
.me
rca
to
Onde é a emissividade atmosférica obtida por: (ALLEN et al., 2002), é a constante de
Stefan--Boltzman e Ta é a temperatura do ar (K).
RADIATION BALANCE – STEP 12
The radiation balance for surface Rn (Wm )
2
is calculated using the following equation of surface radiation balance:
Rs Rs RL RL o RL
Rn
(1
)(16)
Where Rs is the incident shortwave radiation,
is the corrected albedo of each pixel, RLis the longwave radiation emitted by the atmosphere in the direction of each pixel, is the longwave radiation emitted by each pixel, and
o is the emissivity of each pixel.SOIL HEAT FLUX (G) – STEP 13
The soil heat lux, G, (Wm-2) can be obtained according to the empirical equation developed by Bastiaanssen (2000), which represents values close to mid-day:
Rn ) NDVI 0,98 )(1 α 0.0074 α
(0,0038 α
T
G s 2 4
(17)
Where Ts is the surface temperature (°C),
is the surface albedo, and NDVI is theNormali-zed Diference of Vegetation Index, all computed pixel by pixel. For the purpose of correction of the heat lux values for bodies of water (NDVI<0), the following expression can be utilized G = 0.3Rn,
used by Silva & Cândido (2004) and G = 0.5Rn, according to Allen et. al., (2002) for deep lakes.
RESULTS AND DISCUSSION
SURFACE ALBEDO
Table 2 shows the Instantaneous Surface Albedo values of the region for the days under study.
For May 13, 2000, the values found presented a mean of 15.1%, a minimum of 3.7%, a maximum
of 53.2% and a standard deviation of ± 3.8. April 10, 2011, presented mean values of 14.0%, a
maximum of 58.4%, a minimum of 2.0% and a standard deviation of ± 3.2.
Table 2 – Surface Albedo Values (in %) minimum, maximum, mean and standard deviation for 13/May/2000 and 10/April/2011
Surface Albedo (%) Minimum Maximum Mean Standard Deviation 13.May.2000 3.7 53.2 15.1 ± 3.8 10.April.2011 2.0 58.4 14.0 ± 3.2
to
r.
u
fc.
b
r
from 3% to 10% for a small zenith angle and 10% to 50% for a large zenith angle; the values for
exposed dry soil were 20% to 35% and exposed humid soil 10% to 20%.
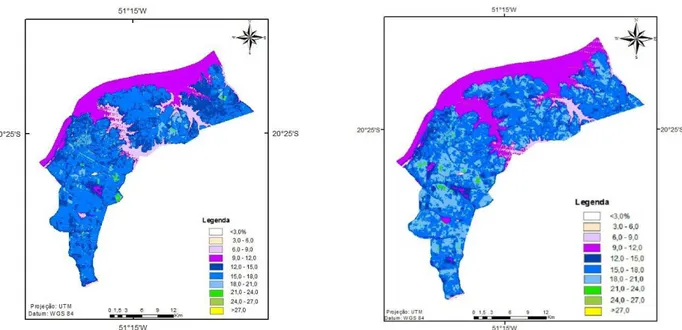
In igure 3(a) and table 3, for May 13, 2000, it was observed that the most common albedo va -lues ranged between 15.0% and 18.0%, shown in the medium blue color, which represented 43.29%
of the image pixels. The second largest type of occurrence was the interval represented by the light
blue color, between 18.0 and 21.0%, and with 20.67% of the occurrences. The values referring to
bodies of water had indexes between 3.0% and 12.0%, representing 25.57% of the data obtained. For igure 3(b) and table 3, referring to April 10, 2011, it was observed that the highest value remained the interval between 15.0% and 18.0%, the medium blue color, with 43.98% of the pixels.
The second most frequent occurrence was the interval between 12.0% and 15.0%, with 24.02% of the data. Bodies of water moved from the interval between 6.0% and 9.0%, light pink color, to the interval between 9.0% and 12.0%, dark pink color, representing 26.45% of the total.
.
Figure 3 – Images classiied of the Surface Albedo (in %), (a) for 13/May/2000 and (b) for 10/April/2011
Table 3 – Distribution of surface albedo values (in %) for 13/May/2000 and 10/April/2011
Surface Albedo (%)
<3 03-06 06-09 09-12 12-15 15-18 18-21 21-24 24-27 >27
2000 0 0.24 6.03 19.3 9.44 43.29 20.67 0.98 0.03 0.02 2011 0 0.21 7.64 18.6 24.02 43.98 4.83 0.64 0.06 0.02
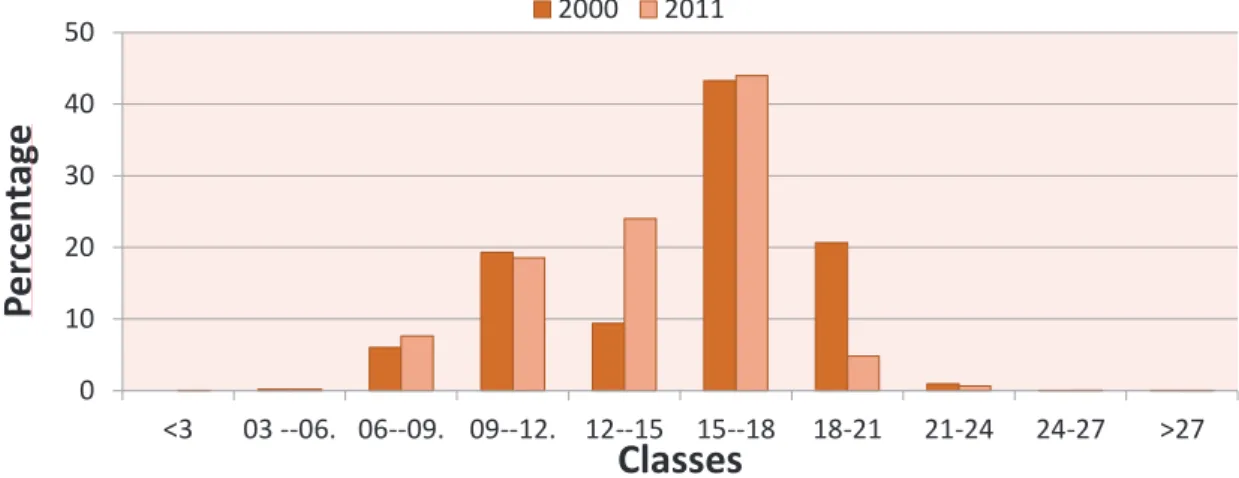
For the analysis of the two days studied, the Surface Albedo registered a variation of 9.7%
in maximum values, -7.2% in the mean, and 46% in the minimum. The increase of the maximum
values may have been caused by growth in urbanization or by the replacement of native forest areas by pastures or agricultural crops. In turn, the decrease of the mean may have been caused by
the occurrence of rainfall in the days prior to the passage of the satellite. Below, igure 4 shows the
w
w
w
.me
rca
to
0 10 20 30 40 50
<3 03 --06. 06--09. 09--12. 12--15 15--18 18-21 21-24 24-27 >27
Pe
rc
en
ta
ge
Classes
2000 2011
Figure 4 - Comparative histogram of Surface Albedo frequencies for the two images used
a) Surface Temperature
For May 13, 2000, the surface temperature values found presented a mean of 24.5°C, with
a minimum of 18.0°C, a maximum of 34.5°C and a standard deviation of ± 2.2. In turn, April 10, 2011, presented mean values of 25.2°C, a maximum of 40.5°C, a minimum of 21.1°C and a standard
deviation in ± 2.1. Table 4 shows the estimated values for surface temperature..
Table 4 – Surface Temperature Values in (°C), minimum, maximum, mean and standard deviation for 13/May/2000 and 10/April/2011
Surface Temperature (%) Minimum Maximum Mean Standard Deviation
13.May.2000 18.0 34.5 24.5 ± 2.2 10.April.2011 21.1 40.5 25.2.0 ± 2.1
For locations with water, while studying the Botucatu/SP region Mashiki (2012) found mean temperatures of 20.9°C, whilst Bias et. al. (2003) found values between 17°C and 18°C. Gomes et. al. (2009), for the region of Santa Rita do Passa Quatro/SP found values between 20.0°C and
24.1°C for looded plantation areas and between 26.9°C and 25.0°C for locations with sugarcane
plantations. Lima (2008), near Campo Grande/MS, found temperatures for pasture areas from 19°C to 29°C, for temporary crops from 19°C to 29°C, for forest areas from 13°C to 17°C and for
silviculture between 14°C and 17°C. According to Godoy et. al. (2009), locations of exposed soil ranged from 25°C to 48°C. The diferences between forest areas outside the urban perimeter and
those located in central regions were of up to 20°C (COSTA et. al., 2009).
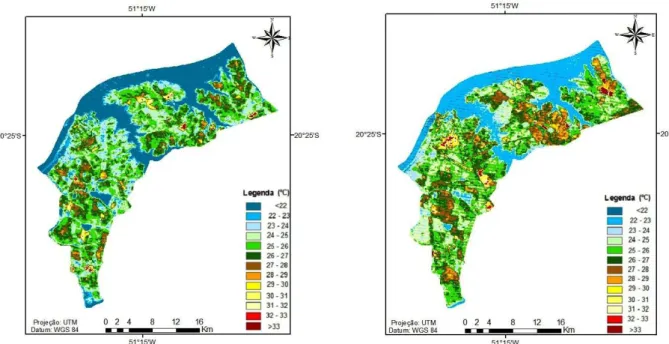
Figure 5(a) and table 5 show the values found for surface temperature on May 13, 2000. The greatest occurrence was for values lower than 22°C, the dark blue color, answering for 24.1% of
the image pixels and corresponding, largely, to regions with water. The second largest interval was
the one with values that ranged between 24°C and 25°C, answering for 13.9%, the light green color.
In turn, the smallest index was for temperatures higher than 33°C, in dark red.
Figure 5(b) and table 5 represent the behavior of surface temperature for April 10, 2011, in
which the greatest frequency was the index between 25°C and 26°C, in medium green, answering for
21.0%. The second largest interval found ranged between 22°C and 23°C, in light green, answering
to
r.
u
fc.
b
r
Figure 5 – Classiied image of the estimated Surface Temperature for (a) 13/May/2000 and (b) 10/April/2011
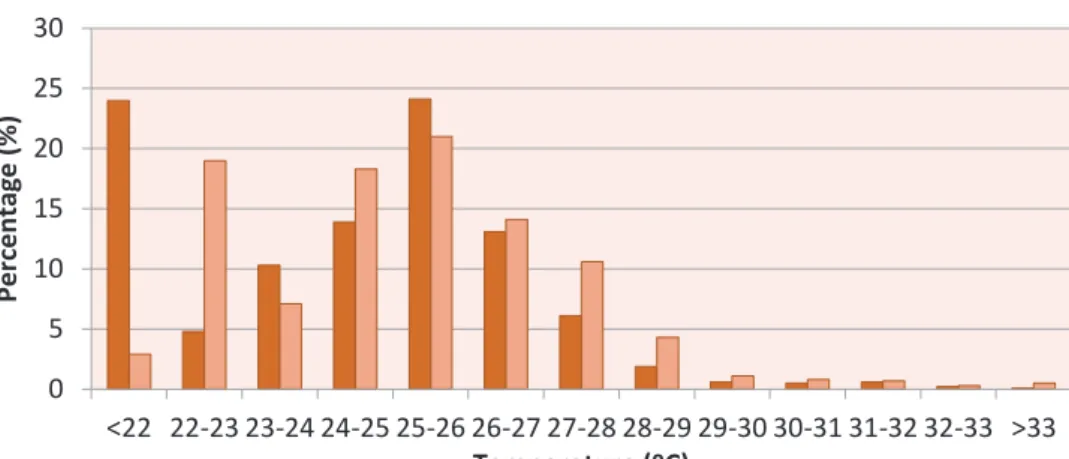
Table 5 – Distribution of surface temperature values (in %) for 13/May/2000 and 10/April/2011
Surface Temperature (ºC)
T <22 22-23 23-24 24-25 25-26 26-27
2000 24 4,8 10,3 13,9 24,1 13,1
2011 2,9 19 7,1 18,3 21 14,1
T 27-28 28-29 29-30 30-31 31-32 32-33 >33
2000 6,1 1,9 0,6 0,5 0,6 0,2 0,1
2011 10,6 4,3 1,1 0,8 0,7 0,3 0,5
The diference between the mean temperatures was 0.7°C (increase of 2.8%), the minimum rose 3.2°C (18%) and the maximum 6.1°C (17.7%), in other words, for both days analyzed there
was an increase in temperature values. On both dates, sites with water presented the lowest
tem-perature value among the classes. This occurs, most likely, due to its high speciic heat (1cal/g°C),
which requires a large amount of energy to change its temperature. In turn, the increase in the mean temperature values is noteworthy, which rose from 22°C to 22°C-23°C. This may be due either to natural causes or by the silting of riverbeds, which would diminish the water line and hinder heat dissipation. Observing the images, the lowest temperature values occurred in areas that presented
denser vegetation cover and, in contrast, locations with exposed soil and anthropized areas presen
-ted the highest temperature values. Below, igure 6 shows the comparative histogram of Surface
w
w
w
.me
rca
to
0 5 10 15 20 25 30
<22 22-23 23-24 24-25 25-26 26-27 27-28 28-29 29-30 30-31 31-32 32-33 >33
Pe
rc
en
ta
ge
(%
)
Temperature (ºC)
2000 2011
Figure 6 - Comparative histogram of surface temperature frequencies for both images used
b) Soil heat lux
For May 13, 2000, the values found for soil heat lux had a mean of 48.4 W.m-2, a minimum of 0.9 W.m-2, a maximum of 62.9 W.m-2 and a standard deviation of ± 4.3. In turn, April 10, 2011, presented mean values if 58.0°C, a maximum of 89.3 W.m-2, a minimum of 1.2 W. m-2, 88.1 W.m-2, and a standard deviation of 6.1 W.m-2. Table 6 shows the values collected for the days under study.
Table 6 – Values of soil heat lux (in W.m-2) (minimum, maximum, mean and standard deviation) for May 13, 2000 and April 10, 2011
Data Mínimo Máximo Média Desvio Padrão 13/05/2000 0,9 62,9 48,4 4,3 10/04/2011 1,2 89,3 58,0 6,1
For the region of Conquista/MG, Andrade (2008) obtained mean values for soil heat lux of 81.91 W/m², a minimum of 45.66 W/m², and a maximum of 269.47 W/m². For exposed soil, the same author found values between 50 W/m² and 100 W/m², for sugarcane of 50 W/m² to 250 W/ m² and, for water, values ranging between 150 W/m² and 300 W/m². Silva and Bezerra (2005),
while studying the region of Petrolina/PE and Juazeiro/BA found values for water surface areas
from 211.80 W/m² to 214.50 W/m² and, for soil heat lux, between 94.50 W/m² and 112.30 W/m².
Mendonça (2007), studying the northern part of Rio de Janeiro, obtained mean values of soil heat
lux from 31.90 W/m² to 96.51 W/m² for the months of fall/winter and for spring/summer from 72.93 W/m² to 43.69 W/m². According to this author, lower values appear in wetter areas and higher
values appear in urban areas and in those devoid of vegetation.
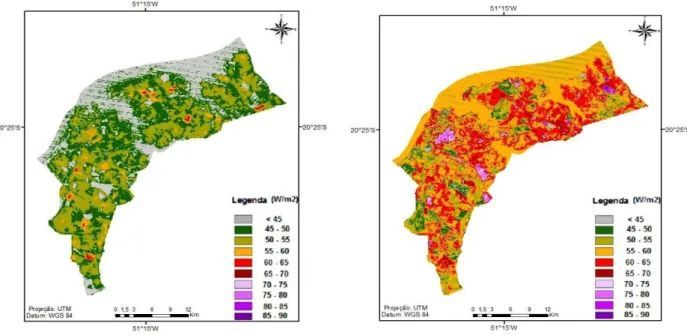
Figure 7(a) and table 7 show the values found for soil heat lux on May 13, 2000. The interval of greater occurrence was the one that ranged between 45 W/m² and 50 W/m², with 36.7% of the occurrences. The second most frequent interval was the light green colored, with lux from 50 W/m² to 55 W/m². The areas with water were classiied in grey and had values under 45 W/m², answering for 24.8% of the occurrences. There were no values greater than 65 W/m². The zone between the values 60 W/m² and 65 W/m², the light red color, only had 0.5% of occurrences.
Figure 7(b) and table 7 show the behavior presented by soil heat lux for April 10, 2011. In this image, it can be seen that the interval with the highest value was from 55 W/m² to 60 W/m², which
answered for 41.2% of the occurrences and is represented by the color orange. The second largest
occurrence was colored red, from 60 W/m² to 65 W/m², answering for 20.6% of the data. Areas with water were classiied in orange with values between 50.0 W/m² and 55.0 W/m², answering for 19.4% of the occurrences. The smallest interval found was for values between 85 W/m² and 90 W/m², answering for 0.1% of the occurrences
.
to
r.
u
fc.
b
r
Figure 7 – Classiied image of soil heat lux estimated for (a) 13/May/2000 and (b) 10/April/2011
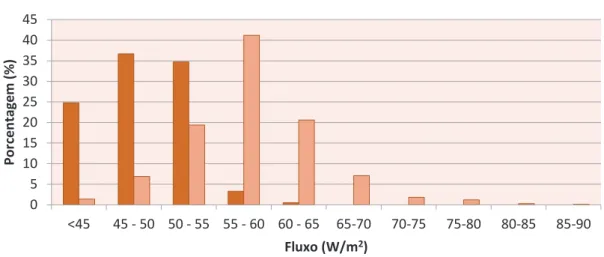
Table 7 – Distribution of soil heat lux values (in %) for 13/May/2000 and 10/April/2011
Fluxo de Calor no Solo
<45 45 - 50 50 - 55 55 - 60 60 - 65 65-70 70-75 75-80 80-85 85-90
2000 25 36,7 34,7 3,3 0,5 0 0 0 0 0
2011 1,4 6,9 19,4 41,2 20,6 7,1 1,8 1,2 0,3 0,1
The values for soil heat lux were a minimum of 3.5%, a mean of 29.5% and a maximum of 21.5%. Observing the spatialization of the soil heat lux, it is possible to perceive lower values in
wetter areas (hydric bodies or vegetation with water retention) and higher ones in urban areas and
in areas devoid of vegetation. In the cutout, the increase in soil heat lux, abrupt in some regions, indicates the occurrence of heat islands. This occurs because without vegetation cover the exposed
soil has a high thermal amplitude, rapidly heating up during the day and increasing heat irradiation and the temperature in its surroundings. This warming can be easily seen in the images because of the time at which they were collected, 12:57:50 for 13/May/2000 and 13:11:53 for 10/April/2011, with a strong solar incidence over the surface. Below, Figure 8 shows the comparative histogram
of soil heat lux frequencies for both images used.
w
w
w
.me
rca
to
0 5 10 15 20 25 30 35 40 45
<45 45 - 50 50 - 55 55 - 60 60 - 65 65-70 70-75 75-80 80-85 85-90
Po
rc
en
ta
ge
m
(%
)
Fluxo (W/m2) 2000 2011
Figure 8 - Comparative histogram of soil heat lux frequencies for both images used
FINAL CONSIDERATIONS
The use of remote sensing allowed the identiication of diferences in spatial and temporal
patterns in response to soil use and occupation, and natural phenomena in regions close to rivers
and their areas of inluence.
In this study, the analysis of a small area proved to be advantageous, because it allowed the
monitoring and comparison of changes in soil heat lux, surface temperature and albedo in the
region of Ilha Solteira/SP, by means of estimates made from images collected by TM - Landsat 5, for two days, with an interval of 10 years between captures.
There was an increase in surface temperature, albedo and soil heat lux for the region of Ilha Solteira/SP. In the case of soil heat lux, this increase entails the emergence of heat islands, a phe -nomenon connected to the urbanization of the environment. In turn, the increase of the albedo and
of surface temperature is indicative of modiications in the region’s vegetation cover, whether due
to the suppression of native forests or the substitution of previously used agricultural crops.
The generated maps (surface temperature, soil heat lux and albedo) ofer data with potential
use by the general public and public authorities. They can also be used by NGOs that deal with urban planning and the formulation of public policies on infrastructure and environmental health, aiming to provide quality of life to the local population as well as assist in the planning of agro--pastoral activities for the region of Ilha Solteira.
BIBLIOGRAPHIC REFERENCE
ALLEN, R.; BASTIAANSSEN, W.; WATERS, R.; TASUMI, M.; TREZZA, R. Surface energy balance algorithms for land (SEBAL), Idaho implementation - Advanced training and users manual, version 1.0, 97p. 2002.
ARYA, S. P. Introduction to Micrometeorology . North Carolina: Academic Press, 1998.
BASTIAANSSEN, W.G.M. Regionalization of surface lux densities and moisture indicators in com -posite terrain. Ph. D. Thesis, Wageningen Agricultural. University, Wageningen, The Netherlands , 1995.
BASTIAANSSEN, W. G. M. SEBAL - based sensible and latent heat luxes in the irrigated Gediz Basin,
to
r.
u
fc.
b
r
BIAS, E.S.; BAPTISTA, G.M.M.; LOMBARDO, M.A.; Análise do fenômeno de ilhas de calor urbanas, por meio da combinação de dados landsat e ikonos. SIMPÓSIO BRASILEIRO DE SENSORIAMENTO REMOTO, 11, Belo Horizonte. Anais... São José dos Campos: INPE, 2003. p.1741 – 1748. 2003.
CASTRO, B. L.; FREITAS FILHO, E.; SILVA, L. R.; SANTIAGO, L. S.; INVENÇÃO, M. S. Avaliação da supressão da vegetação e aumento da temperatura em áreas agrícolas do Oeste Baiano entre os anos de 1990 e 2010 por meio dos dados LANDSAT/TM. SIMPÓSIO BRASILEIRO DE SENSORIAMENTO REMOTO, 16. (SBSR), 2013, Foz do Iguaçu. Anais... São José dos Campos: INPE, 2013.
CHANDER, G.; MARKHAM, B. Revised Landsat-5 TM Radiometric Calibration Procedures and Postca-libration Dynamic Ranges. IEEE Transactions on Geoscience and Remote Sensing, v, 41, n. 11, 2003. COELHO, A. C. P. Agregação de novas variáveis ao processo de planejamento urbano e regional sob a perspectiva de gestão dos recursos hídricos. Curitiba. Dissertação (Curso de Pós-Graduação em En-genharia de Recursos Hídricos e Ambiental) Setor de Tecnologia, Universidade Federal do Paraná. 2004.
COSTA, D. F.; PERES, L. F.; SILVA, R. S. Identiicação de ilhas de calor na área urbana de Ilha Solteira-SP
através da utilização de geotecnologias. XIV SIMPÓSIO BRASILEIRO DE SENSORIAMENTO REMOTO, 2009, Natal. Anais... Natal, RN: INPE, p.647-653. 2009.
FERREIRA, M.E.; ANDRADE, L. R. M.; SANO, E.E; CARVALHO, A. M. Uso de processadores de imagens
digitais na avaliação da taxa de cobertura doo solo. CONGRESSO BRASILEIRO DA CIENCIA DO SOLO, 28., 2001, Londrina. Ciência do solo: Fator de produtividade competitiva com sustentabilidade;[resumos]. Londrina: Sociedade Brasileira de Ciência do Solo:Embrapa Soja, p. 284. 2001.
FREITAS LIMA, E.A.C. Estudo da paisagem do Município de Ilha Solteira SP: subsídios para o plane-jamento físico ambiental. São Carlos, 107p. Tese (Doutorado em Ciências) – Centro de Ciências Biológicas e da Saúde, Universidade Federal de São Carlos. 1997.
GARTLAND, L. Heat islands: understanding and mitigating heat urban areas. Published by Earthscan. UK and USA. 215p. 2008.
GODOY, L. B; BAPTISTA, G. M. M; ALMEIDA, T. Relação entre vegetação e temperatura de superfície nos parques urbanos do Distrito Federal, por meio de dados ASTER. In: SIMPÓSIO BRASILEIRO DE SENSORIAMENTO REMOTO, 14, 2009. Natal. Anais... São José dos Campos: INPE, p. 699 – 705, 2009. GOMES, H. F., SILVA, B. B. da, CAVALCANTI, E. P., ROCHA, H. R. Balanço de radiação em diferentes biomas no estado de São Paulo mediante imagens Landsat 5. Geociências, v.28, p.153-164, 2009.
HUETE, A. R. Soil inluences in remotely sensed vegetation-canopy spectra. Theory and Applications of Optical Remote Sensing. 1 ed. New York, Ed. John Wiley & Sons. 1989.
IBGE – Instituto Brasileiro de Geograia e Estatística, 2007, IBGE Cidades, contagem populacional 2007,
Disponível em: http://www.ibge.gov.br/cidadesat/default.php, Acesso em 31 de janeiro de 2008.
LIMA, R. C. Identiicação das ilhas de calor na cidade de Campo Grande/MS utilizando o sensoriamento remoto. 2008, 69f. Trabalho de Conclusão de Curso (Graduação em Geograia Bacharelado) – Universidade Federal do Mato Grasso do Sul, Aquidauana, 2008.
LOPES, P.M.O.; VALERIANO, D.M. validação do albedo de superfície terrestre obtido dos dados do sensor MODIS em regiões montanhosas.Anais do XIII Simpósio Brasileiro de Sensoriamento Remoto. Floria-nópolis, Brasil, INPE, p. 2805-2812. 2007.
MARKHAM, B. L., BARKER, L. L. “Thematic mapper bandpass solar exoatmospherical irradiances”,
International Journal of Remote Sensing, v. 8, n. , pp. 517 - 523. 1987.
MASHIKI, M.Y.; Geoprocessamento na identiicação de ilhas de calor e inluência do uso e ocupação do solo na temperatura aparente da superfície no município de Botucatu/SP. 67p. Dissertação de Mes-trado em Agronomia/Energia na Agricultura - Faculdade de Ciências Agronômicas, Universidade Estadual Paulista. Botucatu-SP. 2012.
MENDONÇA, J. C.; FREITAS, R. M.; SOUSA, E. F. Avaliação temporal dos eventos de inundação da
Baixada Campista, Região Norte Fluminense, RJ, pelo uso de imagens digitais orbitais do sensor MODIS.
Revista Brasileira de Cartograia, Rio de Janeiro, v. 59, n. 03, p. 249/4-253, 2007.
w
w
w
.me
rca
to
QUERINO, C. A. S.; MOURA, M. A. L.; LYRA, R. F. da F.; MARIANO, G. L. Avaliação e comparação da radiação solar global e albedo com ângulo zenital na região amazônica. Revista Brasileira de Meteo-rologia, v.21, n.3a, 42-49, 2006.
SELLERS, W.D. Physical Climatology. University of Chicago. Chicago Press, Chicago, Illinois. 1969. SILVA, H.R. Avaliação dos principais fatores do meio físico do município de Pereira Barreto, SP, rela-cionado com a produção agropecuária, mediante o emprego de imagens aéreas. Ilha Solteira, 74p. (Relatório
do projeto de pesquisa apresentado para a Comissão Permanente de Regime de Trabalho com o im de ser
to
r.
u
fc.
b
r
w
w
w
.me
rca
to
r.
u
fc.
b
r