Magnetotail response during a strong substorm as observed
by GEOTAIL in the distant tail
A. Belehaki1, R. W. McEntire2, S. Kokubun3, T. Yamamoto4 1
Institute of Space Research, National Observatory of Athens, Metaxa and Vas. Pavlou Str., Palaia Pendeli, GR-152 36, Greece
2
The Johns Hopkins University, Applied Physics Laboratory, Laurel, MD 20723, USA
3Solar Terrestrial Environment Laboratory, Nagoya University, Toyokawa Aichi, 442, Japan 4
Institute of Space and Astronautical Science, Sagamihara, Kanagawa 229, Japan
Received: 24 July 1997 / Revised: 5 December 1997 / Accepted: 8 December 1997
Abstract. Simultaneous energetic particle and magnetic ®eld observations from the GEOTAIL spacecraft in the distant tail (XGSM )150 Re) have been analysed to study the response of the Earth's magnetotail during a strong substorm (AE680 nT). At geosynchronous altitude, LANL spacecraft recorded three electron injections between 0030 UT and 0130 UT, which cor-respond to onsets observed on the ground at Kiruna Ground Observatory. The Earth's magnetotail respond-ed to this substorm with the ejection of ®ve plasmoids, whose size decreases from one plasmoid to the next. Since the type of magnetic structure detected by a spacecraft residing the lobes, depends on theZextent of the structure passing underneath the spacecraft, GEO-TAIL is ®rst engulfed by a plasmoid structure; six minutes later it detects a boundary layer plasmoid (BLP) and ®nally at the recovery phase of the substorm GEOTAIL observes three travelling compression re-gions (TCRs). The time-of-¯ight (TOF) speed of these magnetic structures was estimated to range between 510 km/s and 620 km/s. The length of these individual plasmoids was calculated to be between 28 Re and 56 Re. The principal axis analysis performed on the magnetic ®eld during the TCR encountered, has con-®rmed that GEOTAIL observed a 2-D perturbation in the X-Z plane due to the passage of a plasmoid underneath. The ®rst large plasmoid that engulfed GEOTAIL was much more complicated in nature probably due to the external, variable draped ®eld lines associated with high beta plasma sheet and the PSBL ¯ux tubes surrounding the plasmoid. From the analysis of the energetic particle angular distribution, evidence was found that ions were accelerated from the distant
X-line at the onset of the burst associated with the ®rst magnetic structure.
Key words.Magnetospheric physics (magnetospheric con®guration and dynamics; magnetotail).
1 Introduction
The magnetospheric response during substorm distur-bances has been studied extensively over the last two decades using ground-based, geosynchronous satellite and spacecraft data sets. Several models have been proposed to describe the changes taking place in the magnetotail during substorms. Current magnetospheric models predict the formation of a plasmoid (Hones, 1976, 1979) in the near-Earth plasma sheet at the time of substorm onset. A plasmoid is a three-dimensional segment of the plasma sheet which is ejected down the magnetotail following substorm onset. According to Hones' (1976) model, the plasmoid consists of loops of closed magnetic ®eld lines formed by pinching o plasma sheet magnetic ®eld lines at a reconnection line. Once lobe magnetic ®eld lines begin to merge at the same line, the plasmoid is ejected tailward. The conven-tional plasmoid is depicted in theX-Zmeridional plane and is, therefore, two dimensional. Hughes and Sibeck (1987) proposed that if a dawn to dusk magnetic ®eld component is included in the standard plasmoid model, the resulting magnetic structure is a ¯ux rope. In the 3D model, reconnected plasma sheet ®eld lines form a magnetic ¯ux rope-like structure, which stretches across the tail, but whose ends are connected to the auroral ionosphere. When open lobe ®eld lines reconnect at the near-Earth neutral line, they form loops of ¯ux that are topologically linked around the ¯ux rope and which will tend to pull the ¯ux rope tailward. Nevertheless the ¯ux rope remains attached to the Earth until further recon-nection near the ¯anks of the tail releases them. According to Hughes and Sibeck (1987) the particle signatures expected in such structures are similar to those observed in closed loop plasmoids.
Correspondence to:A. Belehaki
There have been a number of supporting observa-tions such as high speed tailward ¯ows in the plasma sheet, bipolar signature in theBzand/orBycomponent, and energetic ion anisotropies, to verify the consistency of these models. These signatures have been reported from the analysis of ISEE3 and GEOTAIL observations and verify the envelopment of the spacecraft by a bulge in the plasma sheet (Honeset al., 1984a,b; Scholeret al., 1984a,b,c; Zwicklet al., 1984; Richardson and Cowley, 1985; Bakeret al., 1987; Richardsonet al., 1987; Slavin
et al., 1989; Moldwin and Hughes, 1992a; Machida
et al., 1994; Frank et al., 1994). Moreover GEOTAIL observations supporting the existence of ¯ux ropes include unidirectional electron distributions (Belehaki
et al., 1996; 1997) and modi®cation of the compositional content of energetic ions inside the structure (Luiet al., 1994).
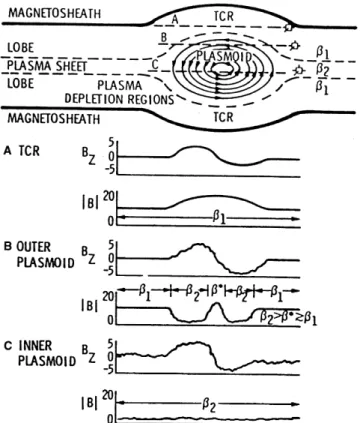
A very important conclusion revealed from these studies is that the magnetic ®eld and plasma variations detected by a spacecraft due to a passing plasmoid depend on the spacecraft trajectory relative to the plasmoid. If the spacecraft is engulfed by a passing plasmoid, the magnetometer signature will include a bipolar tilting in the Bz and/or By component and a distinct core as the spacecraft samples the core of the structure. If the spacecraft is located in the lobe in such a position so it does not penetrate the plasmoid, it will observe a travelling compression region. Travelling compression regions (TCRs) are several minute-long enhancements of the magnetic ®eld intensity in the lobes of the tail, which are accompanied by a north-then-south variation in the Bz component (Slavin et al., 1984). According to Slavin et al. (1989), a TCR is detected when a spacecraft follows a trajectory, such as in Fig. 1, which is too high in the Z coordinate to encounter the plasmoid proper. As shown in the lower panels of Fig. 1, the lobes are very low beta regions, and the pulse of increasejBjpeaks at the in¯ection point in a north - then - south tilting in the ®eld. For a trajectory passing closer to the midplane of the plasmoid, i.e., C in Fig. 1, the situation is expected to be somewhat dier-ent. With the spacecraft remaining in relatively high beta plasma throughout the encounter, it might be expected that thermal pressure would play a dominant role in supporting the enhanced solar wind pressure and only a weak enhancement in jBj would be observed in associ-ation with the bipolarBzsignature of the plasmoid. For trajectories between A and C a signi®cant peak in jBj
might be observed.
During a survey of magnetometer and electron plasma data obtained during the ISEE3 Geotail Mission for plasmoid signatures in the plasma sheet (Moldwin and Hughes, 1992b) bipolar signatures were reported in the plasma sheet boundary layer (PSBL). The PSBL is primarily characterised by low-energy ®eld aligned streaming ions. Secondary characteristics such as ion cyclotron waves produced by the ion beams and a decrease in magnetic ®eld strength due to diamagnetic eect of the PSBL plasma could be observed (Tsurutani
et al., 1985). The bipolar signatures reported in this magnetospheric region, are the TCR analog in the
PSBL, that is they are due to the passage of a plasmoid. PSBL ``plasmoids'', known as boundary layer plasmoids (BLP), are rare. A BLP signature is expected only when the size of a plasmoid and the position of the spacecraft causes the spacecraft to just enter the thin PSBL (the PSBL is estimated to be only a few Re thick, Owen and Cowley, 1987) and not directly into the plasma sheet and the plasmoid. Moldwin and Hughes (1992b) have de®ned precisely the characteristics of a BLP: (1) bipolar signature in theBzorBycomponent and accompanying variations in the other two components; (2) decrease of magnetic ®eld strength; (3) the electron temperature increases to just above 106K during the event; (4) the electron ¯ow velocity rises from 200 km/s to
800 km/s; and (5) clear substorm onset in ground magnetograms. Moreover, in two of the three BLP presented in detail by Moldwin and Hughes (1992b) some very small amplitude ion cyclotron waves were observed prior to and after the event. The primary characteristic of the PSBL, which is the low-energy ®eld aligned streaming ions, could not be observed since ISEE3 had no ion plasma detector in operation.
determined by the AL index. They found that the intensity of the AL index corresponding to isolated TCR events was seen to be signi®cantly lower than during the multiple TCR events. Hence while the magnetosphere dissipates larger quantities of energy during very intense substorms, it does so by ejecting multiple, smaller plasmoids rather than through the formation and expulsion of a single large plasmoid.
Some interesting studies of isolated events detected by ISEE3 and GEOTAIL during speci®c trajectories helped us to clarify the signatures of dierent types of structures. Among them, Murphy et al. (1987) studied the particle signatures of high energy ions detected by ISEE3 in the distant plasma sheet boundary layer. These ion enhancements were associated with magnetic ®eld signatures of a travelling compression region. They suggested that the bulk movement of the plasma sheet, relative to the spacecraft, caused by the tailward motion of a plasmoid, moves the energetic ion boundary layer past the spacecraft. They showed that the 90° pitch angle data (dawnward and duskward directed ions) support this idea fully, and so they concluded that the TCR ion bursts are caused by motion of an energetic ion boundary layer past the spacecraft.
Kawano et al. (1994) studied a ¯ux rope detected by GEOTAIL in the middle tail, followed by bipolar Bz
events identi®able as travelling compression regions. During the TCRs, the E´B ¯ow showed a bipolar
north-then-south perturbation, consistent with expected lobe plasma motion. The TCRs corresponded to weak ground magnetic disturbances and Pi2 waves. In order to explain these features they proposed that the ¯ux rope and TCRs correspond to quasi-stagnant plasmoids, between the mid-tail and the distant X-lines, which are recurrently generated and moved slowly down the tail.
The aim of this study is to determine the dynamics of the magnetotail during an intense substorm. For this purpose we have selected a period of enhanced geomag-netic activity, when GEOTAIL was in a suitable position in the distant tail jXj 150 Re to detect various types of magnetic structures ejected after the onset of the expansion phase. The event presented here, occurred on October 10, 1993 from 0050 UT to 0220 UT. The study of this case shows clearly that a series of plasmoids are generated in the tail, with each roughly corresponding to a substorm intensi®cation, and each being smaller than the previous one. The comprehensive new observations presented here are in contradiction to the classic plasmoid model (Hones, 1976) and give full support to the model of multiple plasmoid ejection (Moldwin and Hughes, 1993; Slavin
et al., 1993).
2 GEOTAIL instrumentation
Energetic particle measurements used in this study are from the energetic particles and ion composition (EPIC) experiment (Williams et al., 1994). The instrument performs three-dimensional distribution measurements by using both total energy (LEMS, low energy
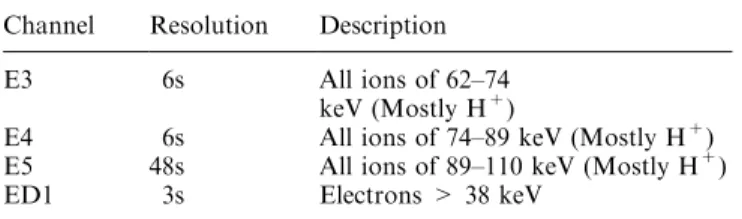
compo-sition system) and velocity/compocompo-sition detectors (ICS, ion composition system), measuring ions and electrons with energies > 20 keV, and ions with energy > 8 keV/ nucleon, respectively. For the purposes of this work we used the following ICS channels: E3, E4, E5, and ED1. Table 1 presents an overview of the channel character-istics.
The magnetic ®eld data were obtained by the ¯uxgate magnetometer (MGF) on board GEOTAIL at a rate of 16 vectors/s and are used with a resolution of 3 s. The instrument is described by Kokubunet al. (1994).
3 Observations
On October 10, 1993 between 0050 UT and 0220 UT a sequence of magnetic structures were detected by GEOTAIL. At that time the spacecraft was located in the deep geotail with XGSM= )148.5 Re, YGSM =
10.9 Re and ZGSM = 8.2 Re. Since the tail axis is
aberrated by 4.5° towards dusk, due to the Earth's
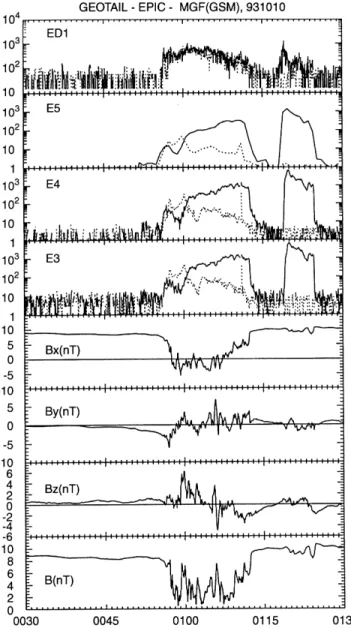
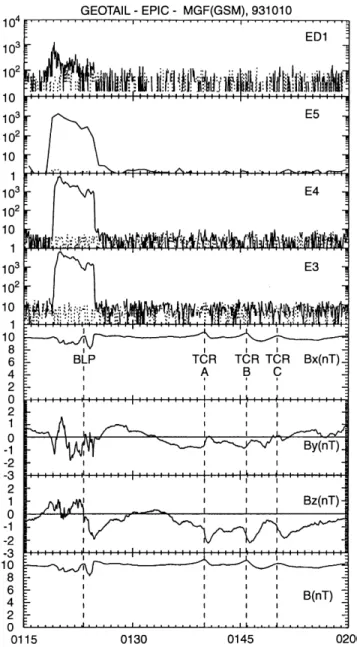
orbital motion, the rotated Ycoordinate (i.e., Y0) gives the most probable spacecraft location to be at Y00:4 Re. The time plot of the ®rst part of this event is given in Fig. 2. We present dierential energy ¯uxes of the energetic particle channels ED1, E5, E4 and E3, from the sunward sector (solid line) and the tailward sector (dotted line), together with magnetic ®eld data of 3 s time resolution.
At the start of this interval GEOTAIL was located in the north lobe. From 0055 UT to 0115 UT GEOTAIL detected an energetic particle burst which is associated with signi®cant magnetic ®eld disturbances probably due to a large plasmoid. A small but well-de®ned bipolar signature is observed along the Z-component of the magnetic ®eld having its in¯ection point at 0105:50 UT. The plasmoid core ®eld has a strong By component at the in¯ection point of the bipolar signature. The large magnetic ®eld perturbation, observed at the leading and the trailing ®eld, is due to the pile up of the plasma sheet ahead of the plasmoid. An interesting feature of this event is that the magnitude of the magnetic ®eld at the centre of the structure presents a peak at 0105:50 UT without exceeding or even reaching the adjacent lobe ®eld.
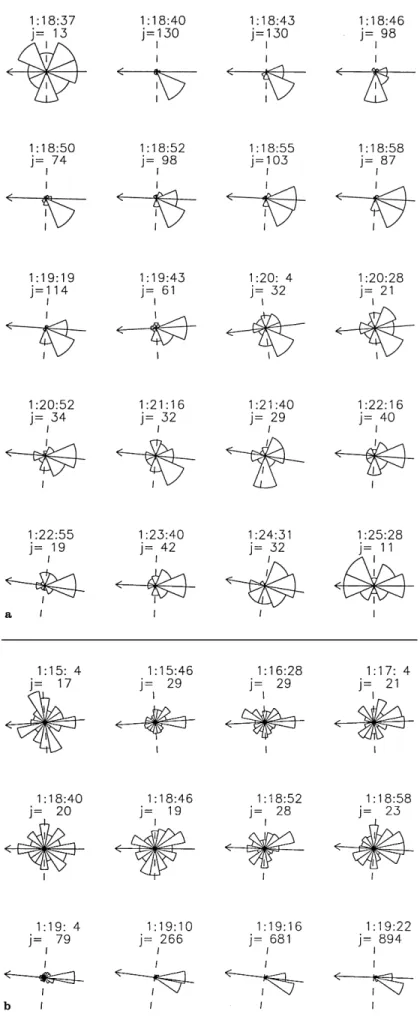
Energetic particles show a burst-type increase. To study the ¯ow of energetic particles compared to the magnetic ®eld direction in more detail we present the angular distributions of energetic electrons and protons in Fig. 3a,b respectively. The ion intensity is plotted linearly versus viewing direction and normalised to the Table 1.EPIC/ICS channels
Channel Resolution Description
E3 6s All ions of 62±74 keV (Mostly H+)
E4 6s All ions of 74±89 keV (Mostly H+)
E5 48s All ions of 89±110 keV (Mostly H+) ED1 3s Electrons > 38 keV
sector with maximum intensity. The Sun lies to the right of this ®gure. The time shown at the top of each plot is the start time of the 6 s accumulation interval. The number given at the top of each plot is the count rate (counts/s) of the sector with the maximum ¯ux. Together with each angular distribution we overplot the equatorial vector of the mean value of the magnetic ®eld during each 6 s time interval. The dashed line in each plot is the perpendicular to the ®eld direction. The angular distributions of the energetic electrons with E > 38 keV are shown in Fig. 3a. GEOTAIL observes the ®rst beam of energetic electrons at 0056:16 UT. Electrons are ¯owing tailward for almost 1 min and then their ¯ow in the equatorial plane becomes isotro-pic. On the other hand, energetic ions present a dierent
behaviour. The angular distributions of ions detected from channel E3 are presented in Fig. 3b. The ®rst beam of ions is observed at 0057:16 UT to ¯ow earthward along the ®eld lines, indicating that the distant neutral line is formed tailward of GEOTAIL, that is at
jXj>148:5 Re. The earthward ¯ow of E3 ions is ob-served until 0060:28 UT. Consequently, until 0101:16 UT a ¯ow reversal to tailward direction is observed. In the tailward anisotropy a systematic cross-tail component is observed, which lasts for 7 min providing evidence of a slow displacement of the PSBL across the spacecraft. The same pattern of ¯ow is observed in the other two channels, E4 and E5, whose anisotropies have been examined in detail but not shown here. No evidence for energy dispersion was found in the front edge of this plasmoid structure.
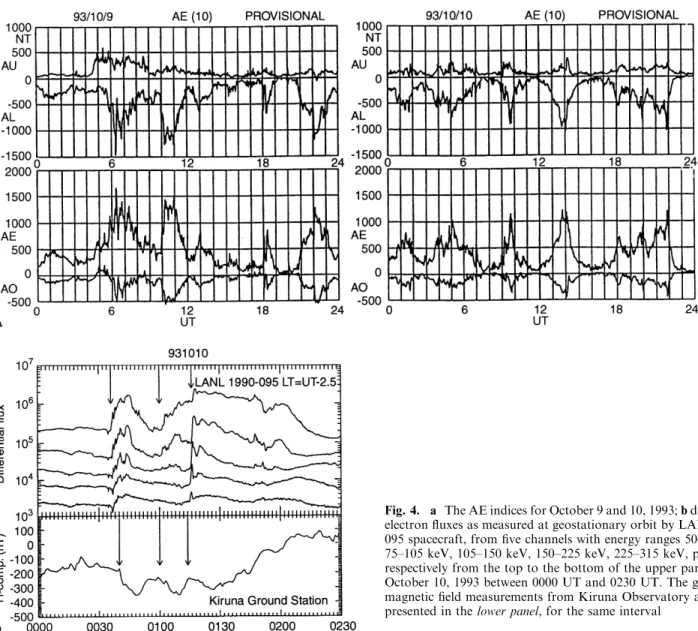
To characterise the state of the magnetosphere prior to and during this event, we inspected the AE indices for October 9 and 10, 1993, which are presented in Fig. 4a. Two major onsets are identi®ed at about 2100 UT and 2200 UT, on October 9, 1993, giving rise to a very strong substorm, which lasts until about 2330 UT of that day. At 0040 UT of October 10, 1993, the onset of a new substorm is detected from the AE indices, which we believe to be responsible for the large plasmoid observed by GEOTAIL from 0055 to 0112 UT. Since between the two substorms the AE index remains high enough (300 nT), it is concluded that the substorm that caused the disturbance detected at the magnetotail is part of a longer period of disturbance.
To study in more detail the geomagnetic activity for October 10, 1993 between 0000 UT and 0230 UT, we present in the upper panel of Fig. 4b the energetic electron ¯uxes from ®ve dierent energy levels from LANL 1990±095 geosynchronous satellite, and the 1 min geomagnetic ®eld disturbance data from Kiruna Observatory, in the lower panel. A notable onset is seen at 0036 UT at geosynchronous altitude, following by two intensi®cations at 0100 UT and 0116 UT (marked with arrows in Fig. 4b). Almost simultaneous decreases as seen in the Kiruna magnetogram.
One of the clearest markers of substorm onsets in high-altitude spacecraft data is the occurrence of these substorm particle injections near local midnight at geostationary orbit. Sharp dispersionless injection event onsets generally are associated one-to-one with sub-storm expansion onsets (or intensi®cations) seen in ground-based data (Baker et al., 1984). Thus, the substorm onset associated with the plasmoid detected by GEOTAIL at 0057 UT, was identi®ed from the ground magnetogram of the Kiruna Observatory at 0040 UT, that is 17 min prior to magnetic structure appearance at GEOTAIL position.
The passage of the ®rst plasmoid leaves GEOTAIL in a region of constant magnetic ®eld whose value is 10 nT, i.e., higher than the north lobe ®eld measured before the ®rst plasmoid encountered, by 25%. Under these conditions, a second plasmoid-like perturbation is encountered, 7 min after the passage of the ®rst plasm-oid. An expanded view of this second perturbation is presented in Fig. 5. The format is the same as the one Fig. 2. The time plot of the magnetic ®eld and energetic particle
Fig. 3a, b.Angular distribution of ED1 and E3 channels showing the electrons and ions behaviour at the onset of the burst
532
A.
Belehaki
et
al.:
Magnetotail
response
during
a
strong
described in Fig. 2. During this event theBxcomponent decreases slightly. A bipolar perturbation is seen in the
Z-component of the magnetic ®eld. Just at the in¯ection point of Bz, the maximum ®eld signature due to compression of the lobe magnetic ®eld is observed at
Bx component, with a magnitude that exceeds slightly the value of the lobe ®eld detected between 0115 and 0118 UT. The ®rst dashed vertical line shown in Fig. 5 at 0123:20 UT is drawn through the maximum core ®eld which is observed simultaneously with the bipolar turning of the Bz component. Moreover, a clear anisotropy of tailward versus earthward streaming ions and electrons during this BLP, can be seen in the ®rst four panels of Fig. 5 from 0118 UT to 0125 UT. This is probably an instance of a boundary layer plasmoid (BLP), as de®ned by Moldwin and Hughes (1992b).
The magnetic ®eld signatures presented are indicative of the PSBL (see Introduction). Nevertheless, to verify the existence of the primarily characteristic of the PSBL which is the ®eld aligned ion beams, we examine the angular distributions of electrons and ions of dierent
energies separately. The results for energetic electrons are presented in Fig. 6a using the same format as Fig. 3. A beam of electrons ¯owing in the tailward direction, with a very strong duskward component, appears at GEOTAIL position at 0118:40 UT. A dawn-to-dusk component appears systematically in the angular distri-bution plots during the entire electron beam interval, although not so intense as during the ®rst 15 s. The beam-like tailward electron ¯ow lasts until 0119:43 UT. From 0120 UT through 0124 UT, although the count level is low, close to background values, the dominant sector of maximum counts is that looking towards the Sun. The angular distributions of energetic ions from channels E3, E4 and E5 are given in Fig. 6b, c and d respectively. The ®rst beam of tailward streaming E3 ions is detected at 0119:04 UT. This high intensity beam is seen until 0124:46 UT, when the counts return back to background level. The higher energy ions detected by the E4 and E5 channels start to ¯ow tailward at 0118:58 UT and 0118:52 UT respectively (Fig. 6c, d), and they keep ¯owing in such a way for
the time sequence of tailward intensi®cation of the ¯ow, observed by the three channels of ions of dierent energies, gives us strong evidence of positive velocity dispersion in the leading edge of the boundary layer plasmoid. An interesting feature that arises from the angular distribution analysis is that in the time interval between the two plasmoids, i.e., from 0115 UT to 0118 UT, the energetic ions are streaming tailward along the ®eld lines even though the count rate is very low. This feature is indicative of the PSBL.
A second intensi®cation of the westward electrojet at
0100 UT during the expansion phase of the substorm detected in Kiruna is probably related to the BLP observed by GEOTAIL at0120 UT (see Fig. 4b).
After 0130 UT GEOTAIL detects a negative Bz
component for 25 min. During this interval of
south-ward Bz, three TCRs are observed at 0140 UT,
0146 UT and 0150 UT as is indicated in Fig. 5 by the dotted vertical lines. TheBzcomponent is still to the south for 10 min after the last compression region. This multiple TCR event is preceded by a decrease in the
X-component at 0116 UT detected in the ground mag-netogram of Kiruna Observatory (Fig. 4b). Although there are multiple decreases in theX-component follow-ing the large decrease at 0116 UT, there is no clear association between the subsequent TCRs in this multi-ple event and the ®ne structure in theX-component. The three compression regions are accompanied by +Bzthen )Bzvariations, with the peak compression being near the in¯ection point in the north-south component. The most intense and long duration event (4 min) is the ®rst TCR, with a compression ratio of 10%.
To identify better the nature of the BLP and TCRs observed by GEOTAIL we examine the magnetic ®eld using principal axis coordinates (Sonnerup and Cahill, 1967). Figure 7 presents the principal axis analysis (PAA) of the 3-s resolution boundary layer plasmoid magnetic ®eld measurements. In this system, B1 is the magnetic ®eld along the direction of maximum variance, B2 is the magnetic ®eld component along the direction of intermediate variance, and B3 is the magnetic ®eld component along the minimum variance direction, along which the magnetic ®eld exhibits the least change. The direction of the principal axis (i.e., the eigenvector) in GSM coordinates as well as the eigenvalues are given in each of the panels. As noted in Fig. 7, the eigenvector of the minimum variance direction B3 is (0.246, 0.787, 0.565) in GSM coordinates, which lies in theY-Zplane, being closer to Y axis. The magnetic ®eld along the intermediate variance direction B2 is nearly aligned with theX-axis, seen from the eigenvector coordinates (0.898, )0.405, 0.173). The B2 component exhibits an increase in magnitude around 0123 UT, which corresponds to the peak of the magnetic ®eld at the centre of the BLP and is oriented antiparallel to the tail axis. The axis of the maximum variance direction, B1, is essentially in the
Z-direction (0.365, 0.465, )0.806) and represents the north ± then ± south Bz variation. Hodograms at the bottom of Fig. 7 provide views of the magnetic ®eld variation in the two orthogonal planes. Here we follow the format proposed by Slavin et al. (1993) by marking the beginning and the end of the traces with ``B'' and ``E'' respectively. The hodograms show a well-de®ned rotation in the B2-B1 plane, which is close to 180°
rotation and a quite variable B3-B1 trace. Since B1 component is nearly aligned with the Z axis and B2 component is nearly aligned with theXaxis, we come to the conclusion that the tip of the magnetic ®eld vector during the BLP mainly rotated in the plane containing the ambient magnetic ®eld.
As pointed out earlier, the BLP is followed by three short duration TCRs. Figure 8 displays the magnetic ®eld components in principal axis coordinates and the PAA hodograms for the ®rst TCR. The results from the other two TCRs are almost the same, thus they are not presented. The ®eld presents a well-de®ned rotation in the B2-B1 plane with relatively stable B3 component. Fig. 5. An expanded overview of the time interval 0115 UT ±
0200 UT, where a boundary layer plasmoid (BLP) is observed following by three travelling compression regions (TCR). Thedashed vertical linesare drawn through the centre of the BLP and of the TCRs
The tip of the magnetic ®eld vector in all cases of compression regions studied, rotated in a plane con-taining the ambient ®eld. The hodograms presented here are smoother than those of Fig. 7 which correspond to the BLP. This is due to the absence of high beta plasma sheet and PSBL ¯ux tubes surrounding the plasmoids (Slavinet al., 1989). The minimum variance direction is essentially aligned with theY axis in all cases and it is consistent with the east-west centre of their associated plasmoid passing very nearly under the spacecraft. Finally, the large ratios of maximum to intermediate (L1/L2 = 9.66, 4.64 and 7.18 for TCR A, B and C respectively) and intermediate to minimum eigenvalues (L2/L3 = 47, 32 and 2.43 for TCR A, B and C respectively) signify that the structures are well de®ned.
4 Summary of observations
a. A large plasmoid was observed by GEOTAIL at 0055 UT. At the front edge of the structure, energetic electrons ¯ow tailward whereas energetic ions ¯ow
earthward until tailward convected population is observed. No energy dispersion was observed. b. The ®rst large plasmoid leaves GEOTAIL in the
boundary layer plasma sheet. This was identi®ed by (1) the magnitude of the constant magnetic ®eld which exceeds the lobe value by 25% and (2) the tailward ®eld aligned streaming ions observed even at very low count rates.
c. While GEOTAIL is in the PSBL, a BLP was observed, followed by three TCRs.
d. Particle signatures observed during the boundary layer plasmoid show tailward streaming electrons during the passage of the structure. Positive velocity dispersion was observed in the front edge of the structure while reverse velocity dispersion was seen in the rear edge.
e. The principal axis analysis performed in the three TCRs revealed a very simple nature of magnetic ®eld. f. The ®rst large plasma sheet plasmoid centered at
0106 UT was associated with the substorm onset seen in ground magnetograms at 0040 UT and in particle injections at geosynchronous altitudes at
0036 UT as well. Fig.6c, d(continued)
g. The boundary layer plasmoid centered at0123 UT is associated with the substorm intensi®cation seen at 0100 UT on the ground and at geosynchronous altitudes as well.
h. Finally, there was a particle injection event observed at geosynchronous altitude at 0116 UT preceding the three travelling compression regions detected by GEOTAIL at 0140 UT, 0146 UT and 0150 UT. The three TCRs were observed during the recovery phase of the substorm. There was no clear one-to-one correlation between the observed TCRs and substorm intensi®cations.
5 Discussion
We have studied the structure and dynamics of the distant magnetotail during a strong substorm. Magnetic ®eld and energetic particle measurements from GEO-TAIL spacecraft, related to this event have been examined.
The Earth's magnetotail responded to this substorm with the ejection of ®ve plasmoids. The ®rst of them,
with the maximum duration (20 min) was ejected 17 min after the expansion onset of the substorm. GEOTAIL was engulfed by this passing plasmoid. The second plasmoid ejected 20 min after the intensi®ca-tion of the westward electrojet recorded in Kiruna ground observatory at 0100 UT, had no signi®cantly large Z extent, so that GEOTAIL observed the travel-ling bulge in the PSBL in the form of a boundary layer plasmoid. Subsequently three small plasmoids were ejected, following an additional intensi®cation of the westward electrojet recorded at 0116 UT. Nevertheless, no other distinct intensi®cations were observed after 0116 UT. The eects of these passing plasmoids were observed in the lobe by GEOTAIL in the form of travelling compression regions.
These observations are in accordance with Moldwin and Hughes (1993) results, suggesting that there was no one-to-one correspondence of the numbers of plasmoids compared to individual identi®able onsets during a pe-riod of prolonged substorm activity. In contrast Slavin
et al. (1992) found one-to-one correlation between each substorm intensi®cation and a plasmoid or a TCR observed in the deep tail by ISEE3.
Plasmoid velocity and dynamics
The timing of the distant tail plasmoid observation relative to the earlier substorm onset, the dimensions of the plasmoids and the bulk speed of the plasma within the magnetic structures can lead us to some conclusions concerning the dynamics of the magnetotail. Unfortu-nately, during the selected time interval, data from the comprehensive plasma instrument (CPI) onboard GEO-TAIL, had a lot of gaps. During the ®rst plasmoid, i.e. from 0055 UT to 0112 UT there was only one data point from the CPI experiment, indicating that the Vx
component of the proton bulk ¯ow reached the value of 600 km/s. The convective (bulk) speed of the suprather-mal particle population after 0102 UT, when the tailward ¯ow became more anisotropic, can be estimat-ed indirectly from the Compton-Getting eect (Gold
et al., 1975). From the measurements of the spectral index (c= 3.9) and the anisotropy ratio (the forward
versus the backward count rateJf/Jb= 20) at the start
of the convection interval, the Compton-Getting trans-formation gives a bulk speed u = 620 km/s. This is in
very good agreement with the plasma data available from GEOTAIL/CPI experiment. Given that the high energy tail of the thermal ion population convected with the magnetic structure is observed for about 12 min, the length of the magnetic structure based upon the convection speed estimated indirectly from the Comp-ton-Getting eect is(56 11) Re. The uncertainty in the estimation of the plasmoid length is due to the uncertainty of the start time and end time of the convection and due to error in the estimation of the bulk speed from the Compton-Getting eect.
For the boundary layer plasmoid the downtail speed and size can be estimated from the measured duration and the time between observation at GEOTAIL and substorm onset, as was suggested originally by Moldwin and Hughes (1992b). If we assume that the near-Earth reconnection site is at XNENL=)20 Re and that plasmoid is released at substorm onset and propagates with a constant velocity after formation, the downtail velocity can be estimated by V= (XGEOTAIL)XNENL)/
(tGEOTAIL)tonset), where XGEOTAIL =)148.5 Re is the location of GEOTAIL at time of observation,XNENLis
Fig. 8. 3 s averages of the GEOTAIL magnetic ®eld data across the travelling compression region event A, displayed in principal axis coordinates. Hodograms of the ®eld variation in two orthogonal planes are shown in thebottom panels
the location of the near-Earth reconnection site,
tGEOTAIL = 0127 UT is the time of the end of the event
at GEOTAIL, and tonset= 0100 UT is the time of
substorm intensi®cation (Moldwin and Hughes, 1992b). The downtail velocity for this BLP was found to be 510 km/s. The estimated size of the plasmoid can be calculated using the velocity and duration of the event by L= VxTBLP, where TBLP is the duration of the
BLP. The size for this event is (28 5) Re, given that the duration of the event was estimated to be 6 min which represents the duration of the entire bipolar turning of Bz-component. The uncertainty of the BLP length is (1) due to the error in the onset time which is 1 min, (2) due to the error in the assumption of the near-Earth X-line position, which might continuously retreat after each successive onset and (3) due to the uncertainty in the estimation of the end time of the event at GEOTAIL position due to an amount of draping and pile-up observed before and after the magnetic structure. To estimate the velocity and length of the compres-sion regions which appeared at GEOTAIL during the recovery after the substorm, we follow the same method suggested by Moldwin and Hughes (1992b) which has been applied previously to estimate the bulk velocity of the BLP, given that TCRs are caused by the draping of lobe ¯ux tubes about plasmoids moving rapidly tailward (Murphy et al., 1987; Owen and Slavin, 1992; Slavin
et al., 1993). This local compression of the lobe magnetic ®eld then accompanies the plasmoid as it moves down the tail and can be observed by GEOTAIL residing the lobes. Here, it is assumed again that the compression originates near XNENL= )20 Re. Given that GEO-TAIL was located atXGSM =)149 Re, the end of the event was observed by GEOTAIL at tGEOTAIL=
0141 UT and the intensi®cation of the westward elec-trojet that caused the ®rst TCR observed at tonset=
0116 UT, the formula proposed by Moldwin and Hughes (1992b) gives a downtail velocity of 555 km/s. The estimated size for this event is (21 4) Re, given that the duration of the event was calculated to be 4 min, which represents the duration of the entire bipolar turning of Bz-component. The uncertainties of the length of the plasmoid caused the ®rst TCR to have been calculated as in the previous case, for the BLP length.
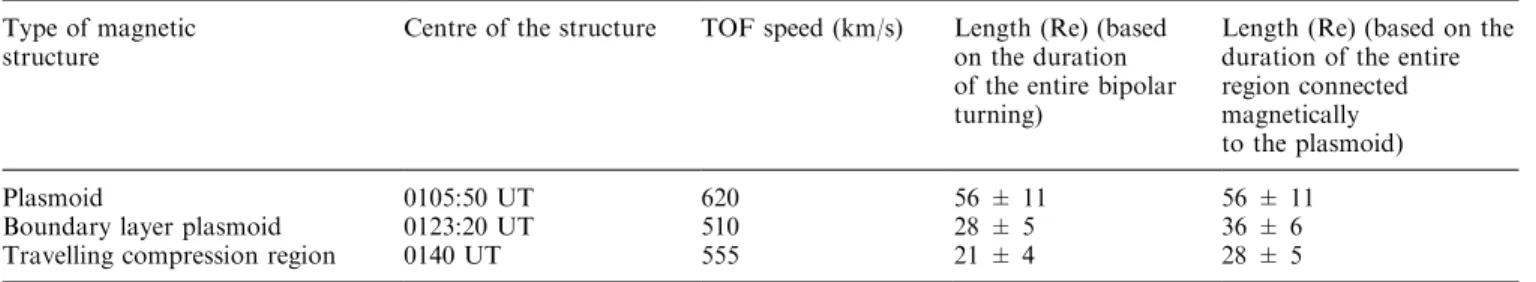
The estimated lengths of the plasmoid structures ejected downtail during the expansion phase of this substorm lead us to the conclusion that the magnetotail is responding with a series of plasmoids, whose size
decreases from one plasmoid to the next, as shown in Table 2, the summary is given of computed velocities and lengths of the three types of magnetic structures (the plasma sheet plasmoid, the BLP and the ®rst TCR) detected in the magnetotail by GEOTAIL during this isolated strong substorm. The lengths derived from the BLP and the TCR for the underlying plasmoid bulges are considerably smaller than the estimated length of the ®rst plasmoid. This is in accordance with the results from previous studies (Moldwin and Hughes, 1992b; Slavin et al., 1993). According to Slavin et al. (1993) a TCR can only be used to sense remotely the plasmoid bulge and not the entire region magnetically connected to the plasmoid, because the distance between the extrema in the Bz signature used to estimate the duration, is estimated to be only about 75% of the plasmoid. The total plasmoid dimensions along the X
axis is therefore 36 Re and 28 Re for the BLP and the TCR respectively, which is again in accordance with the conclusion that the size of the individual plasmoids ejected downtail during a strong substorm, decreases from one plasmoid to the next.
Magnetic topology of plasmoids
From the study of the energetic particle angular distribution it is inferred that at the start of the event (0055 UT), GEOTAIL was located earthward of the distant neutral line, but close enough to detect earth-ward-¯owing energetic particles accelerated from the distantX-line. Consequently, a reversal to tailward ¯ow is observed. During the plasmoid observed from 0055 UT to 0112 UT, no velocity dispersion was observed. This gives us additional supporting evidence for the scenario that energetic particles are accelerated from the distant X-line. Observations of earthward streaming ions inside a ¯ux rope has been reported by Kawano et al. (1994) during an event observed by GEOTAIL in the middle tail and was explained by the hypothesis that energetic ions are coming from the distantX-line. As an alternative explanation, DeCoster and Frank (1979) referred to the possibility of a ®eld aligned electric ®eld in the magnetotail which accelerates ions earthward and electrons tailward.
At the centre of the structure a very large By
component is observed, while energetic particles are convected tailward. According to Hughes and Sibeck (1987) the large dawn-to-dusk component results in the
Table 2.Length and TOF speed determination of TCRs
Type of magnetic structure
Centre of the structure TOF speed (km/s) Length (Re) (based on the duration of the entire bipolar turning)
Length (Re) (based on the duration of the entire region connected magnetically to the plasmoid)
Plasmoid 0105:50 UT 620 56 11 56 11
Boundary layer plasmoid 0123:20 UT 510 28 5 36 6
formation of a ¯ux rope magnetic structure. Their three-dimensional model predicts energetic particle signatures similar to those of the two-dimensional model. When a plasmoid passes a spacecraft in the distant magnetotail, the plasma sheet expands to engulf the spacecraft, which in the Hughes and Sibeck (1987) model passes succes-sively from open lobe ®eld lines with one end attached to the Earth, to newly merged open boundary layer ®eld lines with both ends in the solar wind, to interior plasmoid magnetic ®eld lines still connected to the Earth.
The magnetic ®eld lines of the boundary layer plasmoid ejected 5 min after the ®rst large plasmoid passage, appears to be open as expected by the boun-dary layer plasmoid de®nition. This has been supported from the analysis of the angular distribution of electrons with E > 38 keV, which show tailward ¯ow during the whole interval of the event. Moreover, positive velocity dispersion was observed in the front edge of the BLP, while reverse velocity dispersion was observed at the rear edge. Thus we can adopt the Murphyet al. (1987) conclusion according to which bulk movement of the plasma sheet relative to the spacecraft, caused for example, by the tailward motion of a plasmoid, moves the energetic ion boundary layer past the spacecraft.
The principal axis analysis performed on the mag-netic ®eld during the BLP interval, shows a well-de®ned rotation in the B1-B2 plane, which is less than 180o. On the other hand the magnetic ®eld in the B1-B3 plane, presents a more complex behaviour, showing that the magnetic ®eld along the B3 component (in the direction of minimum variance, largely along theY-axis) presents relatively large variations. The expected magnetic ®eld variations observed by a spacecraft passing through the centre of an idealised magnetic island and a ¯ux rope, have been examined by Slavin et al. (1989) and presented in their Fig. 11a. In a more realistic approach, a spacecraft passing well above the axis of the loop, which is the case when the spacecraft encounters a BLP, would result in a rotation of less than 180°while motion of the plasmoid relative to the spacecraft can produce much larger rotations.
The results obtained from the PAA performed on the magnetic ®eld data during the three TCR intervals show a well-de®ned rotation of the ®eld in B1-B2 plane and an almost linear variation of the ®eld in the B1-B3 plane, along the axis of the maximum variation which is almost aligned with theZaxis. This 2D perturbation in a plane almost coincident with the X-Z plane, veri®es that the spacecraft observes the tilting of the lobe ®eld due to the passage of a plasmoid underneath. Thus, the peak in the intermediate ®eld direction (along the X-axis) is due to the compression of the lobe ®eld.
6 Conclusions
We presented a case study of the magnetotail response during an intense substorm, which is part of a longer period of disturbance. The analysis of energetic particle and magnetic ®eld data from the deep tail phase of the
GEOTAIL mission together with data from geosyn-chronous altitudes and ground magnetometers, showed that a series of plasmoids are generated, with each roughly corresponding to a substorm intensi®cation and each being smaller than the previous one. This latter conclusion is supported in that GEOTAIL ®rst observes a ¯ux rope plasmoid in the plasma sheet, then a boundary layer plasmoid and then ®nally a series of three travelling compression regions in the lobes. These comprehensive new observations, taken during a period of prolong substorm activity, give full support to the model of multiple plasmoid injection (Slavinet al., 1993; Moldwin and Hughes, 1993) and contradict the classic plasmoid model (Hones, 1976).
Acknowledgements. Thanks are due to Stuart Nylund for the EPIC/ GEOTAIL data processing. We are grateful to Geo Reeves of the LANL energetic particle team, for providing us with the dierential electron ¯uxes by LANL 1990-095 spacecraft.
Topical Editor K.-H. Glaûmeier thanks M.B. Moldwin and another referee for their help in evaluating this paper.
References
Baker, D. N., S. J. Bame, R. D. Belian, W. C. Feldman, J. T. Gosling, P. R. Higbie, E. W. Hones, Jr., D. J. McComas, and R. D. Zwickl,Correlated dynamical changes in the near-Earth and distant magnetotail regions: ISEE3,J. Geophys. Res.,89,3855± 3864, 1984.
Baker, D. N., R. C. Anderson, R. D. Zwickl, and J. A. Slavin, Average plasma and magnetic ®eld variations in the distant magnetotail associated with near-Earth substorm eects,
J. Geophys. Res.,92,71±81, 1987.
Belehaki, A., E. T. Sarris, G. Tsiropoula, R. W. McEntire, S. Kokubun, and T. Yamamoto,Energetic particle bursts detected by GEOTAIL in the distant tail,Proc. of the ICS-3, ESA SP-389, 487±492, 1996.
Belehaki, A., E. T. Sarris, G. Tsiropoula, R. W. McEntire, S. Kokubun, and T. Yamamoto, Observations of ¯ux rope-associ-ated particle bursts with GEOTAIL in the distant tail,Annales Geophys., in press, 1997.
DeCoster, R. J., and L. A. Frank, Observations pertaining to the dynamics of the plasma sheet,J. Geophys. Res.,84,5099, 1979.
Frank, L. A., W. R. Paterson, K. L. Ackerson, S. Kokubun, T. Yamamoto, D. H. Fair®eld, and R. P. Lepping,Observations of plasmas associated with the magnetic signature of a plasmoid in the distant magnetotail,Geophys. Res. Lett.,21,2967, 1994. Gold, R. E., C. O. Bostrom, and E. C. Roelof, Anisotropy
measurements of50 keV solar protons,Conf. Pap. Int. Cosmic Ray Conf. 14th,5,1801, 1975.
Hones, E. W., Jr.,The magnetotail: its generation and dissipation, inPhysics of solar planetary environments, Ed. D.J. Williams, 557±571, AGU, Washington D.C., 1976.
Hones, E. W., Jr., Transient phenomena in the magnetotail and their relation to substorms,Space Sci. Rev.23,393, 1979. Hones E. W., Jr, D. N. Baker, S. J. Bame, W. C. Feldman, J. T. Gosling,
D. J. McComas, R. D. Zwickl, J. A. Slavin, E. J. Smith, and B. T. Tsurutani,Structure of the magnetotail at 220 REand its response to
geomagnetic activity,Geophys. Res. Lett.,11,5±7, 1984a. Hones E. W., Jr, J. Birn, D. N. Baker, S. J. Bame, W. C. Feldman,
D. J. McComas, and R. D. Zwickl,Detailed examination of a plasmoid in the distant magnetotail with ISEE 3,Geophys. Res. Lett.,11,1046, 1984b.
Hughes, W. J., and D. G. Sibeck,On the 3-dimensional structure of plasmoids,Geophys. Res. Lett.,14,636±639, 1987.
Kawano, H., T. Yamamoto, S. Kokubun, K. Tsuruda, A. T. Y. Lui, D. J. Williams, K. Yumoto, H. Hayakawa, M. Nakamura, T. Okada, A. Mutsuoka, K. Shiokawa, and A. Nishida,A ¯ux rope followed by recurring encounters with traveling compression regions: GEOTAIL observations,Geophys. Res. Lett.,21,2891, 1994.
Kokubun, S., T. Yamamoto, M. H. Acuna, K. Hayashi, K. Shiokawa, and H. Kawano, The GEOTAIL magnetic ®eld experiment,J. Geomag. Geoelectr.,46,7±21, 1994.
Lui, A. T. Y., D. J. Williams, S. P. Christon, R. W. McEntire, V. Angelopoulos, C. Jacquey, T. Yamamoto, and S. Kokubun, A preliminary assessment of energetic ion species in ¯ux ropes/ plasmoids in the distant tail,Geophys. Res. Lett.,21,3019±3022, 1994.
Machida, S., T. Mukai, Y. Saito, T. Obara, T. Yamamoto, and S. Kokubun, Geotail low energy particle and magnetic ®eld observations of a plasmoid at X=)142 Re, Geophys. Res.
Lett.,21,295, 1994.
Moldwin M. B., and W. J. Hughes,A study of plasmoid properties to examine the formation and evolution of plasmoids: survey of ISEE3 Geotail data,J. Geophys. Res.,97,19259, 1992a. Moldwin M. B., and W. J. Hughes,Plasmoid observations in the
distant plasma sheet boundary layer, Geophys. Res. Lett.,19, 1911±1914, 1992b.
Moldwin M. B., and W. J. Hughes, Geomagnetic substorm association of plasmoids,J. Geophys. Res.,98,81±88, 1993. Murphy N., J. A. Slavin, D. N. Baker, and W. J. Hughes,
Enhancements of energetic ions associated with travelling compression regions in the deep geomagnetic tail,J. Geophys. Res.,92,64±70, 1987.
Owen, C. J., and J. A. Slavin,Energetic ion events associated with travelling compression regions, in Proc. of the International Conference on Substorms ± 1,Eur. Space Agency Spec. Publ., ESA SP-000, 365±370, 1993.
Owen, C. J., and S. W. H. Cowley, Simple models of time-dependent reconnection in a collision-free plasma with an application to substorms in the geomagnetic tail,Planet. Space Sci.,35,451, 1987.
Richardson, I. G., and S. W. H. Cowley, Plasmoid-associated energetic ion bursts in the deep geomagnetic tail: properties of the boundary layer, J. Geophys. Res., 90, 12133±12155, 1985.
Richardson, I. G., S. W. H. Cowley, E. W. Hones, Jr., and S. J. Bame, Plasmoid associated energetic ion bursts in the deep geomagnetic tail: Properties of plasmoids and the postplasmoid plasma sheet,J. Geophys. Res.,92,9997, 1987.
Scholer, M., G. Gloeckler, B. Klecker, F. M. Ipavich, D. Hovestadt, and E. J. Smith, Fast moving plasma structures in the distant magnetotail,J. Geophys. Res.,89,6717±6727, 1984a.
Scholer, M., G. Gloeckler, D. Hovestadt, B. Klecker, and F. M. Ipavich,Characteristics of plasmoidlike structures in the distant magnetotail,J. Geophys. Res.,89,8872±8876, 1984b.
Scholer, M., D. Hovestadt, B. Klecker, G. Gloeckler, and F. M. Ipavich, Average ¯ow between 70 Re and 200 Re in the geomagnetic tail,Geophys. Res. Lett.,11,343, 1984c.
Slavin, J. A., E. J. Smith, B. T. Tsurutani, D. G. Sibeck, H. J. Singer, D. N. Baker, J. T. Gosling, E. W. Hones, and F. L. Scarf, Substorm associated traveling compression regions in the distant tail: ISEE-3 geotail observations,Geophys. Res. Lett., 11,657±660, 1984.
Slavin, J. A., D. N. Baker, J. D. Craven, R. C. Elphic, D. H. Fair®eld, L. A. Frank, A. B. Galvin, H. J. Hughes, R. H. Manka, D. G. Mitchell, I. G. Richardson, T. R. Sanderson, D. G. Sibeck, E. J. Smith, and R. D. Zwickl, CDAW-8 observations of plasmoid signatures in the geomagnetic tail: an assessment,
J. Geophys. Res.,94,15153±15175, 1989.
Slavin, J. A., M. F. Smith, E. L. Mazur, D. N. Baker, T. Iyemori, H. J. Singer, and E. W. Greenstadt, ISEE3 plasmoid and TCR observations during an extended interval of substorm activity,
Geophys. Res. Lett.,19,825±828, 1992.
Slavin, J. A., M. F. Smith, E. L. Mazur, D. N. Baker, E. W. Hones, Jr., T. Iyemori, and E. W. Greenstadt, ISEE3 observations of travelling compression regions in the Earth's magnetotail,
J. Geophys. Res.,98,15425±15446, 1993.
Sonnerup, B. U. O., and L. J. Cahill,Magnetopause structure and attitude from Explorer 12 observations, J. Geophys. Res., 72, 171, 1967.
Tsurutani, B. T., I. G. Richardson, R. M. Thorne, W. Butler, E. J. Smith, S. W. H. Cowley, S. P. Gary, S. -I. Akasofu, and R. D. Zwickl, Observations of the right-hand resonant ion beam instability in the distant plasma sheet boundary layer,
J. Geophys. Res.,90,12159, 1985.
Williams, D. J., R. W. McEntire, C. Schlemm II, A. T. Y. Lui, G. Gloeckler, S. P. Christon, and F. Gliem, GEOTAIL energetic particles and ion composition instrument, J. Geomag. Geo-electr.,46,39±57, 1994.
Zwickl, R. D., D. N. Baker, S. J. Bame, W. C. Feldman, J. T. Gosling, E. W. Hones, Jr., and D. J. McComas,Evolution of the Earth's distant magnetotail: ISEE3 electron plasma results,