Flow coefficient measurements for an
engine cylinder head under transient flow
conditions with continuous valve lift change
Daesan Oh1, Choong Hoon Lee 2* 1
Researcher, 2nd Seoul Team, Defense Agency for Technology and Quality 37, Hoegi-ro, Dongdaemun-gu, Seoul, Korea
1
Professor, Dept. of Mechanical and Automotive Engr., Seoul National University of Science and Technology 232 Kongneungro, Nowon-ku, Seoul, 139-743, Korea
2*
corresponding author,[email protected]
Abstract—A flow coefficient measurement system which is operated under an unsteady intake flow
condition in the intake port of a diesel engine cylinder head was developed. In order to determine the actual engine intake flow condition, the valve lift of the intake valve, whose rod is in contact with the camshaft, is varied continuously by rotating the camshaft directly. While varying the rotation speed of the camshaft, the flow coefficients were calculated by measuring various sensor signals, in this case the surge tank pressure, differential pressure in the flow meter, the valve lift when synchronized with the camshaft angle position, and the intake air temperature. The measurement of the flow coefficient was automated using a DAQ board and a computer. The flow coefficients change with the valve lift, and the effects of inertia of the intake flow on the flow coefficients are identified. The mean flow coefficients are obtained by integrating flow coefficients over the camshaft angle position.
Keyword-flow coefficient, intake port, cylinder head, valve lift, camshaft
I. INTRODUCTION
The rapid mixing of air and fuel in a diesel engine is one of the most important parameters affecting the performance of this type of engine, and this is especially true for a direct injection diesel engine. The main parameters affecting the air-fuel mix of a diesel engine are the fuel injection pressure and timing [1, 2], the shape of the combustion chamber [3, 4] and the swirl flow within the combustion chamber [5]. The swirl flow, which forces the intake air to move in a tangential direction during the compression stroke, is typically generated from a helical intake port in the engine cylinder head [6]. Highly pressurized injected spray jets are deflected and dispersed by the tangential flow in the combustion chamber, which aids the mixing of the air and the fuel in the combustion chamber [7].
In general, the swirl flow characteristic of the intake port in a diesel engine is evaluated in terms of both the swirl intensity and flow coefficient. The swirl intensity generated by the intake port is measured with either a torque meter or a rotating paddle existing in a cylinder [8, 9]. The flow coefficient of the intake port in the engine cylinder head is the parameter used to evaluate the degree of flow restriction through the intake port.
The swirl flow measuring equipment currently used by automotive manufacturers is operated manually by adjusting the valve lift several times. In the manual measurement method, the swirl flow is maintained in a steady state for each adjusted valve lift. However, the measurement of the swirl flow in an actual engine is very difficult due to both the limitation of the measuring probe when to access the combustion bowl and the highly unsteady flow condition. In order to determine the actual engine operating intake air flow condition, the adjustment of the valve lift was automated by rotating the camshaft, whose profile causes the valve lift to vary continuously.
II. EXPERIMENTS
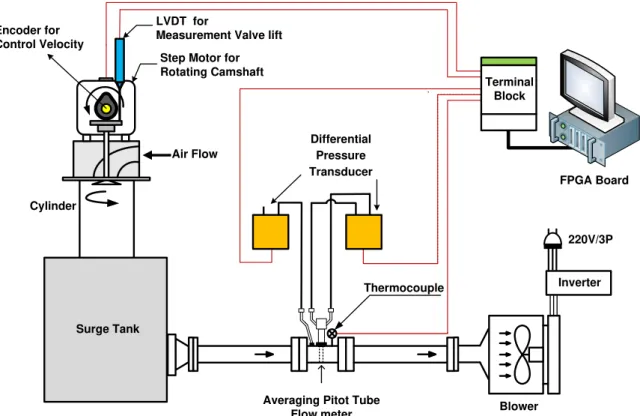
Fig. 1 shows the experimental setup used to measure the flow coefficient. The measurement system developed in this study was a modification of traditional flow measuring equipment in which a micro-meter for control of the valve lift is substituted for a camshaft driven by a step motor and several sensors, enabling the automatic measurement of the flow coefficient. Two differential pressure sensors were used to measure the differential pressure in an averaging Pitot tube (APT) flow meter and a surge tank pressure, respectively. The step motor that drives the camshaft allows the automatic adjustment of the valve lift with the camshaft profile. An LVDT (linear variable differential transformer) sensor was used to measure the valve lift. An encoder was used to measure the camshaft angle position.
For the measurement of the flow coefficient of the intake port in the cylinder head, air is sucked by a blower through the intake port over a valve with an adjusted lift, past the cylinder liner and surge tank, and into the flow nozzle, following the arrows shown in Fig. 1. The pressure drop between the atmosphere and the surge tank is equal to the pressure loss in the intake port and valve, as there is no significant pressure loss in the cylinder liner. The pressure loss, ΔP, across the APT flow meter is measured with a calibrated differential pressure sensor.
The valve lift of the cylinder head is varied continuously and has a profile identical to that of an actual engine with the rotation of the camshaft with the step motor directly. The digital output ports on the DAQ board can generate a square wave pulse with consecutive on/off (5 V/0 V) operations. The rotation speeds of the camshaft are set 10, 20, 30, 60, 120, 180 rpm.
In a traditional steady flow rig, the surge tank pressure is held constant during the flow coefficient measurement of the valve lift. The surge tank pressure is held constant by adjusting the by-pass valve. A typical setting value that corresponds to the surge tank pressure is 200 mmH2O or 400 mmH2O depending on the valve lift. However, in the flow coefficient measurement rig developed in this research, the surge tank pressure is changed continuously because the valve lift varies with the camshaft profile, which is more similar to a real engine. The intake flow induced by the continuous valve movement is closer to that of a real engine.
The measurement of the flow coefficient was made automatically using a high-speed DAQ system. LabView® was used for the automatic measurement and control. The process of the measurement of the flow coefficient is as follows. The step motor is rotated at a constant speed and the blower is always operated at its maximum speed for all of the experiments. When the flow parameter in the measurement system become stable, the surge tank pressure, the differential pressure at the APT flow meter, the intake air temperature, and the valve lift are measured and stored in a data file with encoded timing.
Blower Thermocouple
Averaging Pitot Tube Flow meter
Inverter 220V/3P Air Flow
Cylinder
Step Motor for Rotating Camshaft
Surge Tank
Differential Pressure Transducer
Terminal Block
FPGA Board LVDT for
Measurement Valve lift Encoder for
Control Velocity
III. RESULTS AND DISCUSSIONS
Fig. 2 shows the intake valve lift with the angle position of the camshaft. The measurement of the valve lift was repeated with 9° cam angle intervals. One measurement cycle consists of one revolution of the camshaft. The measurement cycle was repeated 39 times. The rotation speeds of the camshaft were controlled as 10, 20, 30, 60, 120 and 180 rpm. The valve lift ranges from 0.15 mm to 8.5 mm according to the camshaft angle. Even if the intake valve is in closing position, the valve lift maintained at 0.15mm, which made air flow into the cylinder. The minimum valve lift was maintained to avoid excessive vacuum pressure in the cylinder, which causes to overload the pressure sensor in the cylinder.
0 2 4 6 8 10
0 60 120 180 240 300 360
10 rpm
20 30
60
120 180
valv
e li
ft
(m
m)
cam angle (o)
Fig. 2. The measured valve lifts according to the cam angle using an LVDT
400 600 800 1000 1200 1400
0 60 120 180 240 300 360
10 rpm
20 30
60
120 180
hyd
ra
u
lic h
e
a
d
(mmH
2
O)
cam angle (o)
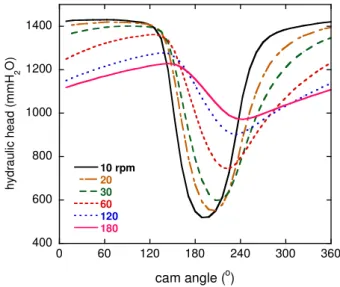
Fig. 3. The vacuum pressure below atmospheric pressure at the surge tank
Fig. 3 shows the measured differential hydraulic heads using the U-tube which senses the differential pressure between atmospheric and surge tank pressure with increasing the camshaft angle position. The differential hydraulic heads represent the magnitude of the vacuum pressure below the atmospheric pressure. The larger value of the differential hydraulic head means the larger vacuum pressure in the surge tank. At the camshaft rotation speed of 10 rpm, the measured differential hydraulic heads are nearly 1400 mmH2O at the cam angle ranges 0°-120° and 240°-360° where the valve lifts is nearly zero (0.15 mm). The hydraulic heads decrease as
the cam angle increase from 120° to 180° due to the increase of the valve lift and then the hydraulic heads
surge tank pressure due to the shorter time of one revolution time of the camshaft. As the camshaft rotation speeds increase from 10 rpm to 180 rpm step by step, the differential hydraulic heads decrease for all camshaft angles due to the increase of the flow restriction. Also, the camshaft angle position where the minimum value of the differential hydraulic head appears shifted to the right much more as the camshaft rotation speed increases. At the camshaft rotation speed of 10 rpm, the inertia effect nearly does not appear. Thus, the flow coefficient measured at the camshaft speed below 10 rpm is nearly same as that at the steady or quasi-steady state condition. Considering the real engine operating condition, the flow coefficient should be measured at high speed of camshaft as the real intake flow is unsteady.
The intake air mass flow rate passed through the intake valve was measured using the APT flow meter. The mass flow rate of the APT flow meter [12] was calculated from the measured differential pressure ΔPup-down between the upstream and downstream pressure tap. A parameter H based on the ΔPup-down is introduced to evaluate the flow rate characteristics [13]. The H-parameter can be calculated from Eq. (1) based on the differential pressure ΔPup-down. Pstatic is also measured using the U-tube.
a a i
T K kPa
P H
ρ −
Δ
= 9 .
. (1)
Pstatic: static pressure at the APT flow meter (kPa)
Tavg : average temperature at the APT flow meter (T1+T2)/2 (K)
ρstd : density of the air at standard conditions of 101.3 kPa and 293.15 K (kg/m3)
ΔPup-down: differential pressure between upstream and downstream of the APT flow meter (kPa)
H .
. +
=
(2)
100 150 200 250 300 350
0 60 120 180 240 300 360
10 rpm
20 30
60
120 180
mass f
lo
w
ra
te
(
k
g/
h)
cam angle (o)
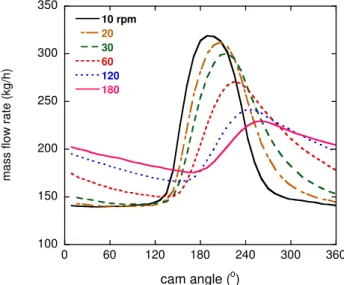
Fig. 4. Mass flow rate measured with the APT flow meter according to the cam angle
The intake air mass flow rate can be calculated from Eq. (2). Figure 4 shows the measured intake air mass flow rate with the camshaft angle position for the various camshaft rotation speeds. The intake air mass flow rate curve shown in Fig. 4 is overall inversely proportional to the differential hydraulic head shown in Fig. 3. The larger differential hydraulic head is correspondent to the smaller valve lift, which results in larger flow restriction, thus cause the smaller mass flow rate. The intake mass flow rate curves shows mirror shapes of the differential hydraulic heads curves with respect to the x-axis. The inertia effect with the rotation speed of the camshaft on the intake air mass flow rate is completely similar to that on the differential hydraulic heads.
The intake air mass flow rate through the valve can be described by well-known compressible flow equation for mass flow rate through a converging nozzle. The flow coefficient Cf based on the valve throat area for a valve lift position is defined by Eq. (3).
A V
C ρ i
=
(3)
− − = − k k i P P P k k V
ρ (4)
k P P = ρ ρ (5)
By Substituting Eq. (4) and Eq. (5) into Eq. (3), Eq. (6) is obtained.
− − = + k k k P P P P k k RT AP C
(6)
Where the subscript o and d mean stagnation values at port inlet and downstream of the valve, respectively. Po and Pd can be substituted by atmospheric pressure and surge tank pressure, respectively. If , Po and Pd are measured, flow coefficient Cf can be calculated from Eq. (5). Mean flow coefficient Cfmean is equal to the sum of the flow coefficient between cam angle α1 and α2 divided by the angle difference (α1 - α2) as Eq. (7)
α α α α α α − =
C C (7)Figure 5 shows the Vis calculated by Eq. (4) with the camshaft angle position as the camshaft rotation speed increases. The characteristics of the Vis curves show similar trends of the differential hydraulic heads. At the camshaft rotation speed of 10 rpm, the Vis varies from 160m/s to 80 m/s. The valve lift correspondent to the Vis of 160m/s is the minimum lift of 0.5mm, and the Vis of 80m/s to the maximum lift of 8.5mm. As the rotation speed of the camshaft increases, the Vis variation band width reduces. At 180 rpm of the camshaft rotation speed, the Vis varies approximately from 140 m/s to 130m/s. The intake flow inertia effects also appear in the Vis as similar to the results of the hydraulic heads.
50 100 150 200
0 60 120 180 240 300 360
10 rpm 20 30 60 120 180 V is ( m /s )
cam angle (o)
Fig. 5. Vis (isentropic flow velocity) passing through the intake valve as calculated from the differential pressure between the atmosphere and the surge tank pressure
0.1 0.15 0.2 0.25 0.3 0.35 0.4
0 60 120 180 240 300 360
10 rpm
20 30
60
120 180
fl
ow
c
o
e
ff
ici
en
ts
(
C f
)
cam angle (o)
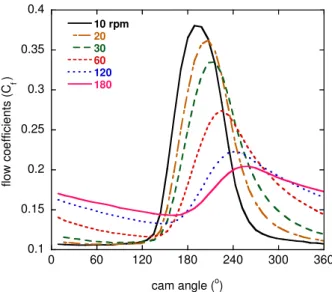
Fig. 6. Flow coefficient of the intake port in the engine cylinder head according to the cam angle
0.12 0.128 0.136 0.144 0.152 0.16 0.168 0.176 0.184
0 5 10 15 20 25 30 35 40
10 rpm
20
30
60
120 180
C fmean
ove
r on
e
cylc
le
(
90-1
8
0)
number of cycles
Fig. 7. Mean flow coefficients (Cfmean) over the crank angle integration range of 90° to 180°
0.16 0.165 0.17 0.175
0 5 10 15 20 25 30 35 40
10 rpm
20
30
60
120 180
C fme
a
n
ove
r one
cylc
le
(36
0
)
number of cycles
Fig. 8. Mean flow coefficients (Cfmean) over the crank angle integration range of 0° to 360°
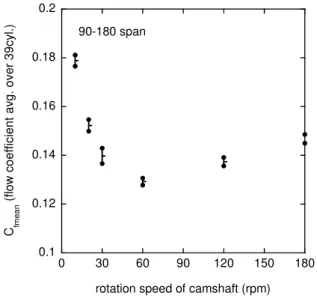
0.15mm-8.5mm whose range represents the intake process range. The Cfmean measurement was repeated 39 times. At the each rotation speed of the camshaft, the Cfmean varies up or down for each measurement cycle. Figure 7 shows the Cfmean variation for the various rotation speed of the camshaft. As the rotation speed increases, the Cfmean decreases in the rotation speed ranges 10-60 rpm and increases again in 90-180 rpm ranges. Figure 8 shows the mean value of the flow coefficients (Cfmean) over another measurement cycle which has integration range in the angle position from 0° to 360°.
0.1 0.12 0.14 0.16 0.18 0.2
0 30 60 90 120 150 180
C fm
e
a
n
(
fl
o
w c
o
ef
fi
ci
e
n
t
av
g
. o
v
e
r
39cy
l.
)
rotation speed of camshaft (rpm) 90-180 span
Fig. 9. The bandwidth of the mean flow coefficients (Cfmean,crank angle integration range of 90° to 180°) with the rotation speed of the camshaft
0.1 0.12 0.14 0.16 0.18 0.2
0 30 60 90 120 150 180
C fm
e
a
n
(
fl
o
w c
o
ef
fi
ci
e
n
t
av
g
. o
v
e
r
39cy
l.
)
rotation speed of camshaft (rpm) 360 span
Fig. 10. Mean flow coefficients (Cfmean, crank angle integration range 0°-360°) with the rotation speed of the camshaft
Figures 9 and 10 show the Cfmean variation band width as the rotation speed of the camshaft increases. Figure 9 shows the Cfmean with the crank angle integration range 90°-180° and it displays a parabola curve with increase
of the rotation speed of the camshaft. Figure 10 shows the Cfmean with the crank angle integration range 0°-360° and it displays nearly constant value with increase of the rotation speed of the camshaft. The Cfmean with the crank angle integration range 90°-180° cannot include the real intake flow process due to the intake flow inertia
effect. Even if the Cfmean with the crank angle integration range 0°-360° include the flow coefficient values which are measured in the valve lift of nearly zero, the contribution to the Cfmean with the crank angle integration range 0°-360° is relatively small, because the mass flow rate at the valve lift of nearly zero is small. Thus, the
IV. CONCLUSION
A valve lift control scheme which can determine the intake air flow condition of an engine under operation was automated by rotating a camshaft whose profile causes the valve lift to vary continuously. The flow coefficients of the intake port were measured while increasing the camshaft rotation speed in a stepwise manner, and the following conclusions were obtained.
(1) The flow coefficients of the intake port increase as the valve lift increases with a constant camshaft rotation speed.
(2) As the camshaft rotation speed increases, the inertia effect of the intake flow on the flow coefficients increases.
(3) The mean flow coefficients, which are averaged values over the integration range of 0 to 360 can remove the inertia effect on the flow coefficients and obtain a value of 0.165 nearly irrespective of the rotation speed of the camshaft.
ACKNOWLEDGMENT
This study was supported by the Research Program funded by the Seoul National University of Science and Technology.
REFERENCES
[1] F. E. Corcione, B. M. Vaglieco, G. E. Corcione, M. Lavorgna and R. Lanzafame, “Study of the combustion system of a new small DI diesel engine with advanced common-rail injection system,” SAE paper 2003-01-1858, 2003.
[2] C. W. Park, S. H. Kook and C. S. Bae, “Effects of multiple injections in a HSDI diesel engine equipped with common-rail injection system,” SAE paper 2004-01-0029, 2004.
[3] M. Besson, N. Hilaire, H. Lahjaily and P. Gastaldi, “Diesel combustion study at full load using CFD and design of experiments,” SAE paper 2003-01-1858, 2003.
[4] M. Schmid, A. Leipertz and C. Fettes, “Influence of nozzle hole geometry, rail pressure and pre-injection on injection, vaporization and combustion in a single-cylinder transparent passenger car common-rail engine,” SAE paper 2002-01-2665, 2003.
[5] Bosch, Automotive handbook, 7th ed., John Wiley & Sons, 2007.
[6] J. B. Heywood, Internal combustion engine fundamentals, McGraw-Hill Book Company, 1988.
[7] C. H. Lee, “An empirical correlation between spray dispersion and spray tip penetration from an edge detection of visualized images under the flow condition of a solid body rotating swirl,” Journal of Visualization, vol. 11, pp. 55-62, 2008.
[8] Pischinger, F. Development work on a combustion system for vehicle diesel engines. In FISITA Congress 1, 1962. [9] G. Tippelmann, “A new method of investigation of swirl ports,” SAE paper 770404, 1977.
[10] D. S. Oh and C. H. Lee, “Characteristics of Flow Coefficients in an Engine Cylinder Head with a Quasi-steady Flow Condition by Continuous Variation of the Valve Lift,” Journal of the KOSOS, vol. 25, no. 6, 2010.
[11] K. I. Kim and C. H. Lee, “Development of a new measurement method for an engine cylinder head by automating the swirl-measuring process,” Proc. IMechE Part D: J. Automobile Engineering, vol. 223, pp. 375-387, 2009.
[12] Rosemount Product Data Sheet, Diamond II-AnnubarⓇ bar Primary Flow Element, Dieterich, A Subsidiary of Rosemount Inc., 1998. [13] D. S. Oh and C. H. Lee, “A comparative study of flow rate characteristics of an averaging Pitot tube type flow meter according to H