American Journal of Engineering Research (AJER)
e-ISSN: 2320-0847 p-ISSN : 2320-0936
Volume-4, Issue-6, pp-219-223
www.ajer.org
Research Paper Open Access
w w w . a j e r . o r g
Page 219
Induce Drag Reduction of an Airplane Wing
1,
Md. Fazle Rabbi,
2,Rajesh Nandi,
3,Mohammad Mashud
Department of Mechanical Engineering, Khulna University of Engineering & Technology, Khulna-9203, Bangladesh
ABSTRACT:
This work describes the aerodynamic characteristics for aircraft wing model with and without slotted winglet. When an aircraft moves forward with a high speed then a small circulatory motion of air is created at the wingtip due to the pressure difference between the upper and lower surface of the wing is called vortices. This circulatory fluid tends to leak from lower to upper surface of wing which causes downwardmotion is called “downwash” and generates a component of the local lift force in the direction of the free stream called induced drag. Downwash causes reduction of lift and contribute induced drag to the total drag. Drag reduction for aerial vehicles has a range of positive ramifications: reduced fuel consumption, larger operational range, greater endurance and higher achievable speeds. An experimental study is conducted to examine the potentiality of slotted winglet for the reduction of induced drag, and for the improvement of lift coefficient without increasing the span of aircraft wing. The model composed of a swept wing built from NACA 0012 airfoil. The test conducted in subsonic wind tunnel of 1m×1m rectangular test section at flow speed 25m/s placing the wing without winglet, wing with winglet at 30° inclination, wing with winglet at 60° inclination, and wing with winglet at 70° inclination at angle of attack ranging from 0 to 16 degree. The test result shows 20-25% reduction in drag coefficient and 10-20% increase in lift coefficient by using slotted winglet.
Keywords-
Airfoil, induced drag, Wind tunnel, WingletI.
INTRODUCTION
w w w . a j e r . o r g
Page 220
in the 1980s assessed winglets and other drag reduction devices, and they found that wingtip devices (winglet, feathers, sails, etc.) could improve drag due to lift efficiency by 10 to 15% if they are designed as an integral part of the wing. The advantages of single winglets for small transports were investigated by Robert Jones, on which they can provide 10% reduction in induced drag compared with elliptical wings. Winglets are being incorporated into most new transports, including the Gulfstream III and IV business jets, the Boeing 747-400 and McDonnell Douglas MD-11 airliners, and the McDonnell Douglas C-17 military transport. The first industry application of the winglet concept was in sailplane. The Pennsylvania State University (PSU) 94-097 airfoil had been designed for use on winglets of high-performance sailplanes [6]. To validate the design tools, as well as the design itself, the airfoil was tested in the Penn State Low-Speed, Low-Turbulence Wind Tunnel. Performance predictions from two well-known computer codes were compared to the data obtained experimentally, and both were found in good agreement with the wind tunnel measurements. Another investigation was carried out on wingtip airfoils by J. J. Spillman at the Cranfield Institute of technology in England [7]. He investigated the use of one to four sails on the wingtip fuel tank of a Paris MS 760 Trainer Aircraft. Experiments on flight test confirmed the wind tunnel tests and demonstrated shorter takeoff rolls and reduced fuel consumption. Spillman later investigated wingtip vortex reduction due to wing tip sails, and found lower vortex energy 400-700 m behind the aircraft, although the rate of decay beyond that was somewhat lower . A biologist with an aerodynamic background has done extensive investigation of the split wingtips of soaring birds and he demonstrated that the tip slots of soaring birds reduce induced drag and increase the span factor of the wings. He found remarkable improvements of slotted wingtips compared with conventional wing with a Clark Y airfoil by reducing the drag of 6% [8]. In 1999, Boeing formed the joint venture company APB with Aviation Partners, Inc., to develop blended winglets for Boeing airplanes. Boeing adopted the blended winglet technology as standard equipment for the BBJ in 2000 and APB certified the winglets for the 700 and 737-800 airplanes in 2001. Since then, APB has certified blended winglets for retrofit installation on other Boeing airplane models. Blended winglets are also installed in production on Next-Generation 737-700/-800/-900ER models [9].II.
MODEL
CONSTRUCTION
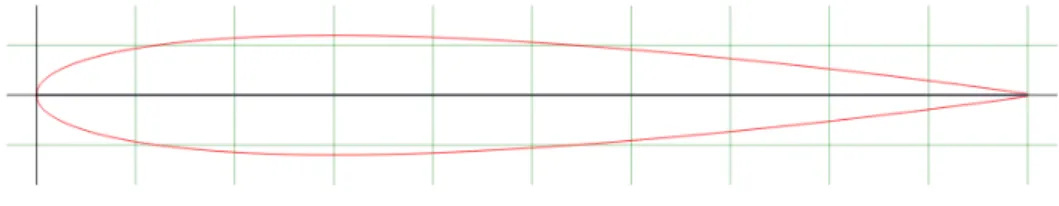
The model composed of a wing and a winglet. For the construction purpose NACA 0012 airfoil was used for the whole structure and finally was fabricated using wood.
Fig 1: NACA 0012 airfoil.
w w w . a j e r . o r g
Page 221
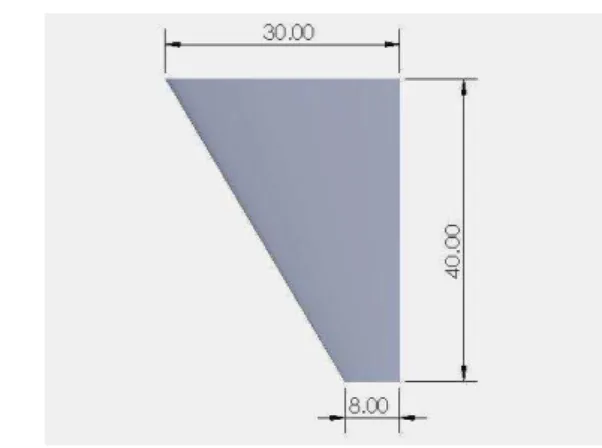
Fig 2: Geometry slotted Winglet (all scale in mm). Fig 3: Geometry of wing (all scale in cm).
III.
EXPERIMENTAL
SETUP
AND
PROCEDURE
Experiments were conducted in the Aerodynamics Laboratory Department of Mechanical Engineering (Khulna University of Engineering & Technology) with subsonic wind tunnel of 1 m× 1 m rectangular test section. The wind tunnel could be operated at a maximum air speed of 43 m/s and the turntable had a capacity for setting an angle of attack of 45 degree. A small sized model is appropriate to examine the aerodynamic characteristics for the experiments. If we desire to examine the aerodynamic characteristics of a large model, a large scale wind tunnel facility is necessary for testing or the inflatable wing must be drastically scaled down to match the usual wind tunnel size violating the Reynolds number analogy requirements. Furthermore, it would be difficult to support the inflatable wing a desirable attitude in these wind tunnel experiments. Since the vertical part of the aerodynamic force produces the lifting force necessary to suspend the load. We are mainly interested in the aerodynamic characteristics of each model. The model was placed in the testing section of the wind tunnel. Then the testing procedure is started of measuring the pressure of the constructed model at different point from leading edge to trailing edge along chord line from the reading of digital pressure measuring device. Fig.4 shows a photograph of the aircraft wing model with winglet, which is mounted horizontally in the test section of the wind tunnel. For the complete testing the constructed model, Sub-sonic wind tunnel and pressure measuring instrument were used as required apparatus. At the first step of the experimental procedure the constructed model aircraft with NACA 0012 without winglets was placed inside the testing section of the wind tunnel. By placing wing without winglet the testing section was closed to start the measurement. For different angle of attack pressure on the upper and lower surfaces were measured. After this the wing along with 30° winglet inclination was placed in the wind tunnel and pressures on the upper and lower surfaces were measured. The winglet angle were then changed to 60° and then finally to 70˚ and placed inside the wind tunnel and similar test procedures were conducted as explained earlier. The velocity of the wind-tunnel was controlled by a regulator attached with the wind tunnel. The ambient pressure, temperature and humidity were recorded using barometer, thermometer, and hygrometer respectively for the evaluation of air density in the laboratory environment. The tests were carried out with free-stream velocity of 25m/s. When the measurement of data had been complete then the calculation process was started. From the measured pressure the lift coefficient and drag coefficient was calculated by using the mathematical relation. Lift to Drag ratio was calculated from the lift coefficient and drag coefficient.
w w w . a j e r . o r g
Page 222
IV.
RESULTS
AND
DISCUSSION
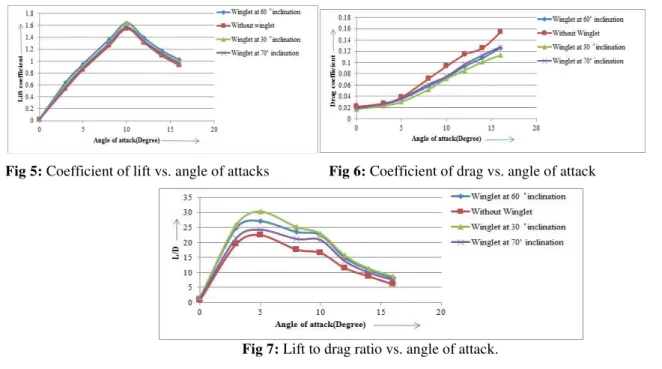
Wind tunnel measurements using the constructed wing model without winglet and with winglet were done. The coefficient of lift and the coefficient of drag have been calculated from the experimental results. Also various graphs have been drawn to examine the measured and calculated data nature. The lift coefficient characteristics of the aircraft wing model under test are shown in Fig.5. The lift increases with increase in angle of attack to a maximum value and thereby decreases with further increase in angle of attack. The initial value of lift coefficient at zero angle of attack for a chord based Reynolds number 1.36 × 10⁵ is 0.0185 instead of 0 because of inaccuracy during constructing the wing. The maximum value of the lift coefficient is 1.542 and this maximum values occur at an angle of attack of 10 degree. The experiments have been done up to an angle of attack of 16 degree. At the maximum angle of attack of 16 degree the lift coefficient is 0.931. The reason for a drop in lift coefficient beyond a certain angle of attack e.g. 10 degree is probably due to the flow separation, which occurs over the wing surface instead of having a streamlined laminar flow there. This condition is called stalling condition and the corresponding angle of attack is called stalling angle. The stalling angle happens to be approximately 10 degree. The lift coefficient data for slotted winglet for the three configurations i.e. configuration 1(winglet inclination 30o), configuration 2 (winglet inclination 60o), and configuration (winglet inclination 70˚) are given in Fig.5. In the case of the winglet for all configurations 1, 2, and 3 a similar pattern is observed. For the Reynolds number of 1.36x10⁵ the maximum
lift coefficients for configuration-1, for configuration-2, and configuration-3 are 1.63, 1.643 and 1.571 respectively
corresponding to an angle of attack of 10˚ which is also the stall angle of attack. From the graph, it can be concluded that lift
coefficient for using winglet is higher than without winglet. The drag coefficient of the aircraft wing model under test is shown in Fig.6. The drag increases slowly with increase in angle of attack to a certain value and then it increases rapidly with further increase in angle of attack. The initial value of drag coefficient at zero angle of attack for 1.36x10⁵ Reynolds number is 0.0214. The value of the drag coefficient at the transition point i.e. at an angle of attack of 5 degree is 0.0381. The experiments have been done up to an angle of attack of 16 degree. At the maximum angle of attack of 16 degree the drag coefficient is 0.154. The rapid increase in drag coefficient, which occurs at higher values of angle of attack, is probably due to the increasing region of separated flow over the wing surface, which creates a large pressure drag. The drag coefficient data for slotted winglet for the three configurations i.e. configuration 1 (winglet inclination 30o), configuration 2 (winglet inclination 60o), and configuration 3(winglet inclination 70˚) are given in Fig.6. In the case of slotted winglet for all configurations 1, 2, and 3 a similar pattern has been observed. At 0˚ angle of attack the drag coefficients for the slotted winglet of configuration-1, slotted winglet of configuration-2, and slotted winglet of configuration-3 are 0.017, 0.018, and 0.0186 respectively. It appears that drag coefficient using winglet is lower than that of without winglet. The lift/drag ratio is the outcome of the observations made in the two preceding sections. It is observed from the Fig.7 that the lift/drag ratio for all the configurations considered increases with an angle of attack to its maximum value and thereby it decreases with further increase in angle of attack. In particular it is observed that the maximum lift/drag ratio for all the configurations considered in the study falls in the range of 5 to 8 degrees of angle of attack. The aircraft wing model without winglet gives a measured lift/drag ratio of 22.493 whereas the respective values of the lift/drag ratio for the configuration-1, configuration-2, and configuration-3 are 30.4, 27.17, and 24.297 respectively at an angle of attack of 5˚. The lift/drag ratio values for the angle of
attack of 8˚ are 17.659, 25.192, and 23.568 for aircraft wing model without winglet, winglet with 30 o inclination, winglet
with 60 o inclination, and winglet with 70˚ respectively. Practically it is observed that the lift/drag ratio versus angle of attack curve gives similar results for 4 to 8 degrees, for the winglet of configuration-1,for winglet of configuration-2, and for winglet of configuration-3. It can be said that the wing with winglet of configuration 1 (winglet inclination at 30˚) has the better performance as compared to configuration-2 (winglet inclination at 60˚) and configuration-3 (winglet inclination at
70˚) and it is giving the better lift/drag ratio (30.40).
Fig 5: Coefficient of lift vs. angle of attacks Fig 6: Coefficient of drag vs. angle of attack
w w w . a j e r . o r g
Page 223
V.
CONCLUSION
Following are the conclusions drawn from this investigation, i) Aerodynamic characteristics for the aircraft model with NACA wing No. 0012 have been presented, ii) Lift curve slope increases more with the addition of the slotted winglet and at the same time the drag decreases more for the aircraft model with slotted winglet giving an edge over the aircraft model without winglet as far as L/D for the slotted winglet is considered, iii) Slotted winglet of configuration1(winglet inclination 30˚) has, overall, the best performance, giving about 10-20% increase in lift 20-25% reduction in drag as compared to without winglet and it is giving the best lift/drag ratio, iv) This winglet design is capable to reduce induced drag force and convert wing tip vortices to additional thrust which will save cost by reducing the usage of fuel, noise level reduction and increase the efficiency of the aircraft engine.
NOMECLATURE
L= Lift forceD = Drag force c = chord length
NACA= National Advisory Committee for Aeronautics.
REFERENCES
[1] Srikanth G, Surendra Bogadi, “Experimental Investigation on the Effect of Multi-Winglets”, International Journal of Mechanical & Industrial Engineering, Volume-1 Issue-1, 2011.
[2] A. Hossain, A. Rahman, A. K. M. P. Iqbal, M. Ariffin, and M, Mizan, “Drag Analysis of an Aircraft Wing Model with and without Bird Feather like Winglet”, World Academy of Science, Engineering, and Technology 57, 2011.
[3] R.T.Whitcomb, “A Design Approach and Selected Wind-Tunnel Results at High Subsonic Speeds for Wing-Tip Mounted Winglets”, NASA TN D-8260, 1976.
[4] Whitcomb R. T., “Methods for Reducing Aerodynamic Drag,” NASA Conference Publication 2211, Proceedings of Dryden Symposium, Edwards, California, 16 September 1981.
[5] J. E.Yates, and C. Donaldson, “Fundamental Study of Drag and an Assessment of Conventional Drag-Due-To-Lift Reduction
Devices”, NASA Contract Rep 4004, 1986.
[6] M. D. Maughmer, S. S. Tmothy, and S. M. Willits, “The Design and Testing of a Winglet Airfoil for Low-Speed Aircraft”, AIAA Paper 2001-2478, 2001.
[7] J. J. Spillman, “The use of wing tip sails to reduce vortex drag”, Aeronautical Journal, September, pp. 387-395, 1978.
[8] Vance A. Tucker, “Gliding Birds: Reduction Of Induced Drag By Wing Tip Slots Between The Primary Feathers”, Journal of Experimental Biology, Vol. 180(1) 1993, pp. 285-310
[9] Reginald V. French, “Vortex Reducing Wing Tip”, U. S. Patent 4,108,403, 22 August 1978.
[10] P.R. Arora, A. Hossain, A. A. Jaafar, P. Edi, T. S. Younis, and M. Saleem, “Drag Reduction in Aircraft Model using Elliptical
Winglet”, Journal - The Institution of Engineers, Malaysia (IEM), Vol. 66, No. 4, pp. 1-8, 2005.
[11] Smith M. J., Komerath N., Ames R., Wong O., and Pearson J., “Performance Analysis of a Wing with Multiple Winglets,” AIAA Paper-2001-2407, 2001.