Uterine Artery Doppler Velocimetry of Uterine
Leiomyomas in Nigerian Women
Dopplervelocimetria da artéria uterina de leiomiomas
uterinos em mulheres nigerianas
Bukunmi Michael Idowu
1Bolanle Olubunmi Ibitoye
1Victor Adebayo Adetiloye
11Department of Radiology, Obafemi Awolowo University Teaching Hospitals Complex, Ile-Ife, Osun State, Nigeria
Rev Bras Ginecol Obstet 2017;39:464–470.
Address for correspondence Bukunmi Michael Idowu, FEACS, FMCR, Department of Radiology, Obafemi Awolowo University Teaching Hospitals Complex, Ile-Ife, Osun State, Nigeria
(e-mail: [email protected]).
Keywords
►
leiomyoma
►
uterine artery
embolization
►
Doppler
ultrasonography
Abstract
Objective
To describe the blood
fl
ow velocities and impedance indices changes in the
uterine arteries of leiomyomatous uteri using Doppler sonography.
Methods
This was a prospective, case-control study conducted on 140
pausal women with sonographic diagnosis of uterine leiomyoma and 140
premeno-pausal controls without leiomyomas. Pelvic sonography was performed to diagnose
and characterize the leiomyomas. The hemodynamics of the ascending branches of
both main uterine arteries was assessed by Doppler interrogation. Statistical analysis
was performed mainly using non-parametric tests.
Results
The median uterine volume of the subjects was 556 cm
3, while that of the
controls was 90.5 cm
3(
p
<
0.001). The mean peak systolic velocity (PSV), end-diastolic
velocity (EDV), time-averaged maximum velocity (TAMX), time-averaged mean
veloci-ty (Tmean), acceleration time (AT), acceleration index (AI), diastolic/systolic ratio
(DSR), diastolic average ratio (DAR), and inverse pulsatility index (PI) were signi
fi
cantly
higher in the subjects (94.2 cm/s, 29.7 cm/s, 49.1 cm/s, 25.5 cm/s, 118 ms, 0.8, 0.3,
0.6, and 0.8 respectively) compared with the controls (54.2 cm/s, 7.7 cm/s, 20.0 cm/s,
10.0 cm/s, 92.0 ms, 0.6, 0.1, 0.4, and 0.4 respectively);
p
<
0.001 for all values.
Conversely, the mean PI, resistivity index (RI), systolic/diastolic ratio (SDR) and
impedance index (ImI) of the subjects (1.52, 0.70, 3.81, and 3.81 respectively) were
signi
fi
cantly lower than those of the controls (2.38, 0.86, 7.23, and 7.24 respectively);
p
<
0.001 for all values.
Conclusion
There is a signi
fi
cantly increased perfusion of leiomyomatous uteri that is
most likely due to uterine enlargement.
Resumo
Objetivo
Descrever as velocidades do
fl
uxo sanguíneo e as alterações dos índices de
impedância nas artérias uterinas leiomiomatoso utilizando a ultrassonogra
fi
a Doppler.
Métodos
Estudo prospectivo, caso-controle, realizado em 140 mulheres
pré-meno-páusicas com diagnóstico ultrassonográ
fi
co de leiomioma uterino e em 140 controles
na pré-menopausa sem leiomiomas. A ultrassonogra
fi
a pélvica foi realizada para
received March 19, 2017 accepted June 30, 2017 published online August 7, 2017
DOI https://doi.org/ 10.1055/s-0037-1604489. ISSN 0100-7203.
Copyright © 2017 by Thieme Revinter Publicações Ltda, Rio de Janeiro, Brazil Original Article
Introduction
Leiomyomas/fibroids are benign uterine tumors that are more common in black people. Gray-scale ultrasonography is a reliable method of diagnosing these tumors, and it can be supplemented with Doppler mode to provide additional hemodynamic information.
Though the pulsatility index (PI) is currently the pre-ferred Doppler index in Obstetrics and Gynecology because it is sensitive to alterations in waveform shape and it analyzes the entire cardiac cycle,1 several other useful Doppler indices have been documented in the literature. Previous studies reported increased peak systolic velocity (PSV) and time-averaged maximum velocity (TAMX), as well as diminished pulsatility index (PI), resistivity index (RI), and systolic-diastolic ratio (SDR) in myomatous uteri compared with controls.2–6
The purposes of this study are: to compare the changes within the main uterine artery of myomatous uteri and normal uteri using several Doppler indices (in addition to the traditional ones); to explore the relationship between these changes in uterine volume and the clinical symptoms; and to compare the main uterine artery Doppler changes in women with recurrent leiomyoma (after a previous myo-mectomy) and those with primary tumors (without previous surgical or medical intervention).
Methods
This prospective, non-randomized, case-control study was performed over a one-year period in the Department of Radiology of our institution as approved by the Ethics in Research Committee of the hospital. The study participants were consecutively recruited, and consisted of 140
premeno-pausal women with sonographic features of uterine leiomyo-mas, as previously described by other authors,4,7,8and 140 premenopausal controls with normal leiomyoma-free uteri
and normal endometrial stripe thickness. Recurrent leio-myoma was defined as the presence of a dominant leiomyoma larger than 4 cm in size following previous myomectomy.9The exclusion criteria were: pregnancy, post-menopausal status (cessation of menses for more than 12 months), recent child-birth (less than 1 year prior to presentation),adenomyosis/ endometriosis, and coexisting pelvic pathologies, like ovarian tumors and pelvic inflammatory disease. Informed consent was obtained from all participants.
The participants’demographic and gynecologic histories were obtained, including age, parity, and history of previous myomectomy. Their body mass index was also determined. All the participants underwent sonography via the trans-abdominal route using MINDRAY real-time ultrasound ma-chine model DC-7 (Shenzhen Mindray Bio-medical Electronics, Nanshan, Shenzhen, China) with a convex transducer (with a frequency of 3.8-5.0 MHz) and Doppler functionality.
Transabdominal sonography was performed by applying the transducer to the abdominopelvic region to scan the uterus in at least two planes (transverse and longitudinal planes). The following sonographic parameters were recorded: the uterine length, the anteroposterior diameter, and the transverse di-ameter, which were used to estimate the uterine volume using the ellipsoid formula. The length of the uterus was measured in the longitudinal plane from the fundus to the external cervical os; its anteroposterior diameter was measured perpendicular to the plane of the length, while the transverse diameter was measured from cornu to cornu on a transverse image. The volume of the largest leiomyoma nodule was similarly deter-mined using the prolate ellipse formula. The uterine volume and dominant leiomyoma volume were divided into large and
diagnosticar e caracterizar os leiomiomas. A hemodinâmica dos ramos ascendentes de
ambas as artérias uterinas principais foi avaliada por meio de interrogatório Doppler. A
análise estatística foi feita principalmente por meio de testes não paramétricos.
Resultados
A média do volume uterino dos das pacientes foi de 556 cm
3, enquanto a
dos controles foi de 90,5 cm
3(
p
<
0,001). A média de velocidade de pico sistólico
(VPS), a velocidade diastólica
fi
nal (VDF), a velocidade máxima do tempo médio
(VMTM), a velocidade média do tempo médio (VMdTM), o tempo de aceleração (TA), o
índice de aceleração (IA), a relação diástole/sístole (RDS), a proporção diastólica média
(PDM) e o índice de pulsatilidade (IP) inversa foram signi
fi
cativamente maiores em
pacientes (94,2 cm/s, 29,7 cm/s, 49,1 cm/s, 25,5 cm/s, 118 ms, 0,8, 0,3, 0,6 e 0,8,
respectivamente) do que nos controles (54,2 cm/s, 7,7 cm/s, 20,0 cm/s, 10,0 cm/s,
92,0 ms, 0,6, 0,1, 0,4 e 0,4, respectivamente);
p
<
0,001 para todos os valores. Por
outro lado, o IP médio, o índice de resistividade (IR), a relação sístole/diástole (RSD) e o
índice de impedância (II) nas pacientes (1,52, 0,70, 3,81 e 3,81, respectivamente)
foram signi
fi
cativamente mais baixos do que os dos controles (2,38, 0,86, 7,23 e 7,24,
respectivamente);
p
<
0,001 para todos os valores.
Conclusão
Existe um aumento signi
fi
cativo da perfusão dos úteros leiomiomatosos,
que provavelmente se deve ao alargamento uterino.
Palavras-chave
►
leiomioma
►
embolização da
artéria uterina
►
ultrassonogra
fi
a com
small if they were larger or smaller than 200 cm3respectively.5
The other sonographic parameters recorded included: leio-myoma type (intramural, subserous, submucous, panmural, pedunculated, or in more than one site) and presence of degenerative changes (cystic, calcific, or mixed).
The Doppler interrogation was performed as previously described by other authors.10,11The transducer was placed longitudinally in the midline above the symphysis pubis. A longitudinal section of the uterus and the cervical canal was obtained to identify the internal cervical os. The transducer was then moved from side to side to the lateral border of the uterus until the para-cervical vascular plexus was seen. The color Doppler function was activated, and the uterine artery was identified at the level of the junction between the uterine body and the cervix, as it starts to make its ascent to the uterine body. Measurements were taken at this point, before the uterine arteries branch into the arcuate arteries. The pulsed Doppler gate (sample volume¼1 mm) was placed in the center of the vessel, and a Doppler insonation angle of less than 60 degrees was used to obtain a measure-ment line parallel to the arterial wall. The Doppler signal was updated until there was a clear and consistent waveform. Doppler velocimetry was repeated three times each in both the right and left uterine arteries, with an interval of at least 2 minutes between the measurements. The average value of the two arteries was used for analysis. The measurements were obtained after the visualization of at least three tofive consecutive arterial waveforms of similar amplitude. Blood velocity waveforms with the lowest RI or highest velocities were recorded.12–14A spectral analysis was performed elec-tronically (auto-trace) from a smooth curvefitted to the average waveform over three tofive cardiac cycles to obtain the following parameters: peak systolic velocity (PSV), end-diastolic velocity (EDV), systolic/end-diastolic ratio (SDR or S/D ratio¼PSV/EDV),6resistivity index (RI¼[PSV–EDV]/PSV),15 pulsatility index (PI¼[PSV– EDV][{PSVþEDV}]/2}),16 time-averaged maximum velocity (TAMX), time-averaged mean velocity (Tmean), and acceleration time (AT). The diastolic/systolic ratio or end-diastolic ratio (DSR or D/S ratio¼EDV/PSV),17 impedance index (ImI¼[S x D]/D2),18
inverse PI [¼ 1/PI],19 diastolic average ratio (DAR¼EDV/ TAMX),20 and the acceleration index (AI¼PSV/AT)21 were also calculated from the electronically generated indices.
The color and pulsed Doppler parameters, including the high passfilter, the sample volume and the velocity scale were optimized for the detection of slow flow.21,22 Low filtration (color wallfilter of 50–100 Hz) was used to detect the diastolicflow in the arteries.23The color box was kept small, covering only the area of interest, and the Doppler gain was set just below noise level. All of the participants were scanned by thefirst author.
The study data was analyzed with the Statistical Package for the Social Sciences (SPSS), version 20, for Windows (IBM Corp., Armonk, NY, US). The Mann-Whitney U test was used to compare the means because the uterine volumes and the accompanying Doppler indices were skewed and not nor-mally distributed. Due to similar reasons, the Spearman correlation analysis was used to determine the correlation
between the variables. The chi-squared test was used to compare two categorical variables, while the Kruskal-Wallis test was used when more than two variables were compared. The level of statistical significance was set atp0.05.
Results
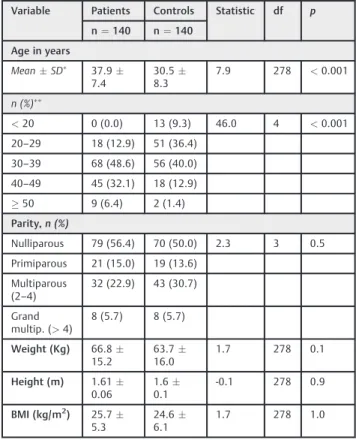
A total of 280 premenopausal women were recruited con-secutively for this prospective, case -control study compris-ing 140 subjects with uterine leiomyoma and 140 leiomyoma-free controls.The subjects’general character-istics are displayed in►Table 1.
Nineteen subjects (13.6%) were asymptomatic, while 121 (86.4%) had various leiomyoma-related symptoms. Menorrha-gia with abdominal swelling and/or pain was the most common presenting symptom, which was observed in 24 (17.1%) sub-jects. However, menorrhagia alone, and invarious combinations with other symptoms, like infertility and dysmenorrhea, was a feature in 70 (50%) subjects. Fourteen subjects (10%) had recurrent leiomyoma after previous myomectomy, with a median time interval of 5 years (range¼2–15 years) after surgery. Eight (57.1%) of these presented5 years post-myo-mectomy, while 6 (42.9%) of them were>5 years
post-myomectomy.
The subjects had a median uterine volume of 556 cm3 (range¼37–9,384 cm3) which was significantly larger (p<0.001) than that of the controls, who had a median
uterine volume of 90.5 cm3(range¼21
–304 cm3). When a
Table 1 Subjects’characteristics
Variable Patients Controls Statistic df p
n¼140 n¼140
Age in years
MeanSD 37.9 7.4
30.5 8.3
7.9 278 <0.001
n (%)
<20 0 (0.0) 13 (9.3) 46.0 4 <0.001 20–29 18 (12.9) 51 (36.4)
30–39 68 (48.6) 56 (40.0) 40–49 45 (32.1) 18 (12.9) 50 9 (6.4) 2 (1.4) Parity,n (%)
Nulliparous 79 (56.4) 70 (50.0) 2.3 3 0.5 Primiparous 21 (15.0) 19 (13.6)
Multiparous (2–4)
32 (22.9) 43 (30.7)
Grand multip. (>4)
8 (5.7) 8 (5.7)
Weight (Kg) 66.8 15.2
63.7 16.0
1.7 278 0.1
Height (m) 1.61 0.06
1.6 0.1
-0.1 278 0.9
BMI (kg/m2) 25.7 5.3
24.6 6.1
1.7 278 1.0
cut-off value of 200 cm3was used to divide the participants
’
uteri into large and small, 126 (90%) and 14 (10%) subjects had large and small uteri respectively, compared with 5 (3.6%) and 135 (96.4%) controls with large and small uteri respectively. This difference was statistically significant (p<0.001).
Degenerative changes were observed in 69 (49.3%) sub-jects: 35 (25%) had cystic degeneration, 22 (15.7%) had calcific degeneration, and 12 (8.6%) had both cystic and calcific degenerations.
All the evaluated Doppler indices of the main uterine artery showed statistically significant differences between the sub-jects and controls (►Table 2). The main uterine arteries of the subjects had significantly higher PSV, EDV, TAMX, Tmean, AT, AI, DSR, DAR and inverse PI, but significantly lower PI, RI, SDR and ImI than the main uterine arteries of the controls.
All the main uterine artery Doppler indices, except the AI, showed statistically significant differences between the sub-jects with uterine volume200 cm3and those with uterine volume 200 cm3. The latter group had higherflow velocities and lower resistance toflow than the former (►Table 3).
Symptomatic subjects (all symptoms inclusive) had sig-nificantly higher main uterine artery PSV, EDV, TAMX, and AI than the asymptomatic subjects. Furthermore, there were statistically significant differences in all the main uterine artery Doppler indices, except the AT and DAR, between the subjects with menorrhagia and those without. Those with menorrhagia had higher flow velocities and lower resistance toflow (►Table 4).
Table 3 Comparison of main uterine artery Doppler indices by uterine volume in the subjects
Doppler indices Uterine volume p†
200.0 cm3 >200.0 cm3
n¼14 n¼126
PSV (cm/s) 65.114.6 97.439.9 <0.001
EDV (cm/s) 12.85.7 31.619.1 <0.001
TAMX (cm/s) 23.87.9 51.926.2 <0.001
Tmean (cm/s) 12.74.7 26.96.7 <0.001
PI 2.41.1 1.40.6 <0.001
RI 0.80.1 0.70.1 <0.001
SDR 5.71.7 3.61.5 <0.001
AT (ms) 98.530.0 120.127.1 0.01
AI 0.70.3 0.80.3 0.20
DSR 0.20.1 0.30.1 <0.001
ImI 5.71.7 3.61.5 <0.001
DAR 0.60.3 0.60.2 0.01
1/PI 0.50.1 0.80.3 <0.001
Abbreviations: 1/PI, inverse pulsatility index; AI, acceleration index; AT, acceleration time; DAR, diastolic average ratio; DSR, diastolic/systolic ratio; EDV, end-diastolic velocity; ImI, impedance index; PI, pulsatility index; PSV, peak systolic velocity; RI, resistivity index; SDR, systolic/diastolic ratio; TAMX, time-averaged maximum velocity; Tmean, time-averaged mean velocity. †Mann-Whitney U test applied.
Table 4 Effect of menorrhagia on main uterine artery Doppler indices in the subjects
Doppler indices
Menorrhagia p†
Present (n¼70)
Absent (n¼70)
PSV (cm/s) 103.639.5 84.837.0 0.001
EDV (cm/s) 34.119.0 25.318.3 0.001
TAMX (cm/s) 55.426.7 42.824.7 0.001
Tmean (cm/s) 28.814.5 22.217.6 0.001
PI 1.40.7 1.60.7 0.03
RI 0.70.1 0.70.1 0.02
SDR 3.51.3 4.11.8 0.03
AT (ms) 116.228.4 119.627.7 0.37
AI 0.90.3 0.70.3 0.001
DSR 0.30.1 0.30.1 0.03
ImI 3.51.3 4.11.8 0.03
DAR 0.60.3 0.60.2 0.14
1/PI 0.80.3 0.70.3 0.03
Abbreviations: 1/PI, inverse pulsatility index; AI, acceleration index; AT, acceleration time; DAR, diastolic average ratio; DSR, diastolic/systolic ratio; EDV, end-diastolic velocity; ImI, impedance index; PI, pulsatility index; PSV, peak systolic velocity; RI, resistivity index; SDR, systolic/ diastolic ratio; TAMX, time-averaged maximum velocity; Tmean, time-averaged mean velocity.
Note:†Mann-Whitney U test applied. Table 2 Comparison of main uterine artery Doppler indices of
the subjects and controls
Doppler indices Subjects Controls p†
n¼140 n¼140
PSV (cm/s) 94.239.3 54.216.4 <0.001
EDV (cm/s) 29.719.1 7.72.6 <0.001
TAMX (cm/s) 49.126.4 20.07.2 <0.001
Tmean (cm/s) 25.516.4 10.04.2 <0.001
PI 1.50.7 2.40.4 <0.001
RI 0.70.1 0.90.03 <0.001
SDR 3.81.6 7.21.5 <0.001
AT (ms) 117.928.0 92.022.8 <0.001
AI 0.80.3 0.60.2 <0.001
DSR 0.30.1 0.10.03 <0.001
ImI 3.81.6 7.21.5 <0.001
DAR 0.60.2 0.40.1 <0.001
1/PI 0.80.3 0.40.1 <0.001
Abbreviations: 1/PI, inverse pulsatility index; AI, acceleration index; AT, acceleration time; DAR, diastolic average ratio; DSR, diastolic/systolic ratio; EDV, end-diastolic velocity; ImI, impedance index; PI, pulsatility index; PSV, peak systolic velocity; RI, resistivity index; SDR, systolic/ diastolic ratio; TAMX, time-averaged maximum velocity; Tmean, time-averaged mean velocity.
There were no statistically significant differences between all the main uterine artery Doppler indices of the subjects with previous myomectomy and of those without (►Table 5).
All the main uterine artery Doppler indices of the subjects showed a significant correlation with the subjects’uterine volume. The PSV, EDV, TAMX, and Tmean showed strong positive correlations with the uterine volume (correlation coefficient [r] 0.6), while the PI, RI, SDR, and the ImI showed moderate negative correlations with the uterine volume (r¼- 0.4 to - 0.6). The main uterine artery PSV, EDV, TAMX, Tmean, PI, AT, DAR and inverse PI of the controls correlated weakly with the uterine volume (►Table 6).
Significantly higher main uterine artery flow velocity indices (except AI and DAR) and significantly lower resis-tance toflow were noted in subjects who hadfibroids with degenerative changes compared with those without degen-erative changes.
Discussion
Doppler sonography in Gynecology is an important adjunct to gray-scale sonography, with established roles in the assess-ment of infertility, uterine leiomyomas, pelvic arteriovenous malformations, hormone replacement therapy, etc.13,14In this study, the women with uterine leiomyomas showed a signifi -cant increase in uterine perfusion/bloodflow compared with
the controls, as evidenced by the elevation of uterine artery Doppler indices reflecting blood flow velocity (PSV, EDV, TAMX, Tmean, DAR, AT and AI) with increase in uterine volume, while the indices reflective of the degree of resistance to blood flow or vascular impedance (PI, RI, SDR, ImI, inverse PI) diminished with increase in uterine volume. This decrease in resistance to bloodflow could be due to the uncoiling of the uterine artery with uterine enlargement in the leiomyomatous uterus.6 Similar uterine artery uncoiling and diminution of resistance has been observed in enlarged gravid uteri.6The myometrial vasculature also enlarges24,25to supply the hyper-vascular networks present in uterine leiomyomas, which further decreases the resistance to bloodflow.
Increase in bloodflow velocity indices with increasing uterine volume was also noted in the controls, with weak statistical significance. This suggests that uterine enlarge-ment rather than the mere presence of the leiomyomatous tumor is mainly responsible for the observed alteration in the uterine artery bloodflow to the leiomyomatous uteri. Furthermore, women with a uterine volume>200 cm3had
significantly higherflow velocities and lower vascular ImIs than those with uterine volume200 cm3. This is similar to the results obtained by Farmakides et al6and Alatas et al.5
Leiomyomas with degenerative changes showed higher flow velocities and lower resistance to bloodflow in the main uterine artery. This is in agreement with previous studies,2,26
Table 5 Effect of previous myomectomy on main uterine artery Doppler indices in the subjects
Doppler indices History of previous myomectomy
p†
Present (n¼14)
Absent (n¼126)
PSV (cm/s) 122.162.7 91.134.8 0.05
EDV (cm/s) 42.032.4 28.316.6 0.1
TAMX (cm/s) 63.942.4 47.423.7 0.2
Tmean 36.730.6 24.313.7 0.1
PI 1.40.4 1.50.8 0.9
RI 0.70.1 0.70.1 0.5
SDR 3.40.9 3.91.7 0.5
AT (mms) 126.737.1 116.926.8 0.5
AI 0.90.3 0.80.3 0.1
DSR 0.30.1 0.30.1 0.5
ImI 3.40.9 3.91.7 0.5
DAR 0.60.1 0.60.2 0.1
1/PI 0.80.2 0.80.3 0.9
Abbreviations: 1/PI, inverse pulsatility index; AI, acceleration index; AT, acceleration time; DAR, diastolic average ratio; DSR, diastolic/systolic ratio; EDV, end-diastolic velocity; ImI, impedance index; PI, pulsatility index; PSV, peak systolic velocity; RI, resistivity index; SDR, systolic/ diastolic ratio; TAMX, averaged maximum velocity; Tmean, time-averaged mean velocity.
Note:†Mann-Whitney U test applied.
Table 6 Correlation
between uterine volume and Doppler indices of the main uterine artery (UtA)
Doppler indices
Subjects (n¼140) Controls (n¼140)
Correlation coefficient, r
p Correlation
coefficient, r
p
PSV (cm/s)
0.6 <0.001 0.4 <0.001
EDV (cm/s)
0.7 <0.001 0.3 <0.001
TAMX (cm/s)
0.7 <0.001 0.4 <0.001
Tmean (cm/s)
0.6 <0.001 0.3 <0.001
PI 0.6 <0.001 0.3 <0.001
RI 0.5 <0.001 0.1 0.54
SDR 0.5 <0.001 0.02 0.76
AT (ms) 0.3 <0.001 0.4 <0.001
AI 0.4 <0.001 0.03 0.72
DSR 0.5 <0.001 0.03 0.75
ImI 0.5 <0.001 0.03 0.75
DAR 0.4 <0.001 0.2 0.01
and could be due to the fact that degenerating leiomyomas are often large and rapidly growing, eventually outgrowing their blood supply. Such rapid growth probably requires greater blood supply to support the metabolic activities.
The study also found that the bloodflow velocity indices of the main uterine artery were significantly higher in symptomatic subjects compared with asymptomatic sub-jects. When menorrhagia was considered as a specific symptom, those with menorrhagia had higher main uterine artery bloodflow velocity indices and lower vascular resis-tance indices, which is suggestive of a “compensatory”
increase in perfusion when menorrhagia occurs. These two observations suggest that the presence of menorrhagia leads to significant alterations in the main uterine artery Doppler indices. A similar pattern was documented by Hurskainen et al,27 who reported a significant inverse correlation between the uterine artery PI and the amount of blood loss in menstruating women (those with lower uterine flow impedance bled more), and concluded that there likely is a significant relationship between uterine vascular tone and menorrhagia.27
Apart from being a black population study,22–30 the markedly larger uterine volumes in this study could also be due to the fact that the majority of the patients in this environment present late, often after failure of alternative therapies, or due to the prohibitive cost of orthodox medical treatments. These markedly larger sizes may also explain the much lower Doppler indices in this study compared with those of some previous studies.2,4,5Moreover, the median uterine volume of the subjects in this study was 556 cm3, which is much higher than the reported mean uterine volumes of 128.5 cm3, 187.4 cm3, 276.2 cm3, 305 cm3, 312 cm3, and 381.16 cm3by Tsuda et al,31 Alcazar et al,4
Alatas et al,5Tranquart et al,32Danisman et al,14and Samani et al12respectively.
There were no significant differences between the main uterine artery Doppler indices of uteri with recurrent leio-myomas and those with primary tumors. This is most likely due to the fact that there was no statistically significant difference between the uterine volumes of the two groups; increase in uterine volume is the main contributor to the alterations in main uterine artery Doppler indices. Leiomyoma recurrence could be due to de novo growth of new tumors from previously normal myometrial cells post-myomectomy, or due to persistent undetected tumors (remnants) left unintention-ally from an incompletefibroid surgery.33Obed et al,33who defined recurrence as the presence of a leiomyoma of at least 2 cm in diameter upon ultrasound scan, reported an overall recurrence rate of 20.7% at 10 years post-myomectomy.
The limitations of our study include the fact that the sonographic diagnosis of leiomyoma was not confirmed with histology. However, several studies have shown the increased sensitivity and specificity of the sonographic diag-nosis of leiomyomas with more modern ultrasound scanners. There was also difficulty in obtaining accurate measurements of very bulky, leiomyomatous uteri and huge pedunculated leiomyomas extending to the upper abdomen. Split-screen measurements were employed in such cases.
Conclusion
In conclusion, there is increased perfusion of the myomatous uterus, as evidenced by increased bloodflow velocity indices and reduced vascular impedance indices in their main uter-ine artery compared with the controls. These changes are more likely due to increased uterine volume rather than the mere presence of myomas. No significant differences were detected between the main uterine artery Doppler indices of uteri with recurrent leiomyoma and those with primary tumors.
Contributions
Idowu BM, Ibitoye BO and Adetiloye VA contributed with the conception and design, data collection and analysis, interpretation of data, writing of the article, critical re-view of the intellectual content, andfinal approval of the version to be published.
Conflicts of Interest
None to declare.
References
1 Gómez O, Figueras F, Fernández S, et al. Reference ranges for uterine artery mean pulsatility index at 11-41 weeks of gestation. Ultrasound Obstet Gynecol 2008;32(02):128–132
2 Kurjak A, Kupesic-Urek S, Miric D. The assessment of benign uterine tumor vascularization by transvaginal color Doppler. Ultrasound Med Biol 1992;18(6-7):645–649
3 Sladkevicius P, Valentin L, Marsál K. Transvaginal Doppler exam-ination of uteri with myomas. J Clin Ultrasound 1996;24(03): 135–140
4 Alcázar JL, Griffioen M, Jurado M. Uterine artery bloodflow in women with uterine myomas. Eur J Ultrasound 1997;5(03): 165–169
5 AlataşG, Aksoy E, Akarsu C, Yakin K, Bahçeci M. The effect of uterine volume on uterine artery Doppler velocimetry in the myomatous state. Gynecol Obstet Invest 1997;43(01):55–59 6 Farmakides G, Stefanidis K, Paschopoulos M, Mamopoulos M,
Lolis D. Uterine artery Doppler velocimetry with leiomyomas. Arch Gynecol Obstet 1998;262(1-2):53–57
7 Muram D, Gillieson M, Walters JH. Myomas of the uterus in pregnancy: ultrasonographic follow-up. Am J Obstet Gynecol 1980;138(01):16–19
8 Laughlin SK, Baird DD, Savitz DA, Herring AH, Hartmann KE. Prevalence of uterine leiomyomas in thefirst trimester of preg-nancy: an ultrasound-screening study. Obstet Gynecol 2009; 113(03):630–635
9 Myers SL, Baird DD, Olshan AF, et al. Self-report versus ultrasound
measurement of uterine fibroid status. J Womens Health
(Larchmt) 2012;21(03):285–293
10 Lefebvre J, Demers S, Bujold E, et al. Comparison of two different sites of measurement for transabdominal uterine artery Doppler velocimetry at 11-13 weeks. Ultrasound Obstet Gynecol 2012; 40(03):288–292
11 Hollis B, Mavrides E, Campbell S, Tekay A, Thilaganathan B. Reproducibility and repeatability of transabdominal uterine artery Doppler velocimetry between 10 and 14 weeks of gesta-tion. Ultrasound Obstet Gynecol 2001;18(06):593–597 12 Samani FG, Jabbary R, Taghizadeh S. Study on uterine artery blood
13 SosićA, Skupski DW, Streltzoff J, Yun H, Chervenak FA. Vascularity of uterine myomas: assessment by color and pulsed Doppler ultrasound. Int J Gynaecol Obstet 1996;54(03):245–250 14 Danisman N, Ekici E, Isik AZ, Zorlu CG, Gokmen O. Transvaginal
color Doppler analysis of benign uterine leiomyomas. Turk J Med Sci 1998;28:179–181
15 Pourcelot L. Applications cliniques de l’examen Doppler transcu-tane. In: Peronneau P, eds. Velocimetrie Ultrasonore Doppler. Paris: INSERM; 1974:780–785
16 Gosling RG, King DH. Ultrasonic angiology. In: Marcus AW, Adamson J, eds. Arteries and Veins.. Edinburgh: Churchill Living-stone; 1975:61–98
17 Allen KS, Jorkasky DK, Arger PH, et al. Renal allografts: prospective analysis of Doppler sonography. Radiology 1988;169(02): 371–376
18 Vetter K, Gonser M, Voigt HJ. Indices for the evaluation of Doppler sonograms. In: Sohn C, Voigt HJ, Vetter K, eds.Doppler Ultrasound in Gynecology and Obstetrics.. Stuttgart: Thieme; 2004:25–39 19 Kawai M, Kano T, Kikkawa F, Maeda O, Oguchi H, Tomoda Y.
Transvaginal Doppler ultrasound with colorflow imaging in the diagnosis of ovarian cancer. Obstet Gynecol 1992;79(02): 163–167
20 Maulik D, Yarlagadda P, Youngblood JP, Ciston P. Comparative efficacy of umbilical arterial Doppler indices for predicting adverse perinatal outcome. Am J Obstet Gynecol 1991;164(6 Pt 1): 1434–1439, discussion 1439–1440
21 Secil M, Dogra VS. Colorflow Doppler evaluation of uterus and ovaries and its optimization techniques. Ultrasound Clin 2008; 3:461–482
22 Bhatt S, Dogra VS. Doppler imaging of the uterus and adnexae. Ultrasound Clin 2006;1:201–221
23 Dubbins PA. Doppler ultrasound of the female pelvis. In: Allan PL, Dubbins PA, Pozniak MA, McDicken WN, eds. Clinical Doppler
Ultrasound. 2nd ed. Philadelphia, PA: Churchill Livingstone Else-vier; 2006:287–313
24 Farrer-Brown G, Beilby JOW, Rowles PM. Microvasculature of the uterus. An injection method of study. Obstet Gynecol 1970; 35(01):21–30
25 Farrer-Brown G, Beilby JOW, Tarbit MH. The vascular patterns in myomatous uteri. J Obstet Gynaecol Br Commonw 1970;77(11): 967–975
26 Szabó I, Szánthó A, Csabay L, Csapó Z, Szirmai K, Papp Z. Color Doppler ultrasonography in the differentiation of uterine sarco-mas from uterine leiomyosarco-mas. Eur J Gynaecol Oncol 2002;23(01): 29–34
27 Hurskainen R, Teperi J, Paavonen J, Cacciatore B. Menorrhagia and uterine artery bloodflow. Hum Reprod 1999;14(01):186–189 28 Kjerulff KH, Langenberg P, Seidman JD, Stolley PD, Guzinski GM.
Uterine leiomyomas. Racial differences in severity, symptoms and age at diagnosis. J Reprod Med 1996;41(07):483–490
29 Marshall LM, Spiegelman D, Barbieri RL, et al. Variation in the incidence of uterine leiomyoma among premenopausal women by age and race. Obstet Gynecol 1997;90(06):967–973
30 Baird DD, Dunson DB, Hill MC, Cousins D, Schectman JM. High cumulative incidence of uterine leiomyoma in black and white women: ultrasound evidence. Am J Obstet Gynecol 2003;188(01): 100–107 Doi: 10.1067/mob.2003.99
31 Tsuda H, Kawabata M, Nakamoto O, Yamamoto K. Clinical pre-dictors in the natural history of uterine leiomyoma: preliminary study. J Ultrasound Med 1998;17(01):17–20
32 Tranquart F, Brunereau L, Cottier JP, et al. Prospective sonographic assessment of uterine artery embolization for the treatment of
fibroids. Ultrasound Obstet Gynecol 2002;19(01):81–87 33 Obed JY, Bako B, Usman JD, Moruppa JY, Kadas S. Uterinefibroids: