INFLUENCE OF THE PHYSICAL ACTIVITY ON MOTOR
PERFORMANCE OF CHILDREN WITH LEARNING
DIFFICULTIES
Influência da atividade física no desempenho motor de crianças
com queixas de dificuldades de aprendizagem
Daniela Bento Soares (1), Eline Porto (2), Ademir de Marco (1),
Cíntia Alves Salgado Azoni (3), Iuri Victor Capelatto (1)
(1) Universidade Estadual de Campinas, Campinas, SP, Brasil. (2) Universidade Metodista de Piracicaba, Piracicaba, SP,
Brasil.
(3) Universidade Federal do Rio Grande do Norte, Natal, RN, Brasil.
Conlict of interest: non-existent
have biases in psychological, motor, social and
biological proiles. The brain plasticity stands out in
the biological process, as this is a clear link between
their experiences and the neurological development of human beings.
One of the most complex processes due to the plasticity of the nervous system, learning is only
possible by educational role through environment imposition3. An interesting fact that can be noticed
is that diferent types of learning involve not only diferent but also the neural circuits underlying
neural mechanisms4. Therefore, we hypothesize
that regardless of the speciicity of learning which the
child undergoes, general neural changes can occur, stimulating neurological development in general.
Speciically regarding to motor learning, one can
assume that new motor skills acquired can stimulate
the acquisition of other skills related to other areas, just as deicits in other segments may inluence the motor itness of an individual. Studies have shown that regular physical exercise can stimulate brain
plasticity5.
INTRODUCTION
The development of each person can be greatly inluenced by the environment in which it is inserted, with the possibility of these inluences being positive
or negative1. According to this ecological theory, the
medium becomes to have a role as important as the
biological aspects in relation to the individual, from
the assumption that change both in equal measure.
When the characteristics of the ofer positive role models and learning facilitators, development,
encompassing the physical, cognitive and social
spheres, among others, is more efusive manner,
especially during childhood2. It is believe that this
inluence of the environment on a child’s life may
ABSTRACT
Purpose: to analyze the motor performance of children with complains about learning diiculties after
the intervention of a motor activity program. Methods: twenty-two children (13 with complains and 9 without) among 7 to 11 years old have taken part in this study and they were submitted to a motor
evaluation; 14 children were selected for 12 sessions of the motor program related to fencing and circus activity. The data were analyzed with descriptive and inferential statistics. Results: only children
with complains about learning diiculties who were submitted to intervention obtained progression percentage higher than 20%; children, with and without diiculties, who took part in the intervention showed progression between 10 and 20%. The progression average in speciic abilities and total progression index were higher for children with complains. Conclusion: It is indicated the intervention
of Physical Education experts assisting children with diiculties, motivating them to do physical activity.
For the above reasons, the present study aimed
to evaluate and compare motor performance of children with and without complaints of diiculty in learning, after intervention with targeted physical
education classes.
METHODS
This study was characterized as exploratory nature and sought to identify relationships between variables. The research in question was approved
by the Research Ethics Committee at the home institution, under the document number 155.319,
of November 27, 2012 and those responsible for participating children signed an Informed Consent.
Sample characterization
Twenty-two children joined this study, divided into four groups as following: G1 – Children with
learning disability complaints that underwent
trough the intervention; G2 – Children with learning
disability complaints that did not undergo trough
the intervention; G3 – Children without learning
disability complaints that underwent trough the
intervention; and G4 – Children without learning
disability complaints that did not undergo trough the
intervention. The participating children were pointed
out by teachers and pedagogical tutors, indicating
those with diiculty and without learning disabilities
It was considered that this statement presents the daily observation and psycho pedagogical
super-vision lead by school personnel and therefore being validated as educational experts. These professionals based their selection on a compar
-ative analysis of the children’s room and their
development throughout the school year. For the
adjustment of children in diferent groups, the choice was randomized.
Table 1, Sample Characterization, indicates how the division of subjects among the groups described occurred and the number of people in each division. Learning is a large and complex cognitive
brain function. Skills in areas as reading, writing and mathematics show speciic requirements6,7,
however, children from the same age group not necessarily show compatible level of neuropsy
-chological maturation. Many of the children of the irst series just need more time to acquire the basic
skills related to language; these temporal problems
are common and relect the normal variability of
maturation.
At least 50% of students with learning problems have developmental disorder of motor coordination, suggesting that there may have vulnerability of neural work area, responsible for integrating sensory-motor information8. This population presents dii
-culties in bimanual coordination, manual dexterity and ine motor skills, which explains the occurrence of dysgraphia9. The diiculty in repeating rhythms
during kindergarten is closely related to learning to
read for literacy10. It has been demonstrated that
there are motor deicits in children with dyslexia and proicient in reading, and observe a statistically signiicant correlation with respect to chronological age of the children and their school performance11.
Medina-Papst and Marques12 emphasize the
importance of the development of the motor skills
and aspects allied to its application in school tasks
since the deiciencies in certain ields of devel
-opment can inluence learning in general. Moreover, they reairm Physical Education with a major role
in the school, in that it can structure a suitable
environment for the child to relect on his actions and practical experience, assisting and promoting
human development, especially motor development.
It is known that problems related to complaints of learning disability can lead to changes in
afective-emotional, motivational, interpersonal relationship,
and low scores on self-concept, due to its role in the dynamics of the individual’s personality13. Children
for children with learning diiculties in school, delays in psychomotor development, speaking diiculties,
writing, calculation and other neurological, mental or
sensory changes. The test administration follows the order of the ine motor skills, global motor function, balance, body structure, spatial organization, temporal organization and laterality. The tests are performed according to the chronological age of the child. The selected intervention group participated in a program of extra physical education classes, in the modalities of fencing and circuses. The proposed sessions were of approximately forty minutes once a week for three months, resulting in twelve classes. The dynamics were similar to conventional
practices, with adapted implements, constructed by the students themselves with materials provided by the researcher or previously made by the school; this way, the practices proposed in the intervention,
fencing and circuses could be replied in diferent places. Classes were recorded in the form of photo
-graphs, for the preparation of a ield journal, and further evaluation of the entire teaching applied. The entire program was handed over to the Physical Education teacher to continue to be applied after
studying the proposals with the same students who participated in the intervention. It was delivered to the school principal and teachers a report containing
a detailed description of the classes, the results of motor assessments of all children, the discussions, photos of activities, manufacturing of toys, how-to assembly manual as the sword of the newspaper, juggling ball and references of sites that bring ideas to the making of the classes. Individual results were
handed to the children, including the remaining
sections of the report described above and the toys.
All children were enrolled in a public school in
Campinas-SP between the second and ifth year of
elementary school.
Inclusion criteria were: age between 7 and 11
years old, learning diiculties (for G1 and G2), no complaint of learning diiculty (for G3 and G4). Exclusion criteria were considered: being under the inluence of psychoactive drugs / anticonvul -sants, psychotropic or antidepressant; children with primary sensory or motor problems or any other
neurological and / or psychiatric primary diagnosis of learning disorders.
Thus, this study presents itself as a pilot, which results may indicate evidence of the importance of physical activity in schools and its concern of
alerting teachers, physical education teachers and
other professionals working with multidisciplinary treatment involving diiculties and learning disabil
-ities. Although there was a small number of subjects
in the sample, the groups highlighted above attend the purposes given.
Materials
With the teachers, there was an interview in which
the educators indicated that most students had dii -culties in the classroom and those who were noted
for their good results. Parents and / or guardians
responded to semi-structured interview in order
to detect the characteristics of children and other information that would be attached to the motor and school performance. Finally, the participants held
motor evaluation, through the Motor Development
Scale (MDS), from Rosa Neto11.
The MDS is an individual battery of tests, with test duration of approximately 40 minutes. It is indicated
Table 1 – Sample Characterization
Group Number of members Age Group*
G1 8 9 years and 3 months
G2 5 8 years and 10 months
G3 6 8 years and 7 months
G4 3 8 years and 6 months
Total 22 8 years and 9 months
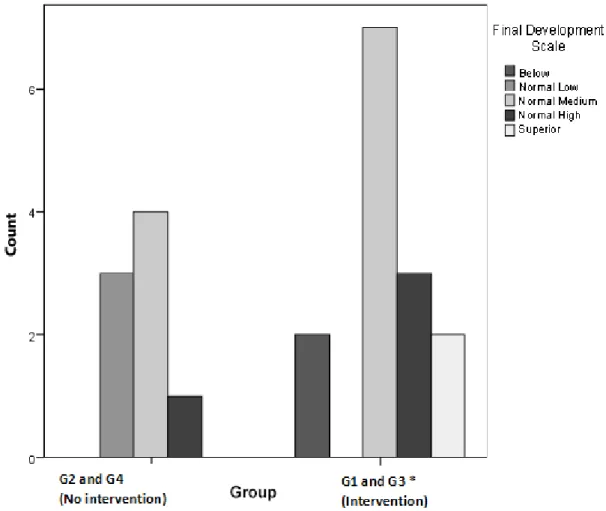
who ranked Normal Medium, High and Normal Superior in the group that underwent intervention is
higher and statistically signiicant (p = 0.001) than
the group without intervention, with a positive
corre-lation between them (r = 0.619).
Figure 1 presents the Final Development Scale,
as this indicates that the overall performance of the
child in the assessment tool, the groups that partici-pated (G1 and G3) and not participartici-pated in the
inter-vention (G2 and G4). The number of participants
RESULTS
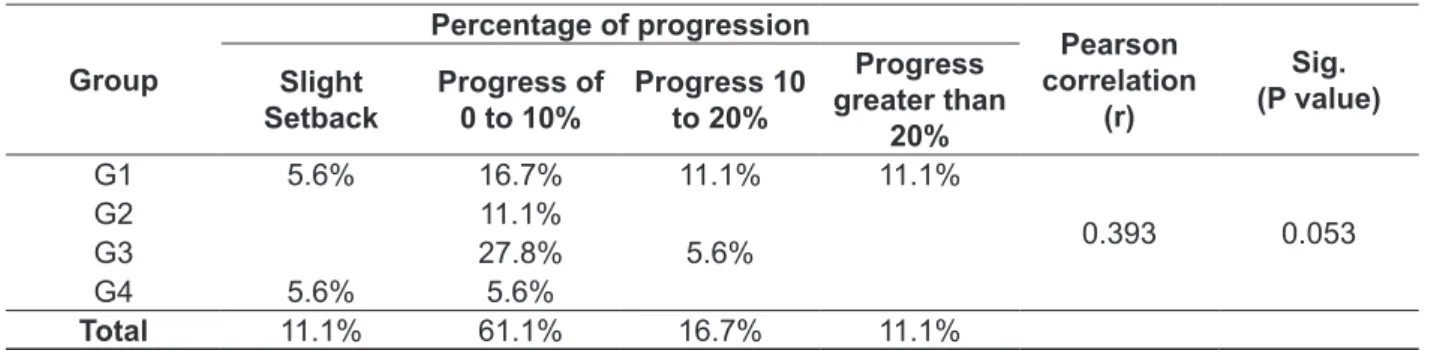
Compared with the result of motor assessment, the percentages of progression achieved between the irst assessment and the last evaluation after the intervention was analyzed. Only children in G1 (eight
members -11.1%) achieved percentage greater than 20% progression. In addition, only children who participated in the intervention (14 children, 63.6% related to G1 and G3) had progression between 10
to 20% between the irst assessment and the last evaluation, as can be seen in Table 3, below.
Statistical Treatment
After collection, the data were tabulated and analyzed according to the standard protocol. Then
these data were compared using descriptive and
inferential statistics through the Program IBM SPSS Statistics 21.0 for Windows ® (Statistical Package for Social Sciences). They were evaluated by Pearson’s correlation and Kruskal-Wallis test, both considering a statistically signiicant result when the
p value is equal to or less than 0.05.
Table 2 – Psychomotor functions related to modalities
Class Modality Content
21/09 Fencing Presentation mode and balance
24/09 Fencing Fine coordination, balance and agility
28/09 Fencing Fine Coordination
01/10 Fencing Spatial Location
08/10 Fencing Gross coordination, balance, agility
19/10 Fencing Gross and Fine coordination, balance, agility
22/10 Fencing Gross and Fine coordination, balance, agility
29/10 Fencing Gross and Fine coordination, balance, agility
04/11 Circus Gross and Fine coordination, balance, agility
12/11 Circus Gross and Fine coordination, balance, agility
23/11 Circus Gross coordination, balance, agility
26/11 Circus Gross coordination, balance, agility
Table 3 – Percentage of progression of motor evaluation groups
Group
Percentage of progression
Pearson correlation
(r)
Sig. (P value) Slight
Setback
Progress of 0 to 10%
Progress 10 to 20%
Progress greater than
20%
G1 5.6% 16.7% 11.1% 11.1%
0.393 0.053
G2 11.1%
G3 27.8% 5.6%
G4 5.6% 5.6%
Total 11.1% 61.1% 16.7% 11.1%
Label: Pearson correlation test; p <0.05; Sig:. Signiicance. * r = 0.619; “P-value” = 0.001; 22 points in the sample.
Figure 1 – Comparison of Final Development Scale achieved by the groups that did not participate in the intervention (G2 and G4) and who participated in the intervention (G1 and G3) (Graph generated by SPSS)
Table 4 – Comparison between intervention and no intervention groups with the overall results of motor assessment
Variables Average Standard
deviation
Pearson correlation
Sig. (P value)
Without intervention
Pre-Test 96.8250 8.53091
0.997 * 0.000 **
Post-Test 97.4286 7.49332
Intervention Pre-Test 96.2290 14.46677 0.880 * 0.000 **
Post-Test 104.708 15.5202001
Label: Pearson correlation test; Sig: signiicance,. * Correlation is signiicant at the 0.01 level (1 end); ** P <0.01.
and inal motor performance and the results show statistically signiicant diferences (p <0.01), but the intervention group that had obtained a inal average post-test (104.708) greater than the average for the
group without intervention (97.4286).
Table 4 shows the results of the initial motor assessment – represented by the term pre-test – and inal – post-test – without the intervention of
the groups (G2, and G4) and with intervention (G1
balance skills, ine motor skills, body schema and speed, and also the rate of overall progression were higher for the group of children with diiculty learning complaints. In the last two igures cited,
respectively, the average values are seven times
and six times higher for the group with complaints in
relation to the group without complaints.
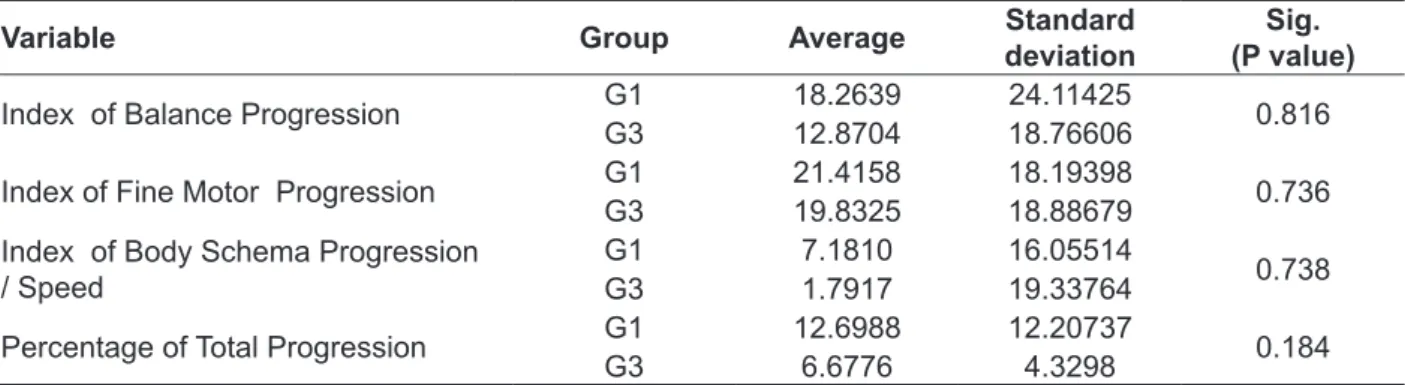
Tables 6, 7, 8 and 9 show comparisons between groups for the contents of progression of balance skills, motor skills, body structure, speed (lexibility)
and also to the overall progression.
Table 6 can be seen the comparison between the groups that participated in the intervention, diiculty
in learning complaints (G1) and without complaints
(G3). It is noticed that the average progression of
Table 5 – Comparison between the groups with and without complaints of abuse learning diiculty
with the general results of the motor assessment
Learning Disability Average Standard
deviation
Pearson
correlation Sig. (P value)
No Complaint
Pre-Test 103.1425 9.63423 1
Post-Test 106.7800 11.39485 .730 0.020 *
Complaining Pre-Test 84.7000 11.19911 1
Post-Test 95.3477 15.14336 .810 0.002 **
Label: Pearson correlation test; Sig: signiicance,. * Correlation is signiicant at the 0.05 level (1 end). ** Correlation is signiicant at the 0.01 level (1 end).
Table 5, in which appears the comparison of these variables for the groups of learning diicult
complaints (represented by G1 and G2) and without complaints (represented by G3 and G4),
also shows a statistically signiicant diference (p =
0.002) between the initial and inal results of motor assessment for the group complaining of learning disability. The group without diiculties also showed statistically signiicant diference, but with a value of p greater (p = 0.02).
Table 6 – Comparison of G1 with G3 referring to the Balance Progression, Progression of Fine Motor, Body Schema Progression / Speed and Total Progression variables
Variable Group Average Standard
deviation
Sig. (P value)
Index of Balance Progression G1 18.2639 24.11425 0.816
G3 12.8704 18.76606
Index of Fine Motor Progression G1 21.4158 18.19398 0.736
G3 19.8325 18.88679
Index ofBody Schema Progression
/ Speed G1G3 7.18101.7917 16.0551419.33764 0.738
Percentage of Total Progression G1 12.6988 12.20737 0.184
G3 6.6776 4.3298
Label: Kruskal-Wallis test; p <0.05; Sig: signiicance,. G1: Children with learning diiculties complaints and who underwent intervention;
Table 7 – Comparison of G2 with G4 referring to the Balance Progression, Progression of Fine Motor, Body Schema Progression / Speed and Total Progression variables
Variable Group Average Standard
deviation
Sig. (P value)
Index of Balance Progression G2 20.7792 9.18320 0.29
G4 8.3333 9.12871
Index of Fine Motor Progression G2 11.1345 25.84802 0.293
G4 14.2857 15.64922
Index ofBody Schema Progression
/ Speed
G2 14.5833 2.94628
0.009 ** G4 0.0000 0.00000
Percentage of Total Progression G2 3.0537 1.25470 0,035 *
G4 -0.7469 1.3811
Label: Kruskal-Wallis test; Sig: signiicance,. G2: Children with learning diiculties complaints who have not received the intervention; G4: Children without learning or attention complaints who have not received the intervention. * P<0.05; ** P <0.01.
Table 7 it was observed the comparisons of the
groups that did not participate in the intervention (G2
and G4). The G2 has learning diiculty complaints
and the G4 does not have it. Only in Percentage
of Total Progression and Progression Index of Body Schema Progression / Speed the G2 improvement was statistically signiicant compared to the group that has no diiculties.
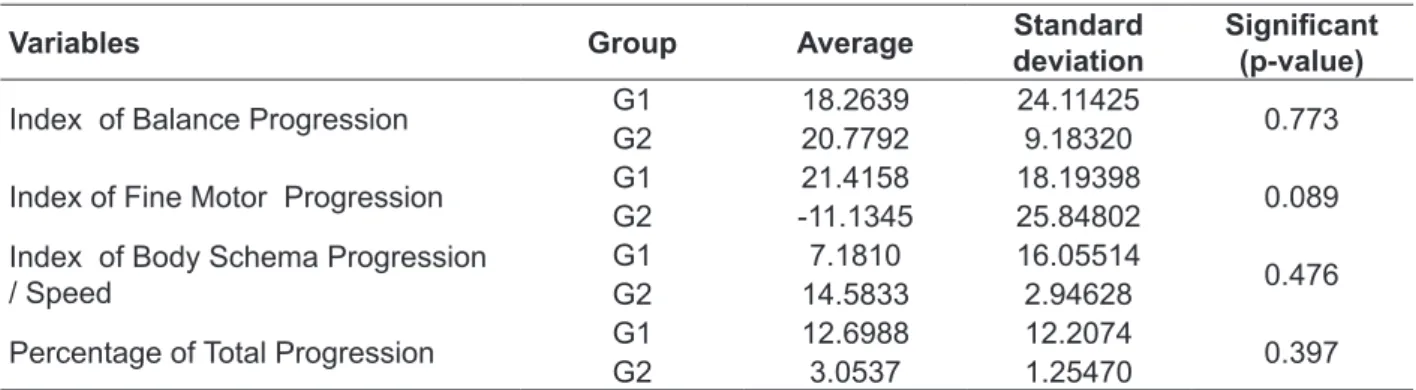
Table 8 – Comparison of G1 with G2 referring to Progression of Balance, Progression of Fine Motor, Body Schema Progression / Speed and Total Progression variables
Variables Group Average Standard
deviation
Signiicant
(p-value)
Index of Balance Progression G1 18.2639 24.11425 0.773
G2 20.7792 9.18320
Index of Fine Motor Progression G1 21.4158 18.19398 0.089
G2 -11.1345 25.84802
Index ofBody Schema Progression
/ Speed G1G2 14.58337.1810 16.055142.94628 0.476
Percentage of Total Progression G1 12.6988 12.2074 0.397
G2 3.0537 1.25470
Label: Kruskal-Wallis test; p <0.05; Sig: signiicance,. G1: Children with learning diiculties complaints who underwent intervention; G2:
Children with learning diiculties who have not received the intervention.
In comparison the two groups of children presenting learning diiculties (being that partici -pated in the intervention G1 and G2 did not undergo
intervention), one realizes that the G1 could progress
on skills presenting lags in which the emphasis was
not to allow any child to feel inferior to others. During
classes, It was taken care that the opportunity was given to all participants and was not demanded
performance, ie, the attempt to perform a given task was more important than the result itself. Thus, just
as predicted Carneiro et al.13, the good result may
have been the result of attention to children and their individual diiculties. These precepts are also
in accordance with Medina-Papst and Marques12,
Alano et al.16 and Silva and Beltrame17, which
highlight the importance of afection and attention in the process of rehabilitation of children, in which we can include extra physical education classes as potential proposals for children with learning dii -culties and also in learning disorders.
It is possible to verify that there were slight regression in two children of the groups analyzed
G1 and G4. In G1, the percentage shown
repre-sents two participants – a boy who, during the
survey period, participated in neuropsychological assessment in which detected mild mental retar-dation and a girl, also has suspected intellectual
disability and was referred for psychological evalu
-ation to detect possible problems. This may explain
why they present negative results at the study
table. As for the children who presented the G4
regression, the hypothesis is that this occurred by
DISCUSSION
Based on the results there were some difer
-ences in the assessment of children who passed
through the motor intervention than those who
have not had this experience. The data presented
in the previous section show that only children
presenting learning diiculties complaints who
underwent intervention (G1) achieved percentage greater than 20% progression; Furthermore, only children who participated in the intervention (G1 and
G3) had progression between 10-20%. This infor
-mation indicates that participation in extra physical education classes were suicient to maximize motor performance of participating children. These results also demonstrate that children complaining of learning disability have beneited most, suggesting that this type of intervention may be a way to assist them in improving their clinical proile. This
discussion is consistent with the claim that Capellini et al.8, Chaix et al.14 and Haslum and Miler15 which
reported that children presenting learning diiculties
also have motor problems that can be diminished
with stimulation of the same order. It can also
raise the hypothesis that the great improvement
of children learning diiculty complaints in school
compared to those without complaints may have
occurred, possibly for the irst time, these children
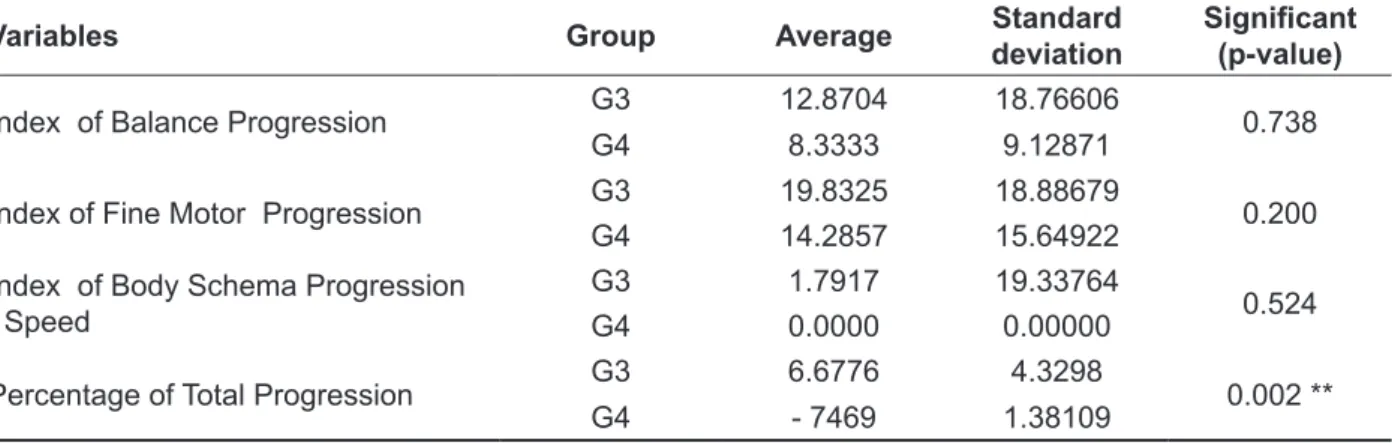
Table 9 – Comparison with G3 G4 referring to the Balance Progression, Progression of Fine Motor, Body Schema Progression / Speed and Total Progression variables
Variables Group Average Standard
deviation
Signiicant
(p-value)
Index of Balance Progression G3 12.8704 18.76606 0.738
G4 8.3333 9.12871
Index of Fine Motor Progression G3 19.8325 18.88679 0.200
G4 14.2857 15.64922
Index ofBody Schema Progression
/ Speed
G3 1.7917 19.33764
0.524 G4 0.0000 0.00000
Percentage of Total Progression G3 6.6776 4.3298 0.002 **
G4 - 7469 1.38109
Label: Kruskal-Wallis test; Sig: signiicance,. ** P <0.01; G3: Children without learning diiculties complaints who underwent interven
-tion; G4: Children without learning diiculties complaints who have not received the intervention.
Finally, Table 9 shows the results of the groups that have no complaint of learning disability (who
participated in the intervention G3 and G4 did not
participate). The data show that G3 average is
greater than G4 in all skills, whereas it is presented
These last mentioned results, it could be
observed that children with learning disabilities and
those who did not undergo speciic stimulation could
improve in body schema and overall progression.
However, the improvement in motor function was better in children with diiculties who have gone through speciic motor intervention. It can also be seen that the improvement was signiicant (quantita
-tively analyzing the averages obtained progression)
in children who underwent an intervention in the overall progression.
Comparing only the groups of children without complaint of learning diiculty, however, one can
observe that the group who participated in the inter-vention (G3) had better outcomes than the control
group (G4) in all skills, with a signiicant diference in overall progression, which conirms that partici
-pation in exercise programs are important for all
children12.
The high incidence of moderately signiicant correlations between the results is explained by the small number of subjects participating in this study. Thus, there is no claim that the efects of the
presented program will be repeated on the same research model with other children, because the
data may or may not follow linearity. However, these
results are important to encourage the discussion
about the importance of this type of intervention with this population and design new studies of the same shape, with the largest number of reviews.
It is observed in the literature articles that evaluate
the motor itness of children with diiculty in school
complaints, but no research like this that considers
ways to improve the performance of children in this
situation with motor interventions that are carried
out within the school context, in physical education classes, should also be performed.
This statement becomes true when observed, for example, that the results regarding to a inferior motor performance of children who have learning diiculty complaints corroborate Silva and
Beltrame17, whereas these authors claim that 30 to
50% % of children with motor diiculties, have also complained of diiculty associated with learning. As
is indicated by the literature, children with learning
disabilities evaluated also showed deicits in motor
coordination skills8, encompassed in this study as a
global movement, and the skills of bimanual coordi
-nation, manual dexterity and motor skills thin9. After
the intervention, children in this condition showed better results and even greater percentages than
those without complaints of diiculty in school, which can demonstrate that they have a great potential for
age-appropriate development.
Can be hypothesize that this satisfactory result was due to an intervention designed for stimulation The literature indicates that it is essential to ofer
all children diverse environments and stimuli that
provide means of solving problems, regardless of
having or not motor disability. Moreover, it is common
knowledge that physical exercise contributes widely to socialization, psycho-emotional development, fostering self-conidence and self-esteem, especially
during childhood18.
Final Development Scale, the overall perfor
-mance of children in the evaluation instrument, it is noted that the number of participants who reached
the rank Normal Medium, High and Normal Superior in the group that underwent intervention is larger
and statistically meaningful than the group without intervention, demonstrating that this was beneicial for better development of motor skills. In comparing
the groups that underwent an intervention, you can
see that the inal average in the post-test was higher than the mean of the group without intervention. There was also a statistically signiicant diference between the initial and inal results of motor assessment for the group complaining of diiculty
in learning, in relation to the group without learning
disabilities. The results infer that the intervention was more beneicial for children with poor school performance.
In comparison to the groups that participated in the intervention (G1 and G3) with each other, it is
observed that the average progression of balance skills, ine motor skills, body schema, speed and also the overall progression index were higher for the group of children with complaints of diiculty learning. In the last two igures cited, respectively, the average values are seven times and six times higher for the group with complaints. These data conirm the hypothesis that children with learning diiculty complaints have lower motor performance in these skills to what is expected, as indicated by
Alano et al16 and Silva and Beltrame17, however,
upon stimulation with the intervention showed
better performances, demonstrating that adequate
physical education classes and targeting children
with diiculties can make your equal or better perfor -mance when compared to children without learning
diiculties.
Compared to children who did not undergo
intervention, the group of children presenting learning diiculties had a signiicant improvement in relation to the skills of body schema, and speed
and overall progression towards children without
CONCLUSION
After verifying that children who have taken part
in an intervention showed statistically higher and
signiicant performance in motor evaluation and for those who joined physical education classes, the improvement was even greater for those with complaints of learning diiculties. It can be
concluded that the proper motor intervention can
enhance the motor performance on children in this age group and be even more signiicant for children with complaints of learning diiculty.
It is important to highlight that although the
number of participants does not allow generaliza
-tions about the subject, the results of this research demonstrate the validity and importance of educa
-tional projects focusing in dedication motor activities, contributing to the integral development of children in basic education. This study alerts the scientiic
community to this aspect and proposes deepen researches in this theme.
of motor coordination skills, with a choice of physical exercises that required the development of these.
For this, it was necessary to choose guiding themes
that could keep children stimulated in the realization of bodily practices. This factor helped to maintain the low level of absenteeism and also add cultural
content aimed at children, who did not previously
know the theme covered. All these factors could be
observed during class and were transcribed in the
ield diaries.
It was observed that participation in group
activities encouraged the socialization of children and the development of afective ties among partici
-pants, factors that themselves could provide better experiences at school.
Concludes, therefore, that appropriate motor intervention can improve the performance of motor skills needed for school learning and that it is possible to make a more efective action in a
physical education class, which assists both children
with diiculties as for children who do not have dii
-culties, motivating them to do physical exercise.
REFERENCES
1. Farias N, Buchalla CM. A Classiicação
Internacional de Funcionalidade, Incapacidade e Saúde. Rev. Bras. Epidemiol. 2005;8(2):187-93. 2. Anders Y, Rossbach HG, Weinert S, Ebert S,
Kuger S, Lehrl S, Maurice J. Home and Preschool
learning environments and their relations to the
3. Ferreira TL, Martinez AB, Ciasca SM. Avaliação psicomotora de escolares do 1º ano do ensino fundamental. Rev. Psicopedag.
[periódico na Internet]. 2010 [acesso em: 09 jan
2015]; 27(83): 223-35. Disponível em: <http:// pepsic.bvsalud.org/scielo.php?pid=S0103-84862010000200008&script=sci_arttext>
RESUMO
Objetivo: avaliar e comparar o desempenho motor de crianças com e sem diiculdade de aprendiza
-gem após intervenção com aulas de Educação Física direcionada. Métodos: izeram parte da pes
-quisa 22 crianças (13 com queixa e 9 sem queixa de diiculdade de aprendizagem) com idade entre 7 e 11 anos, submetidas à avaliação motora; 14 crianças selecionadas para intervenção realizaram 12 sessões de práticas voltadas à esgrima e atividades circenses. Os dados foram analisados por meio de estatística descritiva e inferencial. Resultados: apenas as crianças com queixas de diiculdades
de aprendizagem e que foram submetidas à intervenção alcançaram porcentagem de progressão total na avaliação motora maior que 20%; somente as crianças que participaram da intervenção apresentaram esta progressão entre 10 a 20%. As médias de progressão de habilidades especíicas e o índice de progressão total foram maiores para o grupo de crianças com queixa de diiculdade de aprendizagem. Conclusão: indica-se que são possíveis intervenções de proissionais da Educação
Física visando auxiliar crianças com diiculdades de aprendizagem e, motivando-as para à prática de atividades físicas.
12. Medina-Papst J, Marques I. Avaliação do desenvolvimento motor de crianças com diiculdades de aprendizagem. Rev. Bras. Cineantropom.
Desempenho Hum. 2010;12(1):36-42.
13. Carneiro GRS, Martinelli SC, Sisto FF.
Autoconceito e diiculdades de aprendizagem na escrita. Psicol. Rel. Crít. 2003;16(3):427-34. 14. Chaix Y, Albaret JM, Brassard C, Cheuret E, de
Castelnau P, Benesteau J et al. Motor impairment in
dyslexia: The inluence of attention disorders. Eur. J.
Paediatr. Neuro. 2007;11:368-71.
15. Haslum MN, Miler TR. Motor performance and dyslexia in a national cohort of 10-year-old children. Dyslexia. 2007;13:257-75.
16. Alano VR, Silva CJK, Santos APM, Pimenta RA, Weiss S, Rosa Neto F. Aptidão física e motora em escolares com diiculdades na aprendizagem.
RBMC. 2011;19(3):69-75.
17. Silva J, Beltrame TS. Desempenho motor e diiculdades de aprendizagem em escolares
com idades entre 7 e 10 anos. Motricidade. 2011;7(2):57-68.
18. De Marco, A. Crescimento e desenvolvimento
infantil. Rev. Mackenzie Educ. Fís. Esporte [periódico
na Internet]. 2010 [acesso em: 09 jan 2015]; 9:18-20.
Disponível em: <http://editorarevistas.mackenzie. br/index.php/remef/article/viewFile/2831/2507> interdisciplinar. [Tese]. Campinas (SP): UNICAMP;
1994.
5. Cotman CW, Berchtold NC. Exercise: a behavioral
intervention to enhance brain health and plasticity.
Trends Neurosci. 2002;25(6):295-301.
6. Lagae L. Learning disabilities: deinitions,
epidemiology, diagnosis, and intervention strategies. Pediatr. Clin. North Am. 2008;55:1259-68.
7. Pugh KR, Sandak R, Frost SJ, Moore D, Mencl WE. Examining reading development and reading
disability in English language learners: potential
contributions from Functional Neuroimaging. Learn.
Disab. Res. & Pract. 2005;20(1):24-30.
8. Capellini SA, Coppede AC, Valle TR. Função motora ina de escolares com dislexia, distúrbio e diiculdades de aprendizagem. Pró-Fono R Atual.
Cient. 2010;22(3):201-8.
9. Okuda PMM, Lourencetti MD, Santos LCA, Padula NAMR, Capellini SA. Coordenação motora ina de escolares com dislexia e transtorno do déicit de atenção e hiperatividade. Rev CEFAC.
2011;13(5):876-85.
10. Dellatolas G, Watier L, Le Normand MT, Lubart T, Chevrie-Muller C. Rhythm reproduction in kindergarten, reading performance at second grade, and developmental dyslexia theories. Arch.
Clin. Neuropsych. 2009;24:555-63.
11. Rosa Neto F. Manual de Avaliação Motora. Porto
Alegre: Artmed; 2006.
Received on: November 30, 2014 Approved on: April 15, 2015 Mailing address:
Daniela Bento Soares
Rua Coronel Manoel de Morais, 317 – apto 61 Campinas – SP – Brasil
CEP: 13073-022