American Society of Anesthesiologists Score: still
useful after 60 years? Results of the EuSOS Study
INTRODUCTION
In 1940, the American Society of Anaesthesiology (ASA) asked a committee of three physicians to develop a system for the collection and tabulation of statistical data for anesthesia that could be applicable under any circumstances. he ASA score(1) that originated from this project has since developed into one of the most commonly used clinical scoring systems in the world. he score was originally designed to focus only on Rui Paulo Moreno1,2, Rupert Pearse3, Andrew
Rhodes4 for the European Surgical Outcomes Study (EuSOS) Group of the European Society of Intensive Care Medicine and European Society of Anaesthesiology Trials Groups*
* Available in the electronic supplementary material
1. Neurocritical Intensive Care Unit, Hospital de São José, Centro Hospitalar de Lisboa Central, E.P.E. - Lisboa, Portugal.
2. Faculdade de Ciências Médicas, Universidade Nova de Lisboa - Lisboa, Portugal.
3. Barts and the London School of Medicine and Dentistry, Queen Mary University of London - London, United Kingdom.
4. Critical Care Medicine, St. George’s Healthcare NHS Trust and St. George’s, University of London - London, United Kingdom.
Objective: he European Surgical Outcomes Study described mortality following in-patient surgery. Several factors were identiied that were able to predict poor outcomes in a multivariate analysis. hese included age, procedure urgency, severity and type and the American Association of Anaesthesia score. his study describes in greater detail the relationship between the American Association of Anaesthesia score and postoperative mortality.
Methods: Patients in this 7-day cohort study were enrolled in April 2011. Consecutive patients aged 16 years and older undergoing inpatient non-cardiac surgery with a recorded American Association of Anaesthesia score in 498 hospitals across 28 European nations were included and followed up for a maximum of 60 days. he primary endpoint was in-hospital mortality. Decision tree analysis with the CHAID (SPSS) system was used to delineate nodes associated with mortality.
Results: he study enrolled 46,539 patients. Due to missing values, 873 Conflicts of interest: None.
Funding: The study was funded by the European Society of Intensive Care Medicine and by the European Society of Anaesthesia.
Submitted on January 20, 2015 Accepted on April 16, 2015
Corresponding author: Rui Moreno
Unidade de Cuidados Intensivos Neurocríticos do Hospital de São José
Centro Hospitalar de Lisboa Central, E.P.E. Rua José António Serrano,
1150-199 Lisboa, Portugal E-mail: [email protected]
Responsible editor: Jorge Ibrain Figueira Salluh
O escore da American Society of Anesthesiologists: ainda útil após
60 anos? Resultados do estudo EuSOS
ABSTRACT
Keywords: Anesthesiology; Reproducibility of results; Mortality; Postoperative period
patients were excluded, resulting in the analysis of 45,666 patients. Increasing American Association of Anaesthesia scores were associated with increased admission rates to intensive care and higher mortality rates. Despite a progressive relationship with mortality, discrimination was poor, with an area under the ROC curve of 0.658 (95% CI 0.642 - 0.6775). Using regression trees (CHAID), we identiied four discrete American Association of Anaesthesia nodes associated with mortality, with American Association of Anaesthesia 1 and American Association of Anaesthesia 2 compressed into the same node.
Conclusions: he American
Association of Anaesthesia score can be used to determine higher risk groups of surgical patients, but clinicians cannot use the score to discriminate between grades 1 and 2. Overall, the discriminatory power of the model was less than acceptable for widespread use.
the preoperative comorbid state of the patient and not the surgical procedure or any other factors that could inluence the outcome of surgery.
he score was originally described by four categories(2) that ranged from a healthy patient (class 1) to one with an extreme systemic disorder that is an imminent threat to life (class 4). Subsequently, two further classes were added, classes 5 and 6, which were subsequently collapsed so that they could be applied to moribund patients who were not expected to survive 24 hours, with or without surgery. A sixth class has since been described to be used exclusively for declared brain-dead organ donors.
Despite its apparent simplicity, this score is conceptually complex because it combines elements from the patient status before surgery (in classes 1 to 3) together with elements from the subjective opinion of the anesthesiologist (classes 4 and 5). Some authors add a sixth class for patients who are anesthetized just for organ retrieval (Table S1, no electronic supplementary material). he ASA score is not the only score that has followed this approach, but the relative merits of a purely objective score based solely on patient characteristics versus the incorporation of the subjective opinion of physicians remains controversial.(3) For these reasons, we decided to analyze the performance of the ASA score after almost 60 years of use in clinical practice in a large multicenter, multinational database.
METHODS
he European Surgical Outcomes Study (EuSOS) database(4) was used in this study. he primary objective of EuSOS was to describe mortality rates and patterns of critical care resource use for patients undergoing non-cardiac surgery across several European nations. he design of the study and the results of the EuSOS have been described elsewhere.(4) In brief, the European cohort study was performed between 0900 (local time) on April 4, 2011 and 0859 on April 11, 2011. All adult patients (older than 16 years) admitted to participating centers for elective or non-elective inpatient surgery commencing during the 7-day cohort period were eligible for inclusion in the study. Patients undergoing planned day case surgery, cardiac surgery, neurosurgery,
or radiological or obstetric procedures were excluded. Participating hospitals represented a voluntary convenience sample that was identiied based on the membership of the European Society of Intensive Care Medicine (ESICM) and the European Society of Anaesthesiology (ASA) and by the direct approach from national study coordinators. Ethics requirements difered by country. he primary study was approved in the coordinating center (Barts and he London School of Medicine and Dentistry, Queen Mary University of London - London, United Kingdom).
Cohort description
For this sub-study, all of the patients within the EuSOS database were included. Patients lacking a description of their ASA status were excluded from the study (92 patients). Other exclusion criteria derived from the sensitivity analysis of the EuSOS score and deined to exclude the efects of very small centers or extreme deviations regarding the reported mortality were as follows: (1) any site that enrolled less than 10 patients during the study week, (2) any site with a hospital mortality rate either above the 95th centile or below the 5th centile, and (3) any patient with missing data for hospital mortality.
Outcomes
he primary outcome used in this study was survival at the time of hospital discharge. Patients were followed until hospital discharge, death or 60 days after hospital admission.
Statistical analysis
he data were analyzed using SPSS, version 19.0 (SPSS Inc, Chicago, USA). Categorical variables are presented as numbers (%), and continuous variables are presented as means (SD) when normally distributed or medians (IQR) when not normally distributed. the Chi squared and Fisher’s exact tests were to compare
categorical variables, and the t test or ANOVA was
wise. Discrimination of the score was assessed by the area under the receiver operating characteristics curve (aROC) and computed as suggested by Hanley and McNeil.(5) To further characterize the efect of the ASA score on the vital status at the time of hospital discharge, we used regression trees with the CHAID procedure in SPSS v 19 (SPSS Inc, Chicago, USA) and Kaplan-Meier curves with vital status at hospital discharge as the dependent variable and patient censoring at hospital discharge.
A logistic multi-level regression analysis was used to determine whether the efect of the ASA score on hospital mortality was afected by other variables. To minimize the correlation with variables that were already included in the ASA score, comorbid diseases that were present at hospital admission were not used in the model because they are included in the deinitions of the irst 3 classes of the ASA score. he irst step was to identify factors that were independently related to hospital mortality in the multivariate analysis. he following factors were entered into the model based on their relationship to the outcome in the univariate analysis: age, gender, urgency of surgery (reference urgent), laparoscopic surgery, seniority of the surgeon, seniority of the anesthesiologist, grade of surgery and surgical procedure category. Due to the multiplicity of tests performed and to avoid spurious associations and over-itting, only p values less than 0.01 were considered signiicant and included in the model to allow for a more robust and consistent result. All of the entered factors were biologically plausible and had a sound scientiic rationale and a low rate of missing data (see main paper). he results of the univariate analysis model are reported as odds ratios (OR) with 95% conidence intervals (CI).
RESULTS
A total of 45,666 patients from 366 centers in 28 European countries were included in the study. he basic characteristics of the analyzed patients are presented in table 1. Among the patients, 11,431 were classiied as ASA I (25.0%), 21,193 as ASA II (46.4%), 11,411 as ASA III (3.4%), 1,543 as ASA IV and 88 as ASA 5 (0.2%).
As expected, the majority of the physiologic derangements were positively and signiicantly correlated to the ASA score. he ASA score presented a very good relationship with survival at the time of hospital discharge, as presented in igure 1A and 1B (Figure 1A: raw numbers; Figure 1B: percentages). It should be noted, however, that given the very large diferences in the numbers of patients in each class, with most patients concentrated in classes I and II, the clinical utility of this relationship is low.
Complete data for the sensitivity, false positive rate, speciicity (true negative rate), predictive value for dying in the hospital, predictive value for surviving and overall correct classiication are described in detail in table 2. Discrimination for the ASA score was poor, with an aROC of 0.658 ± 0.008 (95% conidence interval of 0.642 to 0.675) (Figure 2).
In the univariate analysis, several variables were signiicantly associated with the ASA score (Table S2 in the electronic supplementary material). In the multivariate analysis, only the ASA score, age, surgical procedure category, grade of surgery, urgency of surgery and country remained signiicant (Table 3). he adjusted odds ratios for the ASA classes were 0.007 [0.005 - 0.011], 0.794 [0.659 - 0.958], 1.416 [1.151 - 1741], 5.267 [4.123 - 6.727], 18.393 [11.056 - 30.600] for classes I to V, respectively.
When the regression trees (CHAID) were applied to this cohort, the results demonstrated that ASA classes I and II should be collapsed together (Figure 3). By merging ASA categories I and II, the percentage of correct classiications increased to 97%, and the score predicted 0.20% of the survivors and 99.8% of the deaths.
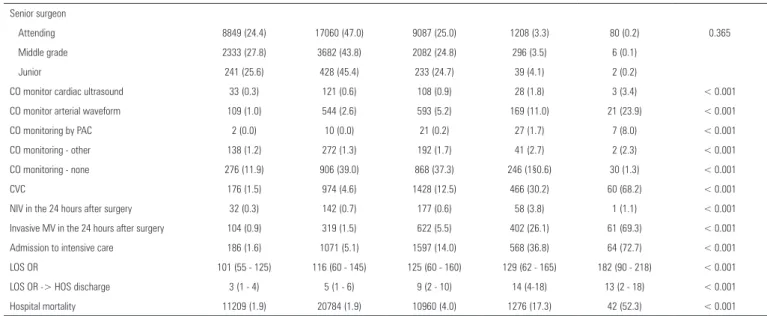
Table 1 - Basic demographic characteristics according by the American Society of Anesthesiologists
ASA
p value
1 2 3 4 5
N 11431 21193 11411 1543 88
Age 40.38 ± 11.53 58.20 ± 15.96 68.49 ± 13.92 70.80 ± 14.62 66.30 ± 32 < 0.001
Sex (male) 5391 9686 6145 888 58 < 0.001
Ethnicity (black) 250 (2.2) 148 (1.3) 122 (1.1) 11 (0.7) 1 (1.2) < 0.001 Urgency of surgery
Elective 8292 (24.1) 17308 (50.4) 8119 (23.6) 619 (1.8) 7 (0.0) < 0.001 Urgent 2446 (27.8) 3059 (34.8) 2644 (30.1) 618 (7.0) 21 (0.2)
Emergency 689 (27.3) 824 (32.7) 644 (25.5) 306 (12.1) 60 (2.4)
General anesthesia 9615 (84.1) 16497 (77.8) 8288 (72.6) 1141 (73.9) 84 (95.5) < 0.001 Spinal anesthesia 1366 (11.9) 3775 (17.8) 2384 (20.9) 256 (16.6) 3 (3.4) < 0.001 Epidural anesthesia 236 (2.1) 989 (4.7) 738 (6.5) 100 (6.5) 1 (0.1) < 0.001 Sedation 455(4.0) 1322 (6.2) 953 (8.4) 132 (8.6) 1 (0.1) < 0.001 Local anesthesia 407 (3.6) 776 (3.7) 504 (4.4) 86 (5.6) 1 (1.1) < 0.001 Regional anesthesia (other) 631 (5.5) 1323 (6.2) 712 (6.2) 86 (5.6) 2 (2.3) < 0.001 Grade of surgery
Minor 3754 (31.7) 5294 (44.8) 2529 (21.4) 245 (2.1) 4 (0.0) 0.032 Intermediate 5919 (27.1) 10324 (47.3) 5002 (22.9) 557 (2.6) 19 (0.1) < 0.001 Major 1729 (14.5) 5532 (46.4) 3861 (32.4) 737 (6.2) 65 (0.5)
LEE cardiovascular score
0 5574 (32.1) 9294 (53.5) 2332 (13.4) 164 (0.9) 5 (0.0 < 0.001 1 2199 (16.6) 6402 (48.3) 4162 (31.4) 456 (3.4) 31 (0.2)
2 38 (0.9) 1255 (29.5) 2508 (59.0) 432 (10.2) 19 (0.4) 3 2 (0.2) 96 (7.9) 861 (71.0) 241 (19.9) 12 (1.0)
4 2 (0.7) 11 (3.6) 186 (61.6) 95 (31.5) 8 (2.6)
5 1 (1.6) 1 (1.6) 29 (47.5) 29 (47.5) 1 (1.6)
6 1 (8.3) 1 (8.3) 2 (58.3) 7 (58.3) 1 (8.3)
WHO surgical checklist used
Yes 7759 (68.2) 14245 (67.5) 7573 (66.6) 998 (64.8) 52 (59.1) 0.008 Urgency of surgery
Elective 8292 (24.1) 17308 (50.4) 8119 (23.6) 619 (1.8) 7 (0.0) < 0.001 Urgent 2446 (27.8) 3059 (34.8) 2644 (30.1) 618 (7.0) 21 (0.2) < 0.001 Emergency 689 (27.3) 824 (32.7) 644 (25.5) 306 (12.1) 60 (2.4) < 0.001 Cirrhosis 7 (0.1) 99 (0.5) 280 (2.5) 94 (6.1) 7 (8.0) < 0.001 Congestive cardiac failure 7 (0.1) 270 (0.3) 1421 (12.5) 403 (26.2) 15 (17.0) < 0.001 COPD 102 (0.9) 2248 (10.6) 2348 (20.6) 368 (23.9) 14 (15.9) < 0.001 Coronary disease 20 (0.2) 1591 (7.5) 3859 (33.9) 638 (41.4) 28 (31.8) < 0.001 Diabetes mellitus insulin dependent 10 (0.1) 532 (2.5) 1229 (10.8) 250 (16.2) 13 (14.8) < 0.001 Diabetes mellitus non-insulin dependent 25 (0.2) 1426 (6.7) 1763 (15.5) 216 (14.0) 6 (6.8) < 0.001 Metastatic cancer 69 (0.6) 801 (3.8) 1048 (9.2) 204 (13.2) 7 (8.0) < 0.001 Stroke 11 (0.1) 449 (2.1) 1258 (11.0) 256 (16.6) 5 (5.7) < 0.001 Laparoscopic-assisted surgery 224 (2.0) 423 (2.0) 196 (1.7) 25 (1.6) 2 (2.3) 0.406 Laparoscopic surgery 1789 (15.7) 2647 (12.5) 910 (8.0) 73 (4.7) 3 (3.4) < 0.001 Senior anesthesiologist
Attending 7883 (25.0) 14686 (46.6) 7807 (24.8) 1076 (3.4) 64 (0.2) Middle grade 2424 (25.2) 4390 (45.7) 2438 (25.4) 337 (3.5) 18 (0.2) Junior 1072 (24.6) 2026 (46.5) 1124 (25.8) 128 (2.9) 5 (0.1)
LEE score - Revised Cardiac Risk Index (RCRI); WHO - World Health Organization; COPD - chronic obstructive pulmonary disease; CO - cardiac output; PAC - pulmonary artery catheter; CVC - central venous pressure; NIV - non-invasive ventilation; MV - mechanical ventilation; LOS - length of stay; OR - operative room: The results are expressed as the mean ± standard deviation, number (%) or median [25% - 75%].
Senior surgeon
Attending 8849 (24.4) 17060 (47.0) 9087 (25.0) 1208 (3.3) 80 (0.2) 0.365 Middle grade 2333 (27.8) 3682 (43.8) 2082 (24.8) 296 (3.5) 6 (0.1)
Junior 241 (25.6) 428 (45.4) 233 (24.7) 39 (4.1) 2 (0.2)
CO monitor cardiac ultrasound 33 (0.3) 121 (0.6) 108 (0.9) 28 (1.8) 3 (3.4) < 0.001 CO monitor arterial waveform 109 (1.0) 544 (2.6) 593 (5.2) 169 (11.0) 21 (23.9) < 0.001 CO monitoring by PAC 2 (0.0) 10 (0.0) 21 (0.2) 27 (1.7) 7 (8.0) < 0.001 CO monitoring - other 138 (1.2) 272 (1.3) 192 (1.7) 41 (2.7) 2 (2.3) < 0.001 CO monitoring - none 276 (11.9) 906 (39.0) 868 (37.3) 246 (1§0.6) 30 (1.3) < 0.001 CVC 176 (1.5) 974 (4.6) 1428 (12.5) 466 (30.2) 60 (68.2) < 0.001 NIV in the 24 hours after surgery 32 (0.3) 142 (0.7) 177 (0.6) 58 (3.8) 1 (1.1) < 0.001 Invasive MV in the 24 hours after surgery 104 (0.9) 319 (1.5) 622 (5.5) 402 (26.1) 61 (69.3) < 0.001 Admission to intensive care 186 (1.6) 1071 (5.1) 1597 (14.0) 568 (36.8) 64 (72.7) < 0.001 LOS OR 101 (55 - 125) 116 (60 - 145) 125 (60 - 160) 129 (62 - 165) 182 (90 - 218) < 0.001 LOS OR -> HOS discharge 3 (1 - 4) 5 (1 - 6) 9 (2 - 10) 14 (4-18) 13 (2 - 18) < 0.001 Hospital mortality 11209 (1.9) 20784 (1.9) 10960 (4.0) 1276 (17.3) 42 (52.3) < 0.001
... continuation
(%) 95%CI
ASA I
Sensitivity (true positive rate) 15.91 13.99 - 17.83
False positive rate 25.32 24.91 - 25.72
Specificity (true negative rate) 74.68 74.28 - 75.09
Predictive value for dying 1.94 1.69 - 2.20
Predictive value for surviving 96.57 96.38 - 96.77
Overall correct classification 72.89 72.48 - 73.29
ASA II
Sensitivity (true positive rate) 45.23 42.62 - 47.84
False positive rate 72.27 71.85 - 72.68
Specificity (true negative rate) 27.73 27.32 - 28.15
Predictive value for dying 1.93 1.78 - 2.08
Predictive value for surviving 94.14 93.74 - 94.55
Overall correct classification 28.27 27.86 - 28.68
ASA III
Sensitivity (true positive rate) 34.98 32.78 - 37.18
False Positive rate 49.18 48.79 - 49.56
Specificity (true negative rate) 50.82 50.44 - 51.21
Predictive value for dying 1.93 1.78 - 2.08
Predictive value for surviving 96.57 96.38 - 96.77
Overall correct classification 50.39 50.02 - 50.77
ASA IV
Sensitivity (true positive rate) 53.49 51.54 - 55.44
False positive rate 57.22 56.88 - 57.57
Specificity (true negative rate) 42.78 42.43 - 43.12
Predictive value for dying 2.96 2.80 - 3.12
Predictive value for surviving 96.48 96.38 - 96.57
Overall correct classification 43.11 42.77 - 43.46
ASA V
Sensitivity (true positive rate) 0.10 0.07 - 0.13
False positive rate 0.09 0.07 - 0.12
Specificity (true negative rate) 99.91 99.88 - 99.93
Predictive value for dying 52.27 41.84 - 62.71
Predictive value for surviving 50.00 49.67 - 50.33
Overall correct classification 50.00 49.67 - 50.33
Table 2 - Sensitivity, false positive rate, specificity (true negative rate), predictive value for dying in the hospital, predictive value for surviving and overall correct classification
CI - confidence interval; ASA - American Society of Anesthesiologists.
Figure 2 - Area under the receiver operating characteristic (ROC) curve for the 5 categories of the American Association of Anaesthesia score. The aROC was 0.656 with a standard error of 0.008 (95% confidence interval of 0.642 - 0.675). The asymptotic significance of the curve was < 0.001.
Table 3 - Multivariable analysis of outcome determinants (American Society of Anesthesiologists and its variables purposefully excluded)
OR 95%CI p value
ASA score
1 Reference -
-2 0.794 0.659 - 0.958 0.016
3 1.416 1.151 - 1.741 0.001
4 5.267 4.123 - 6.727 < 0.0001
5 18.393 11.056 - 30.600 < 0.0001
Age 1.014 1.010 - 1.018 < 0.0001
Surgical procedure
Orthopedics 0.763 0.591 - 0.983 0.037
Breast 1.063 0.694 - 1.627 0.78
Gynecology 1.057 0.769 - 1.451 0.734
Vascular 0.906 0.673 - 1.20 0.515
Upper gastrointestinal 1.701 1.274 - 2.271 < 0.0001
Lower gastrointestinal 1.155 0.888 -1.503 0.283
Hepatobiliary 1.203 0.872 - 1.660 0.26
Plastic/cutaneous 0.916 0.646 - 1.301 0.626
Urology 0.77 0.573 - 1.033 0.081
Kidney 0.374 0.168 - 0.835 0.016
Head and neck 1.077 0.809 - 1.433 0.611
Other Reference
Grade of surgery
Minor Reference
Intermediate 0.796 0.681 - 0.930 0.004
Major 1.261 1.066 - 1.493 0.007
Urgency of surgery
Elective Reference
Urgent 1.891 1.643 - 2.176 < 0.0001
Emergency 3.339 2.757 - 4.046 < 0.0001
ASA - Society of Anesthesiologists.
DISCUSSION
he principal inding of this analysis was that ASA was a poor predictor of survival until hospital discharge in a large population of patients undergoing in-patient non-cardiac surgery. However, by collapsing ASA categories I and II, the performance of the score improved in low risk patients, for whom the performance of the score was less accurate.
Almost 60 years after its original description, and despite the fact that it is one of the most used models to assess risk in patients submitted to surgery,
the overall performance of the ASA score as a tool to predict in-hospital deaths following surgery was found to be poor. his result is in contrast to those obtained for other, more modern, severity scores that are designed to forecast vital status at hospital discharge after admission to the intensive care unit (ICU), such as the APACHE II,(6) the SAPS II,(7) and the SAPS 3 systems.(8) In this case, a direct comparison between the ASA scores and these other scores is not possible because the latter scores have been ascertained only in patients who have been admitted to the ICU (thus, in principle, more severely afected patients) and not in all of the enrolled patients.
A surprising number of deaths were classiied as ASA I. his result has a number of possible explanations, including the following: incorrect scoring of the patients, or a mortality rate that is much greater than that anticipated in this class or classiication rules that are not easy to apply. Table S1 shows that the patients were classiied with signiicant comorbidities, e.g., metastatic cancer was classiied as ASA I. We do not believe that ongoing attempts to subdivide ASA III(9) or to add additional categories(10) will improve the performance of the score, as very clearly demonstrated by the regression trees. At a time when economic constraints and the pursuit of quality of care and maximization of patient safety are a priority, care should be taken when using this instrument to detect such cases.
his study has many strengths but also some limitations. First, a very large population of patients who were submitted to non-cardiac surgery in 28 countries in Europe were studied, using real life data registered by professionals in a heterogeneous sample, and a score with questionable reliability.(11) However, by design, we did not perform a serious intra and inter-observer reliability analysis, thus hampering the signiicance of the results.
Objetivo: O European Surgical Outcomes Study foi um es-tudo que descreveu a mortalidade após a cirurgia de pacientes internados. Em uma análise multivariada, foram identiicados diversos fatores capazes de prever maus resultados, os quais in-cluem idade, urgência do procedimento, gravidade e porte, as-sim como o escore da American Association of Anaesthesia. Este estudo descreveu, com mais detalhes, o relacionamento entre o escore da American Association of Anaesthesia e a mortalidade pós-operatória.
Métodos: Os pacientes neste estudo de coorte com duração de sete dias foram inscritos em abril de 2011. Foram incluídos e seguidos, por no máximo 60 dias, pacientes consecutivos com idade de 16 anos ou mais, internados e submetidos à cirurgia não cardíaca e com registro do escore da American Association of Anaesthesia em 498 hospitais, localizados em 28 países europeus. O parâmetro primário foi mortalidade hospitalar. Foi utiliza-da uma árvore decisória, com base no sistema CHAID (SPSS), para delinear os nós associados à mortalidade.
Resultados: O estudo inscreveu um total de 46.539 pa-cientes. Em função de valores faltantes, foram excluídos 873 pacientes, resultando na análise 45.666. Aumentos no escore da
American Association of Anaesthesia se associaram com o acréscimo das taxas de admissão à terapia intensiva e de mortalidade. Apesar do relacionamento progressivo com mortalidade, a discriminação foi fraca, com uma área sob a curva ROC de 0,658 (IC 95% 0,642 - 0,6775). Com o uso das árvores de regressão (CHAID), foram identiicadas quatro discretas associações dos nós da
American Association of Anaesthesia com mortalidade, estando o escore American Association of Anaesthesia 1 e o escore da American Association of Anaesthesia 2 comprimidos em um mesmo nó.
Conclusões: O escore da American Association of Anaesthesia
pode ser utilizado para determinar grupos de pacientes cirúrgicos de alto risco, porém os médicos não podem utilizá-lo para realizar a discriminação entre os graus 1 e 2. Em geral, o poder discrimina-tório do modelo foi menos do que aceitável para uso disseminado.
RESUMO
Descritores: Anestesiologia; Reprodutibilidade de resulta-dos; Mortalidade; Período pós-operatório
REFERENCES
1. Saklad M. Grading of patients for surgical procedures. Anesthesiology. 1941;2(3):281-4.
2. Little JP. Consistency of ASA grading. Anaesthesia. 1995;50(7):658-9. 3. Kruse JA, Thill-Baharozian MC, Carlson RW. Comparison of clinical
assessment with APACHE II for predicting mortality risk in patients admitted to a medical intensive care unit. JAMA. 1988;260(12):1739-42. 4. Pearse RM, Moreno RP, Bauer P, Pelosi P, Metnitz P, Spies C, Vallet B, Vincent JL, Hoeft A, Rhodes A; European Surgical Outcomes Study (EuSOS) group for the Trials groups of the European Society of Intensive Care Medicine and the European Society of Anaesthesiology. Mortality after surgery in Europe: a 7 day cohort study. Lancet. 2012;380(9847):1059-65. 5. Hanley JA, McNeil BJ. The meaning and use of the area under a receiver
operating characteristic (ROC) curve. Radiology. 1982;143(1):29-36. 6. Knaus WA, Draper EA, Wagner DP, Zimmerman JE. APACHE II: a severity
of disease classification system. Crit Care Med. 1985;13(10):818-29.
7. Le Gall JR, Lemeshow S, Saulnier F. A new Simplified Acute Physiology Score (SAPS II) based on a European/North American multicenter study. JAMA. 1993;270(24):2957-63. Erratum in: JAMA 1994;271(17):1321. 8. Moreno RP, Metnitz PG, Almeida E, Jordan B, Bauer P, Campos RA,
Iapichino G, Edbrooke D, Capuzzo M, Le Gall JR, SAPS 3 Investigators. SAPS 3-From evaluation of the patient to evaluation of the intensive care unit. Part 2: Development of a prognostic model for hospital mortality at ICU admission. Intensive Care Med. 2005;31(10):1345-55. Erratum in: Intensive Care Med. 2006;32(5):796.
9. Schwam SJ, Gold MI, Craythorne UW. The ASA Physical Status Classification: a revision. Anesthesiology. 1982;57(3):A439.
10. Higashizawa T, Koga Y. Modified ASA physical status (7 grades) may be more practical in recent use for preoperative risk assessment. J Anesthesiol [Internet]. 2007;15(1). [cited 2015 Apr 22]. Available from: https://ispub.com/IJA/15/1/7401
11. Aronson WL, McAuliffe MS, Miller K. Variability in the American Society of Anesthesiologists Physical Status Classification Scale. AANA J. 2003;71(4):265-74.
12. Gaba DM. Anaesthesiology as a model for patient safety in health care. BMJ. 2000;320(7237):785-8.
it impossible to assess its calibration) during an important historical period, had a crucial impact on the development of modern methods.
In a specialty like anesthesia, in which the mortality rates have been reduced by a log factor from 1 anesthesia-related death in 5000 procedures in the 1980s to less that 1 in 250.000 in 1998,(12) it is time to move forward.
CONCLUSION