aDepartment of Radiology, Neuroradiology Division, São Paulo University
Medical School – São Paulo/SP, Brazil.
bDepartment of Otorhinolaryngology, Pulmonary Division, São Paulo
University Medical School – São Paulo/SP, Brazil.
cDepartment of Cardio-Pneumology, Pulmonary Division, São Paulo
University Medical School – São Paulo/SP, Brazil. Email: [email protected]
Received for publication on April 06, 2006. Accepted for publication on October 16, 2006.
CLINICAL SCIENCES
PHARYNGEAL DIMENSIONS IN HEALTHY MEN AND
WOMEN
Mauro Miguel Daniela, Maria Cecília Lorenzib, Claudia da Costa Leitea, Geraldo
Lorenzi-Filhoc
Daniel MM, Lorenzi MC, Leite C da C, Lorenzi-Filho G. Pharyngeal dimensions in healthy men and women. Clinics. 2007; 62(1):5-10.
INTRODUCTION: Epidemiological studies reveal a high male prevalence of obstructive sleep apnea syndrome. A possible explanation for this male predominance is the existence of anatomical differences in the upper airway between men and women.
METHODS: The upper airways of 10 male and 10 female healthy volunteers were prospectively evaluated by magnetic resonance imaging. Anatomical pharyngeal and column cross-sectional linear measurements were made in sagittal T1 and axial T1 and T2 weighted fast spin-echo images.
RESULTS: Men had significantly greater mean sagittal pharyngeal structural dimensions compared to women for all structures with the exception of the craniocaudal length of the soft palate and the thickness of the submentonian fat. In contrast, cross-sectional linear dimensions were similar in men and women with the exception of the laterolateral tongue length, which was greater in men. All mean linear measurements of the pharyngeal air column were similar in men and women at all studied levels.
CONCLUSIONS: Men and women present pharyngeal air columns with similar dimensions, but in women this column is surrounded by smaller structures, which might imply a smaller effort to keep its patency. Our data suggest the existence of an anatomical protective factor in women against the upper airway collapse.
KEYWORDS: Obstructive sleep apnea syndrome. Sleep apnea. MRI. Pharynx.
INTRODUCTION
Obstructive sleep apnea syndrome is characterized by repetitive episodes of obstruction of the upper airway dur-ing sleep and is found more frequently in obese individu-als, possibly due to fat deposition in some neck structures. Epidemiological studies reveal a high prevalence of the syn-drome in men and obese people.
Besides the existence of functional gender-related dif-ferences regarding the pharyngeal dilator muscle activity
and, therefore, the collapsibility of the pharynx,1,2 another possible explanation for the predominance of male obstruc-tive sleep apnea syndrome patients is the existence of ana-tomical differences in the upper airway . Previous studies using the acoustic reflection technique to assess the pha-ryngeal cross-sectional area showed that this area is sig-nificantly larger in healthy men than in healthy women in the sitting position, whereas no difference was found in re-cumbent positions. Pharyngeal compliance was also found to be greater in men than in women.3 However, the mecha-nisms responsible for the increased susceptibility of men to obstructive sleep apnea syndrome are not yet completely understood.
larger overall soft tissue volume was found in men.7 In the present study, we sought to investigate upper air-way anatomy of awake healthy men and women. We hy-pothesized that significant gender-related differences may at least in part explain the greater susceptibility of men to obstructive sleep apnea syndrome.
MATERIALS AND METHODS
Ten healthy men and 10 healthy women were prospec-tively evaluated by MRI after they signed informed con-sent forms. The protocol was reviewed and approved by the Institutional Ethics Committee.
All subjects underwent a clinical evaluation and verbally confirmed the absence of acute or chronic diseases, as well as the use of any medications. The absence of obstructive sleep apnea syndrome was assumed after observing the fol-lowing criteria: a) absence of snoring; b) absence of day-time sleepiness (Epworth sleepiness scale < 10); c) absence of obstructive sleep apnea syndrome -associated conditions (hypertension, diabetes, or other cardiac diseases); and d) absence of obesity (body mass index - BMI < 30 kg/m2). Polysomnographic studies were not performed.
Men and women enrolled in the study were similar re-garding their mean age (32.9 ± 7.8 years and 36.2 ± 10.5 years, respectively; P = 0.430) and BMI (24.7 ± 1.3 kg/m² and 23.7 ± 3.5 kg/m², respectively; P = 0.350).
The MRI studies were performed using the same equip-ment (General Electric Medical - Milwaukee, WI—1.5 Tesla). All patients were positioned in supine decubitus, with no head support, and were instructed to remain still and not to swallow, as well as to keep their mouths closed and to use soft nose breathing during the acquisition of the images. All study subjects remained awake during the exam.
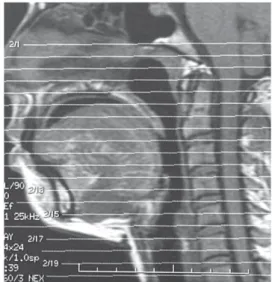
Twelve to 15 sagittal images (T1 weighted; 3.0 mm thickness; 1.0 mm gap) and 20 axial images (T1 and T2 weighted; 4.0 mm thickness; 2.5 mm gap) were obtained with a fast spin-echo (FSE) pulse sequence. The most cra-nial axial image was programmed cracra-nial to the hard pal-ate; the most caudal axial image was programmed at the glottic level (Figure 1).
Repetition time (TR) and echo time (TE) for T1 weighted images were 600 msec and 20 msec respectively. The TR and TE for T2 weighted images were 3,000 msec and 90 msec respectively (number of excitations = 2; field of view = 24 cm). A cervical neurovascular coil was used. The total examination time did not exceed 10 minutes in each case.
For measuring purposes, the pharynx was schematically divided into 4 different regions: rhinopharynx, retropalatal oropharynx, retrolingual oropharynx, and hypopharynx.8–10
The inferior limit of the rhinopharynx consisted of an im-aginary horizontal line crossing the hard palate. The oropharynx was defined as the air space between the infe-rior limit of the rhinopharynx and an imaginary horizontal line tangential to the epiglottic tip. The hypopharynx ex-tended from the inferior limit of the oropharynx to the esophageal transition.
A median sagittal image in which the lingual septum and the odontoid process of the second cervical vertebra were distinguished was employed for sagittal measure-ments.
The following sagittal measurements were obtained: 1. The anteroposterior length of the tongue (APtongue):
defined as the distance between the tip of the tongue and its posterior border (Figure 2).
Figure 1 - Axial images programming. The most superior image was programmed cranial to the hard palate, and the most inferior axial image was programmed at the glottic level
(A) 1. Aptongue: cranicaudal diameter of the tongue; 2. CC-Softpal: craniocaudal length of the soft palate and 3. Submentfat: thickness of submentonian fat. (B) 4. AP- Softpal: anteroposterior measurement of the soft palate; 5. H-PNS: distance between the superior border of the hyoid bone body and the posterior nasal spine and 6. H-Col: distance hyoid bone and posterior pharyngeal wall.
2. The craniocaudal length of the soft palate (CCsoftpal): defined as the distance between the posterior nasal spine and the tip of the uvula (Figure 2).
3. The anteroposterior dimension of the soft palate (APsoftpal): defined as the anteroposterior measurement of the soft palate in its thicker region (Figure 2). 4. Thickness of the submentonian fat tissue (SubmentFat):
defined as the craniocaudal measurement of the submentonian fat tissue in its thicker region (Figure 2). 5. Hyoid bone-posterior nasal spine distance (H-PNS): de-fined as the distance between the superior border of the hyoid bone body and the posterior nasal spine (Figure 2).
6. Distance between the hyoid bone and the posterior wall of the pharynx (H-Col): the smallest distance between the posterior border of the hyoid bone body and the pos-terior wall of the pharynx, near the vertebral column (Figure 2).
The following measurements were obtained from the axial images:
1. Laterolateral length of the tongue (LLtongue): defined as the distance between the lateral borders of the tongue in its thicker region, having as an anatomical landmark the hyoglossal muscles (Figure 3).
2. Mandibular angle (MandAng): defined as the angle measured between 2 lines whose vertex lies in the in-ternal border of the chin, following each mandibular branch in posterior and lateral directions to its most pos-terior internal border, near the third molar teeth (Figure 3).
3. The space between the pharyngeal air column and the mandibular branch (LatWall): defined as the distance between the pharyngeal air column and the mandibu-lar branch at the level of the retropalatal oropharynx, comprising the so-called lateral wall of the pharynx, the parapharyngeal space, and the pterygoid muscle (Figure 3).
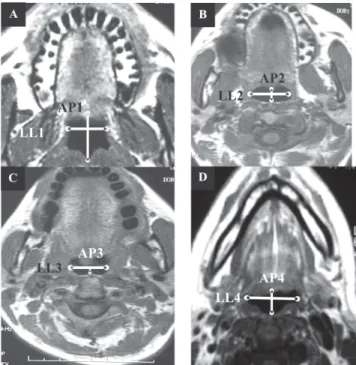
The morphology of the pharyngeal air column was also observed. Linear laterolateral (LL) and anteroposterior (AP) axial measurements were obtained at the following levels (Figure 4):
1. Rhinopharynx (Level 1): axial pharyngeal image at the hard palate level (Figure 5a).
(A) 1. Lltongue: laterolateral diameter of the tongue and 2. MandAng: mandibular angle. (B) 3. LatWall: soft tissue space between air column and mandible
Figure 3 - (A and B) – Axial measurements
1. Rhinopharynx;
2. High retropalatal oropharynx; 3. Low retropalatal oropharynx; 4. Retrolingual oropharynx.
Figure 4 - Planning of axial images for measurements of air column
(A) Laterolateral (LL1) and anteroposterior (AP1) air column dimensions at the rhinopharynx. (B) Laterolateral (LL2) and anteroposterior (AP2) air column dimensions at the high retropalatal oropharynx. (C) Laterolateral (LL3) and anteroposterior (AP3) air column dimensions at the low retropalatal oropharynx. (D) Laterolateral (LL4) and anteroposterior (AP4) air column dimensions at the retrolingual oropharynx.
2. High retropalatal oropharynx (Level 2): pharyngeal measurements in a plane lying 1.0 cm below the infe-rior limit of the rhinopharynx (hard palate) (Figure 5b). 3. Low retropalatal oropharynx (Level 3): pharyngeal measurements at the uvula level or at the narrowest air column point of the low retropalatal region (Figure 5c). 4. Retrolingual oropharynx (Level 4): measurements ob-tained in an intermediate image between the uvula and the tip of the epiglottis (Figure 5d).
Statistical analysis included descriptive statistics and the Student t test, after checking the assumptions for the use of parametric tests, using STATA® (Statistical Data
Analy-sis) software, version 7.0. A P < 0.05 in 2-tailed tests was considered significant.
RESULTS
Sagittal pharyngeal measurements
The mean anteroposterior length of the tongue was sig-nificantly greater in men (7.50 ± 0.48 cm) than in women (7.00 ± 0.39 cm) (P = 0.020). The anteroposterior soft pal-ate dimension was also grepal-ater in men (0.99 ± 0.07 cm) compared to women (0.88 ± 0.09 cm) (P = 0.009). Men also showed significantly larger distances between the hy-oid bone and the posterior nasal spine (6.50 ± 0.76 cm) and between the hyoid bone and the posterior pharyngeal wall (2.89 ± 0.34 cm) compared to women (5.67 ± 0.48 cm, P = 0.009, and 2.23 ± 0.31 cm, P = 0.0003, respec-tively).
In summary, MR images of normal men showed a sig-nificantly greater mean sagittal pharyngeal structural di-mensions compared to those obtained from MR images of normal women, with the exception of the craniocaudal length of the soft palate and the thickness of the submentonian fat (Table 1).
Axial pharyngeal measurements
Regarding the cross-sectional linear dimensions, men and women had similar mean measurements, with the ex-ception of the laterolateral tongue length, which was greater in men (4.55 ± 0.40 cm) than in women (4.21 ± 0.30 cm) (P = 0.05) (Table 2).
Pharyngeal column cross-sectional linear measurements
All mean linear measurements of the pharyngeal air column were similar in men and women at the 4 levels con-sidered (Table 3).
DISCUSSION
Since obstructive sleep apnea syndrome is more pre-dominant in men overall, analyzing data from both men and women without obstructive apnea is an important start-ing point for better understandstart-ing of the mechanisms of the disease. It is also an stablished fact that obstructive sleep apnea syndrome is more predominant in obese subjects. Moreover, we emphasise that our study population com-prised nonobese men and women. Regarding the use of lin-ear cross-sectional pharyngeal measurements instead of area determinations, obtaining linear measurements of the
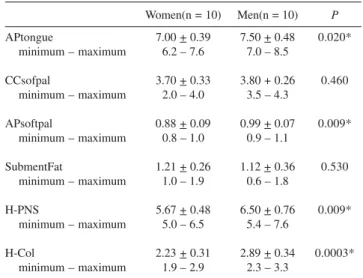
Table 1 - Sagittal pharyngeal measurements in healthy men and women (cm)
Women(n = 10) Men(n = 10) P
APtongue 7.00 + 0.39 7.50 + 0.48 0.020*
minimum – maximum 6.2 – 7.6 7.0 – 8.5
CCsofpal 3.70 + 0.33 3.80 + 0.26 0.460
minimum – maximum 2.0 – 4.0 3.5 – 4.3
APsoftpal 0.88 + 0.09 0.99 + 0.07 0.009*
minimum – maximum 0.8 – 1.0 0.9 – 1.1
SubmentFat 1.21 + 0.26 1.12 + 0.36 0.530
minimum – maximum 1.0 – 1.9 0.6 – 1.8
H-PNS 5.67 + 0.48 6.50 + 0.76 0.009*
minimum – maximum 5.0 – 6.5 5.4 – 7.6
H-Col 2.23 + 0.31 2.89 + 0.34 0.0003*
minimum – maximum 1.9 – 2.9 2.3 – 3.3
APtongue: Anteroposterior length of the tongue; CCsofpal: Craniocaudal soft palate length; APsoftpal: Anteroposterior soft palate dimension; SubmentFat: Submentonian fat tissue thickness; H-PNS: Distance between the hyoid bone and the posterior nasal spine; H-Col: Distance between the hyoid bone and the posterior pharyngeal wall; n: number of subjects; P: 2-tailed value of the Student t test; *statistically significant.
Table 2 - Axial pharyngeal measurements in healthy men and women (cm)
Women(n = 10) Men(n = 10) P
LLtongue (cm) 4.21 + 0.30 4.55 + 0.40 0.050* minimum – maximum 3.9 – 4.8 4.0 – 5.1
LatWall (cm) 3.25 + 0.28 3.47 + 0.31 0.110
minimum – maximum 3.0 – 3.8 3.1 – 4.0
MandAng (grades) 69.3 + 3.1 71.0 + 6.3 0.470
minimum – maximum 60 – 81 66 – 76
pharynx has the advantage of being totally reproducible on the MRI console, on a PC, or even using conventional film. After deciding to prioritize the development of standard evaluation procedures that could be easily performed, we chose these simpler linear measurements. The disadvan-tages of area and volume measurements have been men-tioned previously,11 including the following: the need for time-consuming 3-dimensional reconstructions, high cost, and the necessity of specialized personnel for interpreta-tion and manipulainterpreta-tion of the data at workstainterpreta-tions.
Most of the pharyngeal measurements were found to be significantly greater in men compared to women. These anatomical differences can, at least in part, be explained by the more massive physical structures observed in the necks of men.
The evaluation of the position of the hyoid bone is tra-ditionally obtained via the cephalometric measurement of the distance between the most anterior and superior bor-ders of this structure and an imaginary line that horizon-tally crosses the inferior border of the mandible. The
so-Table 3 - Pharyngeal column cross-sectional linear
measurements in healthy men and women (cm)
Women(n = 10) Men(n = 10) P
Laterolateral pharyngeal air column measurements (cm)
LL1 2.21 + 0.38 2.29 + 0.25 0.580
minimum – maximum 1.5 – 3.0 2.0 – 2.7
LL2 2.14 + 0.41 1.97 + 0.27 0.290
minimum – maximum 1.4 – 2.8 1.4 – 2.4
LL3 1.80 + 0.51 1.79 + 0.54 0.970
minimum – maximum 1.3 – 2.9 0.8 – 2.8
LL4 2.21 + 0.54 2.21 + 0.75 1.000
minimum – maximum 1.5 – 3.3 1.2 – 4.0 Anteroposterior pharyngeal air column measurements (cm)
AP1 2.02 + 0.51 1.99 + 0.59 0.900
minimum – maximum 1.2 – 3.0 1.2 – 3.2
AP2 0.88 + 0.19 0.86 + 0.20 0.820
minimum – maximum 0.5 – 1.1 0.5 – 1.2
AP3 0.58 + 0.22 0.56 + 0.15 0.810
minimum – maximum 0.4 – 1.0 0.4 – 0.9
AP4 1.19 + 0.74 1.20 + 0.25 0.960
minimum – maximum 0.4 – 2.8 0.9 – 1.5
LL1: Rhinopharynx; LL2: High retropalatal oropharynx; LL3: Low retropalatal oropharynx; LL4: Retrolingual oropharynx; AP1: Rhinopharynx; AP2: High retropalatal oropharynx; AP3: Low retropalatal oropharynx; AP4: Retrolingual oropharynx; n: number of subjects; P: 2-tailed value of the Studentt test.
called MP-H measurement is obtained routinely in the ce-phalometric evaluation of patients with obstructive sleep apnea syndrome . Neither CT scan nor MRI studies allow a direct determination of this distance. The visualization of the necessary anatomical repairs is not possible with these imaging techniques unless 3-dimensional reconstruc-tion or a CT survey is employed. As we aimed to bring to MRI the possibility of determining the hyoid positioning in a simple and readily available manner, we have described a variation on this classical cephalometric measurement: the distance between the hyoid bone and the posterior na-sal spine (H-PNS). This measurement can be easily ob-tained by direct sagittal MRI images and, like the MP-H value, is proportional to the size of the tongue. The greater mean distance between the hyoid bone and the posterior nasal spine observed in men possibly represents a compen-satory hyoid positioning (lower and more anterior) to ac-commodate a larger tongue.
Despite the fact that most anatomical structures were systematically larger in awake men, pharyngeal linear air column dimensions were similar in both awake genders. No difference was found in linear cross-sectional air col-umn measurements at any level. These data may suggest the existence in women of an anatomical protective factor against possible upper airway collapse. Therefore, although awake men and women present pharyngeal air columns with similar dimensions, in women this column is subject to compression by smaller surrounding structures, which might require less effort to keep its patency.
A previous MRI study found a greater mean cross-sec-tional area of the soft palate in healthy men compared to women.7 In our study, which is part of a general research project on obstructive apnea in out Institution12, we meas-ured not the palatal area, but its craniocaudal length and anteroposterior dimension. The former was similar in both sexes; however, the anteroposterior dimension of the soft palate (the palatal “thickness”) was found to be greater in men. Moreover, we found no gender-related differences re-garding pharyngeal air column measurements, whereas in the aforementioned study, the mean infrapalatal cross-sec-tional area was found to be greater in men.
RESUMO
Daniel MM, Lorenzi MC, Leite C da C, Lorenzi-Filho G. Dimensões da faringe em homens e mulheres saudáveis. Clinics. 2007; 62(1):5-10.
INTRODUÇÃO: Estudos epidemiológicos demonstram
alta prevalência da síndrome da apnéia obstrutiva do sono no sexo masculino. Uma explicação plausível para esta predominância masculina é a existência de diferenças anatômicas nas vias aéreas superiores entre homens e mulheres.
MÉTODOS: As vias aéreas superiores de 10 homens e 10
mulheres, voluntários saudáveis, foram avaliados prospec-tivamente através do exame de ressonância magnética. Foram realizadas medidas lineares das vias aéreas superiores e das estruturas da faringe através de imagens sagitais pesadas em T1 e imagens axiais pesadas em T1 e T2 com a técnica de fast spin-echo.
RESULTADOS: Os homens mostraram dimensões
significativamente maiores das estruturas da faringe em
relação às mulheres em todas as medidas realizadas nas imagens sagitais, com exceção do diâmetro crânio-caudal do palato mole e da espessura da gordura submentoniana. Em contraste, as imagens axiais mostraram medidas similares entre os sexos, exceto o diâmetro látero-lateral da língua que foi maior nos homens. Todas as medidas da coluna aérea das vias aéreas superiores foram semelhantes nos dois sexos.
CONCLUSÕES: Embora homens e mulheres apresentem
vias aéreas superiores com dimensões similares, nas mulheres as estruturas anatômicas ao seu redor são menores, sugerindo um menor esforço para manter as vias aéreas superiores patentes no sexo feminino. Nossos resultados sugerem a existência de um fator de proteção anatômico contra o colapso das vias aéreas superiores nas mulheres.
UNITERMOS: Síndrome da apnéia obstrutiva do sono.
Apnéia do sono. Ressonância magnética. Faringe.
REFERENCES
1. Popovic RM, White DP. Upper airway muscle activity in normal women: influence of hormonal status. J Appl Physiol. 1998;84:1055-62. 2. Schwab RJ. Sex differences and sleep apnoea. Thorax. 1999;54:284-5. 3. Huang J, Shen H. Pharyngeal cross-sectional area and pharyngeal compliance in normal males and females. Respiration (Basel). 1998;65:458-68.
4. Fleetham JA. Upper airway imaging in relation to obstructive sleep apnea. Clin Chest Med. 1992;13:399-416.
5. Schwab RJ, Goldberg AN. Upper airway assessment: radiographic and other imaging techniques. Otolaryngol Clin North Am. 1998;31:931-68.
6. Stark P, Norbash A. Imaging of the trachea and upper airways in patients with chronic obstructive airway disease. Radiol Clin North Am. 1998;36:91-105.
7. Whittle AT, Marshall I. Neck soft tissue and fat distribution: comparison between normal men and women by magnetic resonance imaging. Thorax. 1999;54:323-8.
8. Lowe AA, Gionhaku N. Three-dimensional ct reconstructions of tongue and airway in adult subjects with obstructive sleep apnea. Am J Orthod Dentofacial Orthop. 1986;90:364-74.
9. Horner RL, Mohiaddin RH. Sites and sizes of fat deposits around the pharynx in obese patients with obstructive sleep apnoea and weight matched controls. Eur Respir J. 1989;2:613-22.
10. Williams PL. Gray anatomia, 37th ed. Guanabara Koogan: Rio de Janeiro; 1995. p. 1248.
11. Bhattacharyya N, Blake SP. Assessment of the airway in obstructive sleep apnea syndrome with 3-dimensional airway computed tomography. Otolaryngol Head Neck Surg. 2000;123:444-9. 12. Lorenzi-Filho G, Genta PR, Figueiredo AC, Inoue D. Cheyne-Stokes