Diego Augusto Santos SilvaI Edio Luiz PetroskiI
Marco Aurélio PeresII
I Departamento de Educação Física. Universidade Federal de Santa Catarina. Florianópolis, SC, Brasil
II Departamento de Saúde Pública. Universidade Federal de Santa Catarina. Florianópolis, SC, Brasil
Correspondence:
Diego Augusto Santos Silva
Universidade Federal de Santa Catarina. Centro de Desportos. Departamento de Educação Física. Campus Universitário Trindade.
88010-970 Florianópolis, SC, Brasil E-mail: [email protected] Received: 7/20/2011
Approved: 7/23/2012
Article available from: www.scielo.br/rsp
Prehypertension and
hypertension among adults in a
metropolitan area in Southern
Brazil: population-based study
ABSTRACT
OBJECTIVE: To assess the prevalence and factors associated with prehypertension and hypertension among adults.
METHODS: Population-based cross-sectional study carried out with a sample of 1,720 adults in the city of Florianópolis, Southern Brazil, from September 2009 to January 2012. Information on demographic and socioeconomic factors, health-related behaviors, anthropometric measures, morbidities, and self-rated health was collected through household interviews. Systolic and diastolic blood pressure levels were also assessed as well as use of antihypertensive medications and medical diagnosis of hypertension. The dependent variable was categorized as normal blood pressure, prehypertension and hypertension. Polytomous multiple logistic regression analysis was performed with use of a multinomial logit model.
RESULTS: The overall prevalence of prehypertension and hypertension was 36.1% (95%CI 33.3;38.8) and 40.1% (95%CI 36.6, 43.5), respectively. The polytomous regression analysis showed that prehypertension was signifi cantly associated with males, black skin, 50-59 years of age, leisure-time physical inactivity, and pre-obesity. Hypertension was associated with males, 40 years of age or more, intermediary tertile of per capita family income, less than 12 years of schooling, leisure-time physical inactivity, pre-obesity, obesity, abdominal obesity, and negative self-rated health.
CONCLUSIONS: It is pressing to introduce effective public health policies to control hypertension among adult population in Florianópolis, Southern Brazil.
Hypertension (HT) is one of the most important risk factors in cardiovascular disease which causes early death in adults.15 The prevalence of HT in the adult
population varies from 5.2% to 70.7% throughout the world.12,23 Immutable characteristics such as sex and
skin colour/race, macro-structural determinants such as socio-economic status and degree of urbanisation and lifestyle factors capable of modifi cation such as nutrition, physical activity and alcohol and tobacco consumption all affect blood pressure levels.15,23
A recent report from the Joint National Committee on Prevention, Detection, Evaluation and Treatment of High BP(JNC-7) provided new guidelines for the prevention and detection of HT.5 The detection of prehypertension
(PreHT) is as important as the diagnosing of H, according to the JNC-7. PreHT is not an illness; however, those with prehypertension are at greater risk of developing HT and increase their risk of cardiovascular disease compared with normotensive individuals.5
Studies of the prevalence of HT in adults have reported values of 22% and 44% in Brazil. HT was more preva-lent in older people, those with black skin, those with low socioeconomic status, those with a diet high in salt and those who were overweight.23 Although it is
relevant to public health to investigate the prevalence of HT and the associated factors, it is also necessary to analyse preHT. Diagnosing preHT is important so that campaigns to diminish the damage caused by HT and the cost of hospital admissions due to cardiovascular disease can begin earlier.5 In 2005, in Brazil, these costs
had an estimated value of US$ 2,250, 417, 514.00.23
The majority of studies of HT in Brazil have been carried out away from the state capitals, in cities and towns which have a more tranquil pace of life. Only one study on preHT was carried out with adults, and that was in a small town.22 The prevalence and the
consequences of high blood pressure are more evident in the big cities than in small towns, as a result of greater consumption of processed food, stress and physical inactivity.23
This study aims at estimating the prevalence and factors associated with preHT and HT in adults.
METHODS
This study is a health survey which took place between September 2009 and January 2010, part of the popula-tion based project “EpiFloripa Adultos 2009”,a of adults
in Florianópolis, SC. INTRODUCTION
a EpiFloripa: Health Conditions in Adult and the Elderly in Florianópolis. Florianópolis; 2009 [cited 2012 Nov11]. Available from: http://www. epifl oripa.ufsc.br/
b Brazilian Institute of Geography and Statistics. Brazilian population. [cited 2009 Feb 10]. Available from: http://www.ibge.gov.br
Florianópolis, with a population of 421,203 inhabitants, had the best social and health indicators of all the state capitals in 2010, according to IBGE (Brazilian Institute of Geography and Statistics).b
The size of the sample was calculated in order to estimate the prevalence of each health outcome inves-tigated, the reference population being 249,530 adults between the ages of 20 and 50, the confi dence interval being 95%, sampling error 3.5 percentage points, design effect (deff) estimated at 2 due to cluster sampling and percentage losses estimated to be 10%. We interviewed 32 adults in each of the 63 census districts, increasing the sample size to 2016 individuals.
By considering the parameters of study power to be 80%, confidence intervals of 95% and number of subjects in each category of the independent variables, this study found, in unadjusted analysis, odds ratio of 1.3 and 0.7 as risk and protection factors respectively.
Selection of the sample went through two stages. In the fi rst stage, 420 census districts were stratifi ed according to income of the head of the household (R$ 192.80 to R$ 13,209.50, equivalent to US$ 327.76 to US$ 22,456.15) and systematically randomly selected 60 sectors (sample fraction = 7), making six sectors in each decile. In the second stage, the sampling units were households. The number of houses in each randomly selected sector was updated by the supervisors of the study, who counted the number of dwellings in each of the selected sectors (the number of dwellings ranged from 61 to 810). The result of this process was sixty three census districts, totalling 16,755 eligible families, of which 1,134 were systematically selected. On average, 32 adults were selected from each census district.
Adults aged 20 to 59, who resided in the dwellings selected, were eligible for the study. Exclusion criteria were: being bedridden, amputees or those with limbs in plaster, neurological disorders which interfered with understanding of the interview questions. Pregnant women and those who had had a child in the six months previous to the study did not have their blood pressure or anthropometric measurements taken, as this would affect the values obtained.23 If the selected individual
was not encountered after at least four visits, including one during the weekend and one in the evening, this was considered a loss.
period of the survey in order to carry out this fi eld work. They used a Personal Digital Assistant (PDA) to record and store the data obtained, eliminating the need for inputting data later.
Quality control of the responses was conducted weekly by verifying 15% of the interviews carried out (n = 248), selected randomly for each sector. Key information was verifi ed through telephone contact by the fi eld supervisor. The value of Kappa varied from 0.6 to 1.0 in the concordance analysis.
Comprehension of the questions was tested beforehand by giving the questionnaire to 30 adults resident in an area covered by one of the municipality’s health units. A pilot study, with around 100 people from two census districts randomly selected for the purpose, was carried out after the interviewers had received training. The results were not incorporated into the study.
Systolic and diastolic blood pressure (SBP and DBP) were measured twice and the average of the two values recorded. Resting time before and between the two measurements was approximately 15 minutes. Measurements were taken using the right arm, resting on a table at heart height, palm upwards. The indi-viduals were seated, with both feet on the fl oor.23 All of
the interviewees were recommended not to smoke or drink coffee, mate (tea) or black tea and to empty the bladder before blood pressure was taken.23 Electronic
Sphygmomanometers with a digital display (Techline®), previously and adequately calibrated by Inmetro (National Institute of Metrology, Standardization and Industrial Quality) were used to measure blood pres-sure. Normal blood pressure was defi ned as when the individual reported that they were not taking any medi-cation for high blood pressure, had not been diagnosed with high blood pressure and had SBP lower than 120 mmHg and DBP lower than 80 mmHg.5 PreHT was
defi ned when the individual reported that they were not taking any medication for high blood pressure, had not been diagnosed with high blood pressure and had SBP of 120-139 mmHg or DBP of 80-89 mmHg.5 HT was
defi ned as when the subjected reported being on medica-tion for high blood pressure and/or had been diagnosed as having hypertension, and/or SBP of 140 mmHg or higher and/or DBP of 90 mmHg or higher.5
The independent variables were sex (masculine: feminine); age group (in full years: 20 to 29, 30 to 39, 40 to 49 and 50 to 59); self-reported skin colour (white, light- or dark-skinned black – those subjects who referred to their skin colour as yellow = 1.0% and indigenous = 1.2% were excluded from the tables due to being low frequency, although they were used in the association analysis); level of education (in years of study with passing successfully in the education system: 0 to 4 years, 5 to 8 years, 9 to 11 years and ≥ 12 years); household income per capita (in R$: (1º tercile = up
to R$ 566.90; 2º tercile = R$ 567.00 to 1,300.00; and 3º tercile = R$ 1,300.10 to 33,333.00); private health plan (yes; no) and occupation. At time of collection the Brazilian classifi cation of occupations was adopted, which was later adapted to the British classifi cation according to Boing et al.2 Occupations were classifi ed as manual
(III – specialised, IV – semi-specialised, V – unskilled) or non-manual (I – university graduates. II – administrative and technical, III – specialist professionals).
Smoking was evaluated using the following categories: non-smoker, ex-smoker, light smoker (< 10 cigarettes/ day, moderate smoker (10 to 20 cigarettes/day) and heavy smoker (> 20 cigarettes/day). The last two categories were grouped together. The Alcohol Use Disorders Identifi cation Test (AUDIT) was used to identify those who had problems with alcohol, using a cut-off point to classify individuals into either no (0-7) or yes (≥ 8).16 Physical activity and nutrition were
evalu-ated with a questionnaire used in the Vigitel system.9,11
Those who did no physical activity in their free time, or had done so less than once a week in the three months previous to the interview were deemed inactive; those who had done some kind of physical activity in their free time at least once a week over the same period were deemed active.9 nutrition was evaluated according to
regular consumption of fruit and vegetables.11
The anthropometric measurements; body mass, height and waist circumference were evaluated according to standardised procedures.17 Body mass Index (BMI) and
waist circumference were categorised according to the literature.26 BMI was categorised as obese (BMI ≥ 30
kg/m²), pre-obese/overweight (BMI of 25.0 to 29.9 kg/ m²) and normal weight (IMC < 25 kg/m²). Underweight individuals were excluded from the tables due to low frequency (2.0%), although they were included in the association analysis. Waist circumference (WC) was analysed using cut off points according to the risk of developing metabolic complications, the categories were: very high risk (men ≥ 102 cm, women ≥ 88 cm), increased risk (men ≥ 94 cm, women ≥ 80 cm) and no risk men < 94 cm, women < 80 cm).Technical error of measurement (TEM) inter and intra evaluator was calculated according to the recommendations of Gore et al.10 The maximum TEM value of inter (1.86%)
and intra evaluators (1.18%) was for mea suring waist circumference, which indicated an adequate level for the interviewers taking anthropometric measurements.
The subjects responded to the question of whether they had been diagnosed with diabetes (yes; no). Self-evaluation of health was measured in fi ve categories and dichotomised into positive (very good and good) and negative (regular, bad and very bad) self-evaluations of health.3
regression with the multinomial Logit model was carried out to determine factors associated with preHT and HT.
The variables were grouped into a hierarchical model from distal to proximal determinants.24 The
demographic variables (sex, age and skin colour) were in the distal block (level 1), followed by the socio-economic variables (level 2) (per capita income, level of education, private health plan and occupation), then health related behaviour (level 3) (tobacco and alcohol consumption, physical activity and nutrition), morbidities (level 4) (obesity, abdominal obesity and diabetes) with self-perception of health in the proximal level (level 5). The variables were included in the adjusted model, irrespective of the raw analysis p. The forward and backward methods showed similar results, and we opted for the backward method. We adjusted those variables at the same level and of higher levels which had results of more than p ≤ 0.20 in the Wald test.
The analyses were stratifi ed according to sex due to the nature of the outcome and the different prevalence of HT in men and women. However, on verifying factors which were associated with preHT and HT in both sexes, we observed that the same factors were repeated irrespec-tive of sex, modifying the magnitude of the correlation, without changing its direction. We opted not to carry out analyses stratifi ed by sex in order to increase the power of the statistical analyses. The analyses were carried out using Stata 11.0 software taking into consideration design effect and sample weight.
This study was approved by the Committee for Ethical Research on Humans of the Universidade Federal de Santa Catarina (nº 351/08). The subjects were informed of the aims of the study and signed consent forms.
RESULTS
The study counted on the participation of 1,720 adults (response rate 85.3%), with an average age of 38.1 (standard deviation = 11.6). Design effects were, respectively, 1.4 and 2.1 for exposure to preHT and HT.
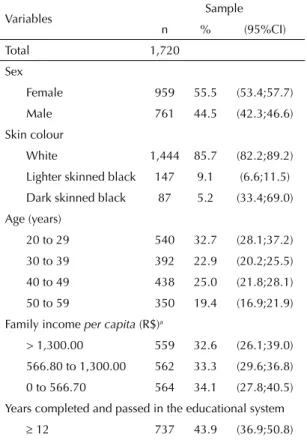
The majority of the sample were female, with white skin, aged 20 to 29 with more than 12 years in the educational system, with private health plans and non-manual occu-pation. Approximately a fi fth of the sample reported problems with alcohol and were smokers. More than half did no physical activity in their free time and did not regularly eat fruit and vegetables. The prevalence of obesity, abdominal obesity and diabetes was 16.1%, 16.2% and 6.7% respectively. Almost a fi fth of the indi-viduals evaluated their own health negatively (Table 1).
The average SBP and DBP was 133.0 mmHg (95%CI 132.0;133.9) and 85.0 mmHg (95%CI 84.3;85.6), respectively. The prevalence of preHT and HT
Table 1. Characteristics of adults participating in the study. Florianópolis, Southern Brazil, 2009-1010.
Variables Sample n % (95%CI)
Total 1,720
Sex
Female 959 55.5 (53.4;57.7)
Male 761 44.5 (42.3;46.6)
Skin colour
White 1,444 85.7 (82.2;89.2)
Lighter skinned black 147 9.1 (6.6;11.5)
Dark skinned black 87 5.2 (33.4;69.0)
Age (years)
20 to 29 540 32.7 (28.1;37.2)
30 to 39 392 22.9 (20.2;25.5)
40 to 49 438 25.0 (21.8;28.1)
50 to 59 350 19.4 (16.9;21.9)
Family income per capita (R$)a
> 1,300.00 559 32.6 (26.1;39.0)
566.80 to 1,300.00 562 33.3 (29.6;36.8)
0 to 566.70 564 34.1 (27.8;40.5)
Years completed and passed in the educational system
12 737 43.9 (36.9;50.8) 9 to 11 568 33.4 (28.8;37.9)
5 to 8 253 14.0 (11.2;16.7)
0 to 4 158 8.7 (6.4;11.1)
Private health plan
Yes 984 57.9 (52.9;63.1)
No 732 42.1 (36.9;47.0)
Occupation
Non manual 1,111 70.3 (65.0;75.5)
Manual 490 29.7 (24.5;34.9)
Alcohol abuse
No 1,403 81.5 (78.5;84.4)
Yes 317 18.5 (15.6;21.4)
Smoker
Never smoked 926 54.7 (50.8;58.5)
Ex-smoker 449 26.1 (22.3;29.7)
Light smoker 158 9.0 (7.5;10.4)
Moderate/heavy
smoker 178 10.2 (8.7;11.7)
Physical activity in leisure time
Yes 806 46.9 (42.5;51.1)
No 912 53.1 (48.8;57.4)
Regular consumption of fruit and vegetables
Yes 323 18.8 (15.9;21.6)
No 1,396 81.2 (78.3;84.0)
was 36.1% (95%CI 33.3;38.8) and 40.1% (95%CI 36.6;43.5), respectively (Table 2).
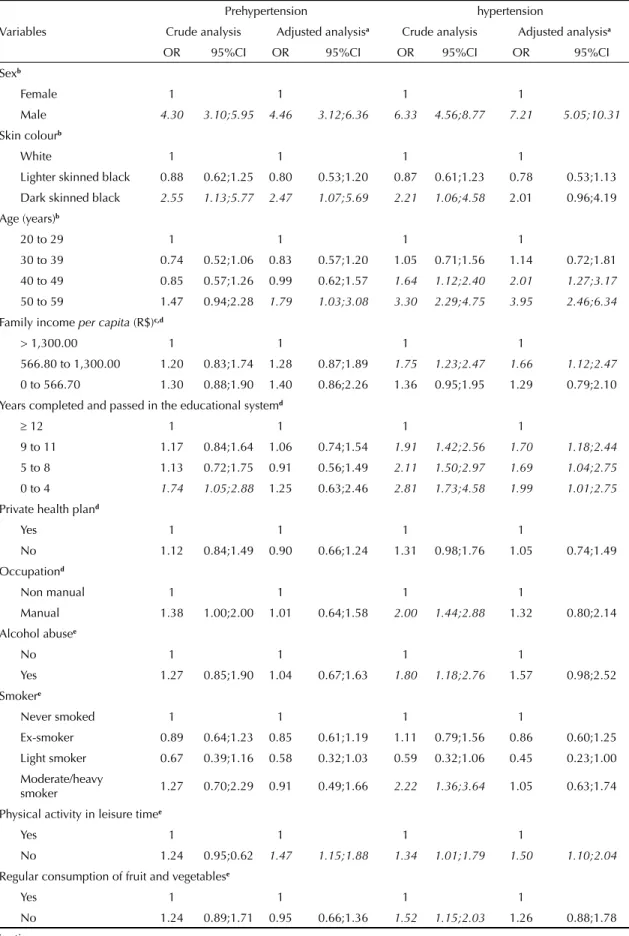
Polytomous logistic regression in the raw analysis showed that the chances of the subjects having preHT and HT, when compared with normotensive individuals, were greater in individuals who were male, who had black skin, with a low level of education, with BMI > 25 kg/m² and with waist circumference values in the risk category. The chances of having HT were greater for people over 40, those in the intermediate tercile for income, those who had a manual occupation, those with alcohol abuse issues, those who smoked 10 or more cigarettes a day, those who were physically inactive in their free time, those with unsuitable nutrition, diabetics and those with a negative perception of their own health in the raw analysis (Table 3).
The chances of the subjects having preHT, when compared with normotensive individuals, were greater, in the adjusted analysis, in the following groups: male, black skin, over 50s, physically inactive and overweight. The chances of having HT, when compared with normotensive individuals, were greater for men, those with black skin, those over 40, those in the intermediate tercile for income, those who had spent < 12 years in the education system, those who were physically inactive, those who were overweight and obese, those with high values for waist circumference and those with a negative perception of their own health (Table 3).
DISCUSSION
The combined prevalence of preHT and HT (76.2%) was greater than that found in other studies6,8 and lower
than that found in a survey in China.27 The analysis
of the prevalence of HT alone in Florianópolis (41%) was higher than that of Italy,25 Switzerland,25 USA,25
Canada,25 Mexico,20 Venezuela,20 Chile,20 Ecuador20 and
South Korea,6 but was lower than that of Germany,25
Finland,25 Turkey,8 Spain25 and Cuba20 and similar to
that of England.25
PreHT and HT were strongly associated with being male, confi rming previous studies.22 However, other
researchers have found that women had a greater prevalence to preHT and HT than men.8 Gender in
itself hardly seems to determine blood pressure levels. Habits affecting health may determine the magnitude with which HT is associated with sex.7 The greater
prevalence of preHT and HT in men may be related to risk factors present in men when compared to women.
PreHT is strongly correlated with having black skin. Kurian & Cardarelli14 demonstrated that HT and
cardio-vascular disease is more prevalent in those with black skin than those with white skin. The authors explain their fi ndings based on social inequalities between the two segments of the population, which hinders access to diagnosis and treatment of HT. Those with black skin make up the segment of the Brazilian population which most feels the impact of social inequalities, a fact which can be explained historically, mainly due to slavery in Brazil in the nineteenth century.
Correlation was found between HT and age group, from the age of 40 onwards, and with preHT from the age of 50 onwards. On average, SBP is relatively stable in both men and women until the age of 45; afterwards, there is an increase of 5-8 mmHg/decade. DBP increases one mmHg/decade in men, whereas in women it starts to increase on reaching middle age and tends to decrease again after the age of 70.21 Kotchen et al13 report that
increases in blood pressure is not an integral part of the ageing process. Primitive societies which have been analysed showed no increase in blood pressure with age and HT was practically unknown. Individuals in these societies consume little salt, there is the possibility that salt intake over the years is behind the apparent effect of ageing on blood pressure in industrialised societies.
Low levels of education and income per capita were associated with HT, as in other studies.6,8 The high
prevalence of HT in subjects of lower socio-economic status and education may be the result of other factors which affect blood pressure levels, such as stress, working conditions and unsuitable eating habits, being sedentary and the diffi culty of accessing health services so as to HT being diagnosed and treated.8
PreHT and HT were directly correlated with physical inactivity in leisure time, even after adjusting for demo-graphic and socio-economic variables and other habits which impact on health. Similar results have been found by other authors4 Doing moderately intense physical
Table 1. Continuation Body Mass Index (kg/m²)
< 25.0 839 51.9 (48.3;55.4)
25.0 to 29.9 531 32.0 (29.6;34.4)
> 30.0 270 16.1 (13.5;18.6) Waist circumference
Normal 1,077 65.2 (61.5;68.7)
Increased risk 307 18.6 (16.3;20.8) High risk 287 16.2 (13.8;18.6) Diabetes
No 1,655 96.3 (95.3;97.2) Yes 63 6.7 (2.7;4.6)
Perception of own health
Positive 1,373 81.2 (78.3;84.0) Negative 347 18.8 (15.9;21.6)
a R$: Brazilian currency. 1R$ = 1.7US$ during data
Table 2. Average values for systolic and diastolic blood pressure, prevalence of prehypertension and hypertension among adults, Florianópolis, Southern Brazil, 2009-2010.
Variables
SBP (mmHg) DBP (mmHg) Pre-hypertension Hypertension
n (95%CI) n (95%CI) n % (95%CI) n % (95%CI)
Total 1,679 133.0 (132.0;133.9) 1,682 85.0 (84.3;85.6) 606 36.1
(33.3;38.8) 680
40.1 (36.6;43.5)
Sex
Female 927 127.5 (126.3;128.7) 928 81.9 (81.0;82.8) 317 33.8
(30.6;37.0) 286
30.5 (26.4;34.6)
Male 752 139.8 (138.4;141.1) 754 88.6 (87.6;89.7) 289 38.8
(34.9;42.6) 394
51.6 (47.5;55.7) Skin colour
White 1,406 132.4 (131.4;133.4) 1,409 84.9 (84.1;85.6) 504 35.5
(32.6;38.3) 569
40.1 (36.4;43.8)
Lighter
skinned black 98 137.6 (133.7;141.5) 146 84.2 (81.6;86.8) 49
34.6
(28.5;40.7) 58
38.5 (31.9;45.1)
Dark skinned
black 77 138.8 (134.1;143.5) 85 87.9 (84.9;90.8) 37
44.5
(28.7;60.2) 37
43.5 (29.1;57.8)
Age (years)
20 to 29 521 129.8 (128.4;131.2) 522 81.5 (80.4;82.6) 221 42.3
(37.5;47.2) 166
31.0 (26.1;35.8)
30 to 39 381 130.1 (128.1;132.0) 381 83.6 (82.2;85.0) 130 34.8
(30.1;39.5) 138
36.0 (30.5;41.4)
40 to 49 433 133.8 (131.9;135.7) 435 86.7 (85.3;88.1) 139 31.8
(26.0;37.6) 195
44.8 (38.8;50.8)
50 to 59 344 139.8 (137.6;142.2) 344 89.3 (87.8;90.9) 116 32.5
(27.0;38.1) 181
53.5 (47.1;59.9)
Family income per capita (R$)a
> 1,300.00 548 130.6 (129.0;132.2) 550 83.8 (82.7;84.9) 207 36.8
(31.8;41.7) 194
35.1 (30.6;39.4)
566.80 to
1,300.00 551 135.1 (133.5;136.8) 551 86.1 (84.9;87.3) 180
33.2
(28.2;38.2) 255
45.8 (39.2;52.4)
0 to 566.70 552 133.0 (131.4;134.6) 552 85.0 (83.7;86.2) 210 38.6
(33.9;43.4) 217
38.6 (34.0;43.2)
Years completed and passed in the educational system
12 720 129.5 (128.2;130.9) 721 82.8 (81.9;83.8) 282 39.1
(34.7;43.4) 232
32.1 (28.1;36.0)
9 to 11 553 134.7 (133.1;136.4) 555 86.1 (84.9;87.3) 186 33.7
(30.0;37.6) 255
45.1 (40.3;49.7)
5 to 8 246 135.2 (132.6;137.7) 246 86.6 (84.9;88.4) 79 31.3
(25.7;36.9) 117
48.1 (43.1;53.1)
0 to 4 157 139.1 (135.7;142.5) 157 87.7 (85.2;90.1) 57 36.3
(27.5;45.2) 75
48.2 (39.0;57.4) Private health plan
Yes 962 131.7 (130.4;132.8) 963 83.9 (83.1;84.8) 351 36.6
(33.1;40.8) 367
37.9 (33.4;42.4)
No 715 134.7 (133.2;136.2) 717 86.2 (85.2;87.3) 254 35.3
(31.0;39.5) 312
42.8 (38.6;47.1) Occupation
Non manual 1,083 131.1 (130.0;132.3) 1,085 84.1 (83.2;84.9) 403 37.1
(33.4;40.6) 401
36.8 (33.2;40.3)
Manual 481 137.3 (135.4;139.1) 481 87.6 (86.2;88.9) 163 33.8
(29.1;38.6) 237
49.0 (43.7;54.2)
Continua
Table 2. Continuation
Alcohol abuse
No 1,365 132.1 (131.1;133.1) 1,367 84.5 (83.7;85.2) 503 36.7
(33.8;39.6) 523
38.0 (34.3;41.7)
Yes 314 136.6 (134.3;138.9) 315 87.1 (85.3;88.8) 103 33.3
(27.4;39.2) 157
48.8 (41.5;55.9)
Smoker
Never
smoked 901 131.9 (130.7;133.1) 903 84.0 (83.2;84.9) 343
38.0
(34.2;41.9) 344
37.9 (33.5;42.3)
Ex-smoker 441 133.5 (131.6;135.4) 442 85.2 (83.8;86.5) 154 33.9
(29.5;38.4) 185
42.1 (36.2;47.9)
Light smoker 156 130.3 (127.2;133.4) 156 83.7 (81.2;86.2) 53 35.6
(25.4;45.7) 55
31.1 (20.7;41.5)
Moderate/ heavy smoker
174 139.5 (136.1;142.8) 174 89.9 (87.5;92.4) 53 30.9
(23.5;38.2) 93
53.8 (47.1;60.5)
Physical activity in leisure time
Yes 787 131.7 (130.4;133.1) 790 83.6 (82.6;84.6) 280 35.6
(32.0;39.2) 304
37.9 (33.6;42.2)
No 890 134.1 (132.7;135.4) 890 86.1 (85.2;87.0) 326 36.4
(33.0;39.9) 375
41.8 (37.7;45.9)
Regular consumption of fruit and vegetables
Yes 313 130.6 (128.4;132.7) 314 84.3 (82.6;85.9) 118 36.8
(31.5;42.1) 109
34.2 (29.3;39.1)
No 1,365 133.4 (132.4;134.5) 1,367 85.1 (84.3;85.8) 488 35.9
(32.9;38.9) 570
41.3 (37.7; 44.8)
Body Mass Index (kg/m²)
< 25.0 831 126.5 (125.3;127.6) 832 80.4 (79.6;81.3) 337 40.1
(36.0;44.1) 215
25.6 (21.8;29.4)
25.0 to 29.9 527 137.6 (135.9;139.2) 529 87.7 (86.6;88.9) 194 37.4
(32.7;42.1) 264
50.2 (45.3;55.0)
> 30.0 266 146.4 (144.0;148.9) 266 94.6 (92.8;96.5) 59 21.9
(16.5;27.4) 189
70.4 (64.6;76.3)
Waist circumference
Normal 1,069 129.3 (128.3;130.4) 1,070 82.2 (81.4;83.0) 417 38.9
(35.4;42.4) 343
31.3 (27.9;34.8)
Increased
risk 304 135.1 (133.0;137.2) 305 87.0 (85.5;88.6) 110
35.4
(29.7;41.2) 140
47.2 (41.1;53.4)
High risk 282 144.6 (142.2;147.2) 283 93.2 (91.4;94.9) 69 24.7
(19.4;29.9) 189
67.2 (60.6;73.7)
Diabetes
No 1,617 132.6 (131.6;133.6) 1,620 84.8 (84.0;85.4) 592 36.6
(33.8;39.4) 639
39.0 (35.5;42.5)
Yes 61 140.8 (135.6;145.9) 61 90.0 (86.5;93.4) 14 21.6
(10.9;32.2) 40
66.0 (51.6;80.5)
Perception of own health
Positive 1,341 131.5 (130.5;132.5) 1,344 84.1 (83.4;84.9) 496 36.8
(33.6;40.0) 511
37.9 (34.2;41.6)
Negative 338 138.6 (136.2;141.0) 338 88.1 (86.4;90.0) 110 32.6
(27.3;38.0) 169
49.3 (44.0;54.7)
aR$: Brazilian currency. 1R$ = 1.7US$ during data collection
SBP: systolic arterial pressure; DBP: diastolic arterial pressure
Table 3. Odds ratio and 95% confi dence intervals for prehypertension and hypertension, compared with o grupo normotensive individuals, using polytomous logistic regression with the Multinomial Logit model among adults. Florianópolis, Southern Brazil, 2009-2010.
Variables
Prehypertension hypertension
Crude analysis Adjusted analysisa Crude analysis Adjusted analysisa
OR 95%CI OR 95%CI OR 95%CI OR 95%CI
Sexb
Female 1 1 1 1
Male 4.30 3.10;5.95 4.46 3.12;6.36 6.33 4.56;8.77 7.21 5.05;10.31 Skin colourb
White 1 1 1 1
Lighter skinned black 0.88 0.62;1.25 0.80 0.53;1.20 0.87 0.61;1.23 0.78 0.53;1.13
Dark skinned black 2.55 1.13;5.77 2.47 1.07;5.69 2.21 1.06;4.58 2.01 0.96;4.19 Age (years)b
20 to 29 1 1 1 1
30 to 39 0.74 0.52;1.06 0.83 0.57;1.20 1.05 0.71;1.56 1.14 0.72;1.81
40 to 49 0.85 0.57;1.26 0.99 0.62;1.57 1.64 1.12;2.40 2.01 1.27;3.17 50 to 59 1.47 0.94;2.28 1.79 1.03;3.08 3.30 2.29;4.75 3.95 2.46;6.34
Family income per capita (R$)c,d
> 1,300.00 1 1 1 1
566.80 to 1,300.00 1.20 0.83;1.74 1.28 0.87;1.89 1.75 1.23;2.47 1.66 1.12;2.47 0 to 566.70 1.30 0.88;1.90 1.40 0.86;2.26 1.36 0.95;1.95 1.29 0.79;2.10
Years completed and passed in the educational systemd
12 1 1 1 1
9 to 11 1.17 0.84;1.64 1.06 0.74;1.54 1.91 1.42;2.56 1.70 1.18;2.44 5 to 8 1.13 0.72;1.75 0.91 0.56;1.49 2.11 1.50;2.97 1.69 1.04;2.75
0 to 4 1.74 1.05;2.88 1.25 0.63;2.46 2.81 1.73;4.58 1.99 1.01;2.75
Private health pland
Yes 1 1 1 1
No 1.12 0.84;1.49 0.90 0.66;1.24 1.31 0.98;1.76 1.05 0.74;1.49
Occupationd
Non manual 1 1 1 1
Manual 1.38 1.00;2.00 1.01 0.64;1.58 2.00 1.44;2.88 1.32 0.80;2.14 Alcohol abusee
No 1 1 1 1
Yes 1.27 0.85;1.90 1.04 0.67;1.63 1.80 1.18;2.76 1.57 0.98;2.52
Smokere
Never smoked 1 1 1 1
Ex-smoker 0.89 0.64;1.23 0.85 0.61;1.19 1.11 0.79;1.56 0.86 0.60;1.25
Light smoker 0.67 0.39;1.16 0.58 0.32;1.03 0.59 0.32;1.06 0.45 0.23;1.00
Moderate/heavy
smoker 1.27 0.70;2.29 0.91 0.49;1.66 2.22 1.36;3.64 1.05 0.63;1.74
Physical activity in leisure timee
Yes 1 1 1 1
No 1.24 0.95;0.62 1.47 1.15;1.88 1.34 1.01;1.79 1.50 1.10;2.04
Regular consumption of fruit and vegetablese
Yes 1 1 1 1
activity regularly results in hemodynamic changes that promote lowering blood pressure, such as a reduction in cardiac output and decreased systemic vascular resistance.19 Physical activity could be an important
tool in preventing and treating HT.
Levels of abdominal fat and body fat are strongly associated with HT. Obesity is considered the main risk factor in developing HT.23 In this study, 25.6%
and 31.3% of hypertensive individuals had normal values for BMI and WC, respectively. This shows that obesity is a serious public health issue in Florianópolis. It is necessary to encourage active life styles to reduce weight and promote suitable blood pressure levels.
N egative self-evaluations of health are associated with poor quality of life and the presence of morbidities such as HT.1 In this study, HT was associated with negative
self-evaluations of health even after adjusting for other variables. HT has an important impact on perceptions of health, above all because it results in consequences for the organism. If not controlled, it may lead to problems such as arteriosclerosis, heart failure and loss of vision.5,12,15
This study is the fi rst to be population based an inves-tigate prevalence of preHT and HT in a Brazilian state capital. Previous studies in Brazilian state capital have investigated only the prevalence of HT. Analysing
preHT may be useful in the implementation of public health policies aimed at preventing HT and the health problems associated with this illness.
One of the limitations of this study was the transversal design, which did not allow us to state whether or not the associated factors determine, or are determined by, blood pressure. However, the possibility of reverse causality cannot be ruled out. Another limitation is that the study did not include genetic or hereditary variables. In spite of these limitations, the results have external validity for the adult population resi-dent in the urban area of Florianópolis. The uniform distribution of the losses in family income deciles and the distribution by sex and age group similar to that found in the estimates of the IBGE for the adult population of the municipality in 2009 contribute to this framework of inferences.
Th e prevalence of preHT and HT in Florianópolis was high. Demographic and socio-economic factors, morbi-dities and perceptions of own health were associated with preHT and HT. Knowledge about the distribution of HT in the population contributes to the planning of more effi cient measures for reducing this public health problem. However, in order to propose effective actions it is necessary to understand that, although factors associated with preHT and HT such as level of physical
Table 3. Continuation
Body Mass Index (kg/m²)f
< 25.0 1 1 1 1
25.0 to 29.9 2.58 1.78;3.72 1.87 1.18;2.98 5.41 3.85;7.60 3.42 2.25;5.20
> 30.0 2.50 1.41;4.44 1.37 0.4;3.80 12.5 7.77;20.23 5.25 2.19;12.59
Waist circumferencef
Normal 1 1 1 1
Increased risk 1.57 1.07;2.29 1.30 0.75;2.25 2.60 1.73;3.89 1.35 0.77;2.36
High risk 2.34 1.46;3.75 2.17 0.89;5.27 7.89 4.87;12.77 3.23 1.28;8.17
Diabetesf
No 1 1 1 1
Yes 1.16 0.44;3.09 1.26 0.42;3.73 3.35 1.24;9.04 2.08 0.61;7.08
Perception of own healthg
Positive 1 1 1 1
Negative 1.24 0.89;1.74 1.26 0.83;1.90 1.83 1.39;2.40 1.57 1.05;2.34
a Adjusted analysis: All the variables were introduced into the adjusted model irrespective of the p values in the crude
analysis. Variables with p 0.20 remained in the adjusted model
b Variables included in the fi rst level
c R$: Brazilian currency, 1R$ = 1.7 US$ during the data collection d Variables included in the second level
e Variables included in the third level f Variables included in the fourth level g Variables included in the fi fth level
1. Barros MBA, Zanchetta LM, Moura EC, Malta DC. Self-rated health and associated factors, Brazil, 2006. Rev Saude Publica. 2009;43(Suppl 2):S27-S37. DOI:10.1590/S0034-89102009000900005
2. Boing AF, Antunes JLF, Carvalho MB, Góis Filho JF, Kowalski LP, Michaluart Jr P, et al. How much do smoking and alcohol consumption explain socioeconomic inequalities in head and neck cancer risk? J Epidemiol Community Health. 2011;65(8):709-14. DOI:10.1136/jech.2009.097691
3. Bruin A, Picavet HSJ, Nossikov A, editors. Health interview surveys: towards international harmonization of methods and instruments. Copenhagen: WHO Regional Offi ce for Europe; 1996. (WHO Regional Publications. European Series, 58).
4. Bryan SN, Katzmarzyk PT. The association between meeting physical activity guidelines and chronic diseases among Canadian adults. J Phys Act Health. 2011;8(1):10-7.
5. Chobanian AV, Bakris GL, Black HR, Cushman WC, Green LA, Izzo Jr JL, et al. The Seventh Report of the Joint National Committee on Prevention, Detection, Evaluation, and Treatment of High Blood Pressure: the JNC 7 report. JAMA. 2003;289(19):2560-72. DOI:10.1001/jama.289.19.2560
6. Choi KM, Park HS, Han JH, Lee JS, Lee J, Ryu OH, et al. Prevalence of prehypertension and hypertension in a Korean population: Korean National Health and Nutrition Survey 2001. J Hypertens. 2006;24(8):1515-21. DOI:10.1097/01.hjh.0000239286.02389.0f
7. Dallongevillle J, De Bacquer D, Heidrich J, De Backer G, Prugger C, Kotseva K, et al. Gender differences in the implementation of cardiovascular prevention measures after an acute coronary event. Heart. 2010;96(21):1744-9. DOI:10.1136/hrt.2010.196170
8. Erem C, Hacihasanoglu A, Kocak M, Deger O, Topbas M. Prevalence of prehypertension and hypertension and associated risk factors among Turkish adults: Trabzon Hypertension Study. J Public Health (Oxf). 2009;31(1):47-58. DOI:10.1093/pubmed/fdn078
9. FlorindoAA, Hallal PC, Moura EC, Malta DC. Practice of physical activities and associated factors in adults, Brazil, 2006. Rev Saude Publica. 2009;43(Suppl 2):S65-S73. DOI:10.1590/S0034-89102009000900009
10. Gore C, Norton K, Olds T, Whittingham N, Birchall K, Clough M, et al. Accreditation in anthropometry: an Australian model. In: Norton K, Olds T, editors.
Anthropometrica. Sydney: University of South Wales Press; 1996. p.395-411.
11. Jaime PC, Figueiredo ICR, Moura EC, Malta DC. Factors associated with fruit and vegetable consumption in Brazil, 2006. Rev Saude Publica. 2009;43(Suppl 2):S57-S64. DOI:10.1590/S0034-89102009000900008
12. Kearney PM, Whelton M, Reynolds K, Whelton PK, He J. Worldwide prevalence of hypertension: a systematic review. J Hypertens. 2004;22(1):11-9.
13. Kotchen JM, McKean HE, Kotchen TA. Blood pressure trends with aging. Hypertension. 1982;4(5 Pt 2):III128-34.
14. Kurian AK, Cardarelli KM. Racial and ethnic differences in cardiovascular disease risk factors: a systematic review. Ethn Dis. 2007;17(1):143-52.
15. Lee DE, Cooper RS. Recommendations for global hypertension monitoring and prevention. Curr Hypertens Rep. 2009;11(6):444-9.
16. Lima CT, Freire AC, Silva AP, Teixeira RM, Farrell M, Prince M. Concurrent and construct validity of the audit in an urban Brazilian sample. Alcohol Alcohol. 2005;40(6):584-9. DOI:10.1093/alcalc/agh202
17. Lohman TG, Roche AF, Martorell R. Anthropometric standardization reference manual. Champaign: Human Kinetics Books; 1988.
18. Maldonado G, Greenland S. Simulation study of confounder-selection strategies. Am J Epidemiol. 1993;138(11):923-36.
19. Negrão CE, Rondon MUPB. Exercício físico,
hipertensão e controle barorrefl exo da pressão arterial. Rev Bras Hipertens. 2001;8(1):89-95.
20. Ordúñez P, Silva LC, Rodríguez MP, Robles S. Prevalence estimates for hypertension in Latin America and the Caribbean: are they useful for surveillance? Rev Panam Salud Publica. 2001;10(4):226-31. DOI:10.1590/S1020-49892001001000002
21. Pearson JD, Morrell CH, Brant LJ, Landis PK, Fleg JL. Age-associated changes in blood pressure in a longitudinal study of healthy men and women. J Gerontol A Biol Sci Med Sci. 1997;52(3):M177-83.
22. Pereira MR, Coutinho MSSA, Freitas PF, D’Orsi E, Bernardi A, Hass R. Prevalência, conhecimento, tratamento e controle de hipertensão arterial sistêmica na população adulta urbana de Tubarão, Santa Catarina, Brasil, em 2003. Cad Saude Publica. 2007;23(10):2363-74. DOI:10.1590/S0102-311X2007001000011 REFERENCES
activity, being overweight and obesity are considered as modifi able, different levels of action are used to reverse this situation. This study identifi ed factors which neces-sitate the diffusion of knowledge and specifi c actions in the population and, at the same time, distal factors in the chain of determination such as socio-economic status, level of education and skin colour which require restructuring the country’s social policies.
ACKNOWLEDGEMENTS
The authors declare that there were no confl icts of interest. 23. Sociedade Brasileira de Cardiologia; Sociedade
Brasileira de Hipertensão; Sociedade Brasileira de Nefrologia. V Diretrizes Brasileiras de Hipertensão Arterial. Arq Bras Cardiol. 2007;89(3):e24-e79. DOI:10.1590/S0066-782X2007001500012
24. Victora CG, Huttly SR, Fuchs SC, Olinto MT. The role of conceptual frameworks in epidemiological analysis: a hierarchical approach. Int J Epidemiol. 1997;26(1):224-7. DOI:10.1093/ije/26.1.224
25. Wolf-Maier K, Cooper RS, Banegas JR, Giampaoli S, Hense HW, Joffres M, et al. Hypertension prevalence
and blood pressure levels in 6 European countries, Canada, and United States. JAMA. 2003;289(18):2363-9. DOI:10.1001/jama.282003;289(18):2363-9.18.2363
26. World Health Organization. Obesity: Preventing and Managing the Global Epidemic. Geneva; 1998. (WHO Technical Report Series 894.)