AR
TICLE
1 Faculdade de Ciências da Saúde, Universidade de Brasília. Cidade Universitária, Asa Norte. 70910-900 Brasília DF Brasil. [email protected] 2 Faculdade de Ciências Médicas, Universidade Estadual de Campinas. Campinas SP Brasil.
Investment of financial resources for the procurement of
medicines for primary care in Brazilian municipalities
Abstract This study shows a descriptive data analysis related to the procurement of medicines for primary care in Brazilian municipalities, as recorded in the National database of Pharmaceu-tical Service Actions and Services for the period July 2013 – June 2014, by geographic region and population size. Nine hundred and sixty mu-nicipalities were analyzed, of which 27% invest-ed monetary value equal to or greater than the minimum statutory recommendations and 43% of these are located in the Southeast. The North region has the highest number of municipalities with less investment. Municipalities with a popu-lation over 500,000 inhabitants used, on average, lower resources to provide more items to users. The average number of items purchased was 86 and represents 25% of the National List of Essential Medicines (Rename); 64% had a decentralized resource management and the most common-ly used procurement method was “tender”. The most purchased drugs are in line with the most prevalent primary care diseases. Findings showed that most municipalities invests below statutory recommendations and are located mainly in the North, Northeast and Midwest. It was not possi-ble to establish a trend between population and amount invested per capita/year.
Key words Pharmaceutical Service, Health ex-penditure, Primary care, Healthcare financing
Marcela Amaral Pontes 1
Noemia Uruth Leão Tavares 1
Priscila Maria Stolses Bergamo Francisco 2
Po
nt
Introduction
After more than two decades of pharmaceutical services actions centralized in the Ministry of Health (MS), the first Brazilian drug policy ap-proved in 1998 brought in its guidelines the re-orientation of pharmaceutical services based on decentralization and practices that proposed the
promotion of access to and rational use of drugs1.
The National Drug Policy paved the way to the financing decentralization process and pharma-ceutical services actions in the Unified Health System (SUS).
In 1999, the MS created the Incentive to Basic Pharmaceutical services (IAFB) and established criteria to enable states and municipalities to re-ceive financial resources from the three spheres of government for the procurement of medicines
for primary care2.
Subsequently, the financing block for phar-maceutical services was organized into three
components: basic, strategic and specialized3.
The basic component provides resources for the costing of drugs for prevalent and priority health problems; the strategic component fi-nances products for the treatment and control of endemic diseases and ailments; and the spe-cialized component supplies drugs for some dis-eases whose diagnostic criteria are defined in the Clinical Protocols and Therapeutic Guidelines
(PCDT)4.
Since then, funding for the Pharmaceutical services Basic Component (CBAF) has been con-solidated through Ordinances aimed at reducing
inequities and increasing funds5,6.
With the Health Pact, it was agreed that all SUS management spheres are responsible for promoting the structuring of pharmaceutical services and ensuring the population’s access to medicines, promoting their rational use and
ob-serving established norms and agreements7.
More recently, universal and equal access to pharmaceutical services was reaffirmed through Decree Nº 7.508, of June 28, 2011, which regu-lates Law No. 8.080/1990, to provide for the orga-nization of the SUS, health planning, health care
and interfederative coordination8.
The National Primary Care Policy published in 2012 defines that ensuring pharmaceutical ser-vices is one of the actions that should be includ-ed in the project to deploy teams and the Family
Health Support Centers (NASF)9.
Currently, the financing of the CBAF is estab-lished in Ordinance GM/MS Nº 1.555, of July 30, 2013, and the minimum amount to be invested
by the three spheres of government is R$ 9.82 per inhabitant per year per municipality, with R$ 5.10 paid by the Federal Government, R$ 2.36 invested by the states and R$ 2.36 by the munici-palities. Of this total, municipalities can use 15% of the municipal and state counterparts in the structuring of pharmaceutical services services. The National List of Essential Medicines (RE-NAME) is the guideline list for defining the drug
list financed with this resource10.
Despite development of regulatory frame-works for pharmaceutical services in primary care, there are still countless challenges to its
structuring. According to Oliveira et al.11, many
factors compromise the quality of pharmaceu-tical services in Brazilian municipalities, among them the lack of financial resources.
Studies12-14 have demonstrated the trend of
drug expenditure in the country, but due to the limited access to procurement and consumption data, the evaluation of the pharmaceutical ser-vices financing model in Brazil is still incipient.
In 2013, the MS created the National Data-base of Pharmaceutical services Actions and Ser-vices in the SUS (BNDAF) aiming at providing information on the management of pharmaceu-tical services to assist decision-making of
manag-ers and health professionals15.
Based on these data, this study aims to ana-lyze the financial value invested per inhabitant / year in Brazilian municipalities for the procure-ment of CBAF drugs, according to population size and geographic region, and to contribute to the discussion on the financing of pharmaceuti-cal services in primary care.
Methodology
This is a descriptive, retrospective cross-sectional study with data from the National Database of Pharmaceutical Services Actions and Services in
the SUS (BNDAF)15, consisting of a set of data
referring to the Basic Component of Pharma-ceutical Services registered in Hórus – National
Pharmaceutical Services Management System16
or sent through a web service by the Brazilian municipalities.
The study’s collected data from the period July 2013-June 2014 and records of procurement con-taining drugs and supplies from Annexes I and IV
of RENAME 8th edition17, referring to the CBAF
pur-e C
ole
tiv
a,
22(8):2453-2462,
2017
chased in a pharmaceutical facility; product unit value; management model and acquisition mode,
according to Law Nº 8.666, of June 21, 199318.
Municipalities with a year or more of records in the BNDAF were selected to define the sample, and those that recorded procurement data with no monetary value of the products purchased were excluded, which generated a per capita/year value of R$ 0.00 for the studied period.
Of the municipalities selected, records con-taining MS centralized drugs procurement, products recorded as donation and items whose unit value multiplied by the quantity purchased was higher than the total annual resource that the municipality should have to purchase medicines and CBAF supplies were excluded. The latter were considered as systems’ feeding errors.
The calculation of the value invested per inhabitant / year was based on the sum of the recorded acquisitions, divided by the popula-tion of the municipality, used for the transfer of funds for pharmaceutical services in primary care, based on the estimate made by the Brazilian Institute of Geography and Statistics (IBGE) in 2009 and 2011, as set forth in Ordinance GM/MS
Nº 1.555/201310.
Descriptive analyses were made of expenses with the procurement of medicines in monetary values – means and the respective standard devi-ations, medians and coefficient of variation – as well as the distribution of absolute and relative frequencies by geographical region, state and population size.
The relationships between the variables con-sidered in the study were verified through Spear-man’s correlation coefficient. The Kruskal-Wallis test with a significance level of 5% was employed in the comparison of the financial value applied per inhabitant / year, according to management models and regions.
For the definition of the most acquired drugs, the quantity acquired in all the municipalities was added and, according to it, drugs were classi-fied from the most acquired to the least acquired in descending order. Drugs were grouped accord-ing to the main group of Anatomical Therapeu-tic Chemical (ATC) classification system, which corresponds to the organ or system in which the
substance acts19.
The simple mean and standard deviation of unit acquisition values were calculated and the weighted average of acquisitions recorded in the Health Price Bank (BPS) in the period 28/03/2013-28/09/2014 was used for comparison purposes, extracted through the item report by
a Ministry of Health program. All analyses were performed through statistical package SPSS 20.
Results
Records referring to the procurement of medi-cines and supplies of the CBAF in 1,801 munic-ipalities were identified from BNDAF’s data. Of these, 841 were excluded because they did not have at least one year of data recording that in-cluded the period July 2013-June 2014. There-fore, CBAF’s items acquisition data in 960 mu-nicipalities were analyzed to perform this study.
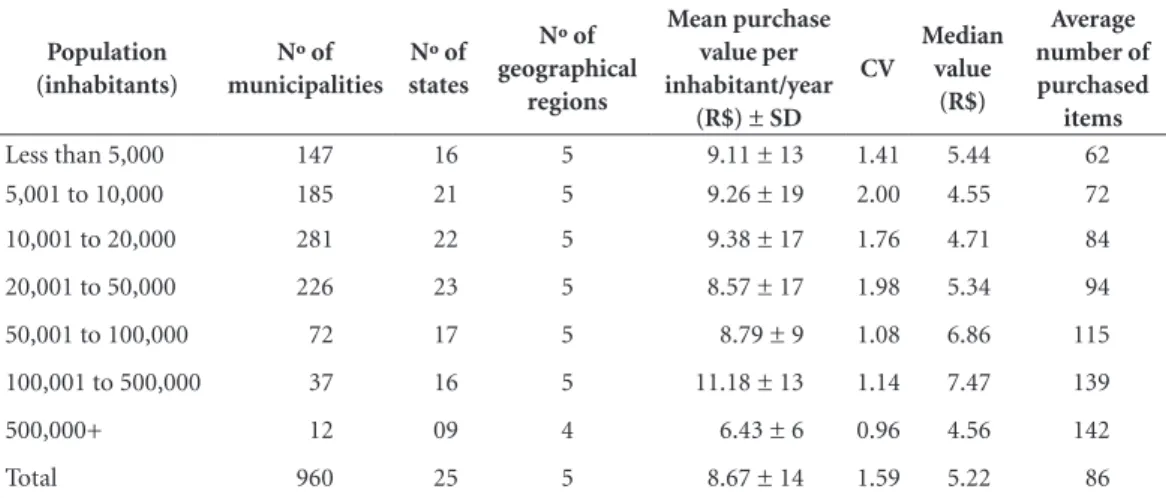
The distribution of municipalities by pop-ulation size in the five geographic regions and 25 states of the country, as well as the mean and median financial value applied per inhabitant / year and the mean purchased items are shown in Table 1.
When observing the distribution of munic-ipalities by population size, we found that most (52.6%) has a population between 10 and 50 thousand inhabitants. There is a great variabil-ity in relation to the mean values of municipal acquisitions per inhabitant / year, regardless of population size. However, those with population above 500 thousand inhabitants show more ho-mogeneous data compared to other population brackets. This study also found no correlation between the population and the amount applied
per inhabitant / year (rs = 0.038, p = 0.244) (data
not shown in the table).
When analyzing the results, it was observed that the sample stratified by population size is heterogeneous and that there is a well-established trend between the population and the amount invested per inhabitant / year. Municipalities with a population of more than 500,000 inhab-itants used, on average, less resources (R$ 6.43) to provide more items for users’ access. On the other hand, municipalities with a population be-tween 100 and 500 thousand inhabitants had an average expenditure higher than the minimum recommended, but, according to Table 1, expense was lower when checking the median. In relation to the number of items purchased, it was verified that the larger the population size, the higher the mean number (Table 1).
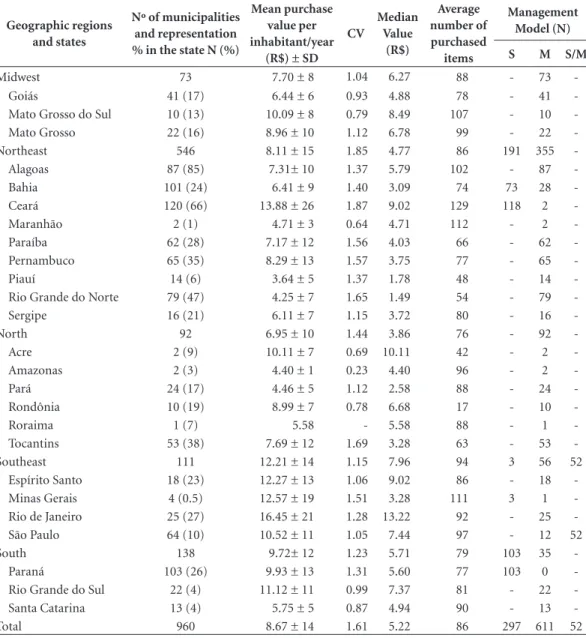
Table 2 shows the average value per inhabi-tant per year, by geographic region and state, as well as the classification of municipalities accord-ing to management model.
hetero-Po
nt
geneous. The municipalities of the Southeast region, on average, invested a higher acquisition value per capita / year and acquired more items than municipalities of the other regions. This value was also higher than the minimum defined in the current legislation, but the median value was lower.
It was also observed that the mean and medi-an values of municipal acquisitions in the in the other regions of the Country were smaller than set forth in the current Ordinance.
In detailing these data by state, we found an average per capita / year acquisition value greater than R$ 9.82 in the states of Paraná, Rio Grande do Sul, Acre, Ceará and Mato Grosso do Sul, as well as states of Southeast. The median expendi-ture higher than the Ordinance was identified in more than 50% of the municipalities of Rio de Janeiro (Table 2).
Regarding the management model, it was observed that 611 (64%) municipalities have a decentralized CBAF resource management, that is, the procurement of drugs and supplies was performed directly by the municipality. In the South, Southeast and Northeast regions, there were states responsible for acquiring primary care items, but it was not possible to ascertain a relationship between the lowest mean value in municipalities with the state-centralized man-agement model (Table 2).
Figure 1 shows the distribution of the sam-ple by population size and geographic region, by average value of acquisition per inhabitant / year
invested. It shows that 700 (73%) municipalities invested less than R$ 9.82 per capita / year, of which 453 (47%) have less than 20,000 inhab-itants. Furthermore, according to the propor-tionality of the sample, the North region has the largest number of municipalities with the lowest investment, followed by the Northeast and Mid-west regions.
When checking the medicines procurement mode reported by municipalities, it was noticed that, among those who registered this data (n = 534), most (76%) indicated “tender” as the most frequent, followed by “price quotation” (6%), “competition” (2%) and “invitation” (less than 1%). It is noteworthy that 15% recorded “waiver of bidding” as the most used procurement mode. When analyzing the average unit value of the 20 most purchased drugs and supplies in a phar-maceutical facility, 95% of these items are priced above the mean recorded in BPS, in the period 28/03/2013-28/09/2014 (Table 3).
Of the 20 most purchased items by the mu-nicipalities of the sample, half (50%) were used for cardiovascular system-related problems, 20% for diabetes treatment and monitoring, 15% for nervous system, 10% analgesics and 5% for pro-ton pump inhibitors (Table 3).
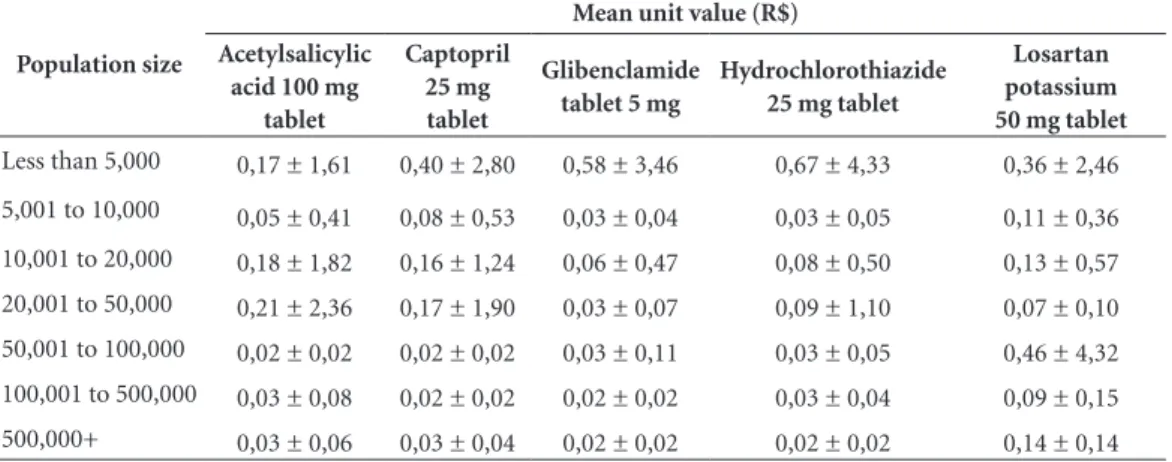
When calculating the mean unit value of the five most purchased items, by population size, it was found that the average unit price is lower in municipalities with a population greater than 50,000 inhabitants, with the exception of Losar-tan potassium 50 mg, which had a mean unit
Table 1. Distribution of Brazilian municipalities (N = 960), by population size, by mean financial value invested
per inhabitant/year, coefficient of variation, median and average number of purchased items. Brazil, July 2013-June 2014.
Population (inhabitants)
Nº of municipalities
Nº of states
Nº of geographical
regions
Mean purchase value per inhabitant/year
(R$) ± SD CV
Median value
(R$)
Average number of purchased
items
Less than 5,000 147 16 5 9.11 ± 13 1.41 5.44 62
5,001 to 10,000 185 21 5 9.26 ± 19 2.00 4.55 72
10,001 to 20,000 281 22 5 9.38 ± 17 1.76 4.71 84
20,001 to 50,000 226 23 5 8.57 ± 17 1.98 5.34 94
50,001 to 100,000 72 17 5 8.79 ± 9 1.08 6.86 115
100,001 to 500,000 37 16 5 11.18 ± 13 1.14 7.47 139
500,000+ 12 09 4 6.43 ± 6 0.96 4.56 142
Total 960 25 5 8.67 ± 14 1.59 5.22 86
e C
ole
tiv
a,
22(8):2453-2462,
2017
price variation of 654%, and it was not possible to establish a relationship between the mean unit value and the population size for that drug. It was also observed that municipalities with 5 to 10,000 inhabitants acquired medicines for a mean unit value lower than municipalities with 10 to 50,000 inhabitants. (Table 4).
Discussion
The present study analyzed the financial value applied per inhabitant per year in 17% of the Brazilian municipalities for the procurement of medicines and supplies of the CBAF and iden-tified differences between population sizes, geo-graphic regions, management model, number of items purchased, average unit value of items and types of bid proceedings.
Table 2. Distribution of Brazilian municipalities (N = 960) by geographic region and by state, according to the
financial value of the acquisitions and management model. Brazil, July 2013 - June 2014.
Geographic regions and states
Nº of municipalities and representation % in the state N (%)
Mean purchase value per inhabitant/year
(R$) ± SD CV
Median Value
(R$)
Average number of purchased
items
Management Model (N)
S M S/M
Midwest 73 7.70 ± 8 1.04 6.27 88 - 73
-Goiás 41 (17) 6.44 ± 6 0.93 4.88 78 - 41
-Mato Grosso do Sul 10 (13) 10.09 ± 8 0.79 8.49 107 - 10
-Mato Grosso 22 (16) 8.96 ± 10 1.12 6.78 99 - 22
-Northeast 546 8.11 ± 15 1.85 4.77 86 191 355
-Alagoas 87 (85) 7.31± 10 1.37 5.79 102 - 87
-Bahia 101 (24) 6.41 ± 9 1.40 3.09 74 73 28
-Ceará 120 (66) 13.88 ± 26 1.87 9.02 129 118 2
-Maranhão 2 (1) 4.71 ± 3 0.64 4.71 112 - 2
-Paraíba 62 (28) 7.17 ± 12 1.56 4.03 66 - 62
-Pernambuco 65 (35) 8.29 ± 13 1.57 3.75 77 - 65
-Piauí 14 (6) 3.64 ± 5 1.37 1.78 48 - 14
-Rio Grande do Norte 79 (47) 4.25 ± 7 1.65 1.49 54 - 79
-Sergipe 16 (21) 6.11 ± 7 1.15 3.72 80 - 16
-North 92 6.95 ± 10 1.44 3.86 76 - 92
-Acre 2 (9) 10.11 ± 7 0.69 10.11 42 - 2
-Amazonas 2 (3) 4.40 ± 1 0.23 4.40 96 - 2
-Pará 24 (17) 4.46 ± 5 1.12 2.58 88 - 24
-Rondônia 10 (19) 8.99 ± 7 0.78 6.68 17 - 10
-Roraima 1 (7) 5.58 - 5.58 88 - 1
-Tocantins 53 (38) 7.69 ± 12 1.69 3.28 63 - 53
-Southeast 111 12.21 ± 14 1.15 7.96 94 3 56 52
Espírito Santo 18 (23) 12.27 ± 13 1.06 9.02 86 - 18
-Minas Gerais 4 (0.5) 12.57 ± 19 1.51 3.28 111 3 1
-Rio de Janeiro 25 (27) 16.45 ± 21 1.28 13.22 92 - 25
-São Paulo 64 (10) 10.52 ± 11 1.05 7.44 97 - 12 52
South 138 9.72± 12 1.23 5.71 79 103 35
-Paraná 103 (26) 9.93 ± 13 1.31 5.60 77 103 0
-Rio Grande do Sul 22 (4) 11.12 ± 11 0.99 7.37 81 - 22
-Santa Catarina 13 (4) 5.75 ± 5 0.87 4.94 90 - 13
-Total 960 8.67 ± 14 1.61 5.22 86 297 611 52
Data source: BNDAF.
Po
nt
Most of the municipalities applied a finan-cial value below that recommended by the cur-rent legislation. Several factors may be related to this fact, among them are the non-application of state and/or municipal counterpart; state and/or municipal counterparts in disagreement with the agreement; lack of inventory control or short-comings, leading to procurement of quantities
greater or less than needed20. Another factor that
may be influencing the total value applied per in-habitant / year is the resource management mod-el, which must be agreed upon at the Bipartite Interagency Commission (CIB).In this study, it was verified that municipalities with a munici-pality-decentralized management of basic phar-maceutical services invest, on average, less than the municipalities with total or partial state-cen-tralized management.
Municipalities have sought strategies to make financing of pharmaceutical services in primary care more effective and safe, such as procurement via intermunicipal consortia and qualification of
the procurementprocess13,21,22. A study21 pointed
out that the use of a consortium for the purchase of medicines led to a reduction in the shortage of products, an expressive saving of resources and, through the contract for the registration of prices, made it possible to rationalize the use of the bud-get in a municipality of Santa Catarina. According
to Amaral and Blatt22 the adhesion of the
munic-ipalities of Paraná to the consortium for the pro-curement of medicines reduced costs, thus en-suring a greater supply of medicines and curbing the Basic Pharmaceutical Services component’s supply shortcomings. Prices paid in 2008 for the purchase of medicines per unit, now under the influence of the consortium, were systematically lower than in 2007 (63% of items). When com-paring 2009 unit values with the procurement of medicines through consortium with 2007 values,
unit values were lower for 76% of the items13.
In this study, differences in per capita spend-ing were identified between the population siz-es and one of the hypothsiz-essiz-es for this situation
Figure 1. Distribution of Brazilian municipalities (N = 960), by population size, geographical region and CBAF
minimum funding value. Brazil, July 2013-June 2014.
Data source: BNDAF.
Note: The minimum value defined in Ordinance Nº 1.555/2013 for CBAF financing is R$ 9.82 per inhabitant per year. Midwest
Northeast North Southeast South Less than 5,000 5,001 to 10,000 10,001 to 20,000 20,001 to 50,000 50,001 to 100,000 100,001 to 500,000 Over 500,000
P
o
pulat
io
n siz
e
Ge
o
g
rap
hic r
eg
io
n
39 43 78 59 23 14
4 22
124 19 48
47 108
142 203 167 49 23
8 51
422 73 63
91
e C
ole
tiv
a,
22(8):2453-2462,
2017
Table 4. Unit purchase value of the five most acquired CBAF’s items, by population size of the Brazilian
municipalities. Brazil, July 2013 - June 2014.
Population size
Mean unit value (R$) Acetylsalicylic
acid 100 mg tablet
Captopril 25 mg tablet
Glibenclamide tablet 5 mg
Hydrochlorothiazide 25 mg tablet
Losartan potassium 50 mg tablet
Less than 5,000 0,17 ± 1,61 0,40 ± 2,80 0,58 ± 3,46 0,67 ± 4,33 0,36 ± 2,46
5,001 to 10,000 0,05 ± 0,41 0,08 ± 0,53 0,03 ± 0,04 0,03 ± 0,05 0,11 ± 0,36
10,001 to 20,000 0,18 ± 1,82 0,16 ± 1,24 0,06 ± 0,47 0,08 ± 0,50 0,13 ± 0,57
20,001 to 50,000 0,21 ± 2,36 0,17 ± 1,90 0,03 ± 0,07 0,09 ± 1,10 0,07 ± 0,10
50,001 to 100,000 0,02 ± 0,02 0,02 ± 0,02 0,03 ± 0,11 0,03 ± 0,05 0,46 ± 4,32
100,001 to 500,000 0,03 ± 0,08 0,02 ± 0,02 0,02 ± 0,02 0,03 ± 0,04 0,09 ± 0,15
500,000+ 0,03 ± 0,06 0,03 ± 0,04 0,02 ± 0,02 0,02 ± 0,02 0,14 ± 0,14
Data source: BNDAF.
Table 3. Mean unit value of the most purchased CBAF items, in a pharmaceutical facility, by the Brazilian
municipalities. Brazil, July 2013 - June 2014.
Medicines Mean unit value
(R$ ± SD)*
BPS mean unit value** (R$)
Cardiovascular system
Captopril 25 mg tablet (1st) 0.15 ± 1.5 0.04
Hydrochlorothiazide 25 mg tablet (2nd) 0.13 ± 1.6 0.02
Losartan potassium 50 mg tablet (4th) 0.17 ± 1.6 0.07
Propranolol, hydrochloride 40 mg tablet (7th) 0.12 ± 1.3 0.02
Enalapril maleate 20 mg tablet (11th) 0.38 ± 3.5 0.06
Simvastatin 20 mg tablet (14th) 0.13 ± 0.3 0.05
Atenolol 50 mg tablet (15th) 0.14 ± 1.5 0.03
Amlodipine besylate 5 mg tablet (18th) 0.07 ± 0.4 0.03
Furosemide 40 mg tablet (19th) 0.16 ± 1.7 0.03
Alimentary tract and metabolism
Glibenclamide tablet 5 mg (3rd) 0.10 ± 1 0.01
Omeprazole 20 mg pill (6th) 0.36 ± 3 0.04
Metformin, hydrochloride 850 mg tablet (8th) 0.45 ± 5.6 0.05
Metformin, hydrochloride 500 mg tablet (16th) 0.14 ± 1.3 0.05
Inputs
Reagent strip to measure capillary glycaemia (17th) 6.63 ± 19.7 0.19
Blood and blood forming organs
Acetylsalicylic acid 100 mg tablet (5th) 0.13 ± 1.6 0.02
Musculo-skeletal system
Ibuprofen 600 mg tablet (13th) 0.31 ± 3 0.09
Nervous system
Amitriptyline, hydrochloride 25 mg tablet (9th) 0.35 ± 3 0.41
Carbamazepine 200 mg tablet (10th) 0.37 ± 4.3 0.12
Fluoxetine, hydrochloride 20 mg pill (12th) 0.35 ± 3.2 0.09
Paracetamol 500 mg tablet (20th) 0.22 ± 2.07 0.04
Data source: BNDAF and BPS.
Po
nt
would be the acquisition in scale, which allows
for better price negotiation. Marin et al.23
recom-mend that public administrations create mech-anisms that allow them to expand their pro-curement scale by using consolidated purchases, through acquisitions over a longer period of time – 12 months, for example – associations or con-sortia between several institutions, processing the purchases jointly.
There was also an uneven investment of re-sources among geographic regions, as shown by the higher mean investment in the Southeast and South regions, which are the most economically
active and industrialized regions in Brazil24. The
hypothesis that may be related to this difference
is access to health services. A study25showsthat
federal expenditure per inhabitant, in a special-ized outpatient clinic, hospital care and phar-maceutical services were higher in the Southeast and South regions, followed by the Midwest, with lower expenditure in the Northeast and North, thus reflecting the uneven supply and use of health services in the country.
Another aspect observed was the procure-ment mode used by municipalities. This study found that “tender” was the most commonly informed mode by most municipalities that
re-corded this data. Merisio et al.21 verified that,
according to respondents, choosing face-to-face tender mode for the procurement of medicines, along with the price registration are enabling a greater level of savings for the municipal public administration.
However, the percentage of municipalities that used the bidding waiver more often and the number of municipalities that did not register this data is relevant and leads to a reflection on the quality of the drug acquisition process in
Bra-zilian municipalities. A study26 published in 2014
indicates that 52.7% of municipalities in Paraíba detected “non-compliance with drug purchase regulations”, which is one of the main flaws or ir-regularities found in public tenders. In addition, 29.1% of the municipalities reported the “frac-tionation of expenses for the purchase of medi-cines”, which is characterized by dividing the es-timated expenditure with a view to carrying out direct contracting or using a bidding modality less complex than that provided by law.
Regarding the average number of items pur-chased by the municipalities, it was observed
that, in relation to RENAME 8th edition, 25% of
the items on this list were purchased. This per-centage is slightly higher (35%) compared to the number of items available in the National
Ref-erence List (ERN) of Ordinance Nº 4217/2010,
effective until July 2013. RENAME 8th edition
listed 348 items for procurement and ERN 245 decentralized procurement items. It is worth re-membering that the list of medicines of munici-palities must always consider the local / regional epidemiological profile, and it is not mandatory to make available all CBAF’s medicines.
In relation to the unit values of the CBAF products most acquired by the municipalities of the sample, compared to the population size and the mean unit value shown in the BPS, it is worth noting that there is a need to carry out a more de-tailed analysis to identify factors involved in price differences shown. In any case, it is important to note that the results found in most municipali-ties show that the items purchased are above the price presented in the BPS, and that the value ap-plied per inhabitant / year by them is lower than the minimum established by current legislation, Which can lead to great losses for the access to medicines in the assisted population.
When analyzing the pharmacological classes of the most acquired drugs, it was verified that cardiovascular drugs, oral antidiabetic drugs and drugs for the nervous system were predominant. These groups of drugs treat some of the most prevalent diseases in the Brazilian population, as
observed in national literature27,28.
Some limitations in this study should be con-sidered. The methodology used only the list of medicines geared to the CBAF, from RENAME
8th edition, to define the financial value per
in-habitant / year, which may result in underesti-mated figures, since municipalities can purchase other medicines for primary care with their own resources. The use of 15% of the state and mu-nicipal resources to structure pharmaceutical services was not considered, an amount that changes the minimum value to be invested for the procurement of medicines and supplies by the municipalities. Data omission and the even-tual feeding of information systems are also lim-iting factors, since the obligation to send data to BNDAF on a continuous basis is determined for a small part of the Brazilian municipalities.
e C
ole
tiv
a,
22(8):2453-2462,
2017
resources. Therefore, the strategy of reassessing resources for pharmaceutical services in primary care, according to criteria that consider regional and demographic differences found in this study, can be a first step towards further discussion of the financing model.
BNDAF’s data review also reveals that there are still few municipalities that use pharmaceuti-cal services information systems provided by the
Federal Government. The non-mandatory use of information systems hinders the monitoring of the implementation of pharmaceutical ser-vices, since there is insufficient data to generate adequate information to evaluate the financing model and to produce pharmaceutical services results indicators in the country, also influencing the monitoring of access and availability of med-icines to the population.
Collaborations
MA Pontes, JOS Naves and NUL Tavares con-tributed in the design and outline of the study, analysis and interpretation of the results and critical review of the intellectual content of the manuscript. PMSB Francisco contributed to the analysis and interpretation of the results. All au-thors participated in the writing, approved the final version of the manuscript and undertake responsibility for all aspects of the work, ensur-ing its accuracy and integrity.
References
1. Brasil. Ministério da Saúde (MS). Portaria GM nº3.916, de 30 de outubro de 1998. Dispõe sobre a aprovação da Política Nacional de Medicamentos. Diário Oficial da
União 1998; 31 out.
2. Brasil. Ministério da Saúde (MS). Portaria GM nº 176, de 8 de março de 1999. Estabelece que o Incentivo à Assistência Farmacêutica Básica será financiado pelos três gestores, e que a transferência de recursos está con-dicionada a contrapartida dos estados, Distrito Federal e municípios. Diário Oficial da União 1999; 9 mar. 3. Brasil. Ministério da Saúde (MS). Portaria GM nº 204,
de 29 de janeiro de 2007. Regulamenta o financiamento e a transferência dos recursos federais para as ações e os serviços de saúde, na forma de blocos de financiamen-to, com o respectivo monitoramento e controle. Diário Oficial da União 2007; 30 jan.
4. Brasil. Ministério da Saúde (MS). Relação Nacional de Medicamentos Essenciais: Rename 2014. 9a ed. Brasília: MS; 2015.
5. Brasil. Ministério da Saúde (MS). Portaria GM nº 2.982, de 26 de novembro de 2009. Aprova o Compo-nente Básico da Assistência Farmacêutica. Diário Ofi-cial da União 2009; 27 nov.
Po
nt
7. Brasil. Ministério da Saúde (MS). Portaria nº 399, de 22 de fevereiro de 2006. Divulga o Pacto pela Saúde 2006 – Consolidação do SUS e aprova as Diretrizes Opera-cionais do Referido Pacto. Diário Oficial da União 2006; 23 fev.
8. Brasil. Decreto nº 7.508, de 28 de junho de 2011. Regu-lamenta a Lei no 8.080, de 19 de setembro de 1990, para dispor sobre a organização do Sistema Único de Saúde - SUS, o planejamento da saúde, a assistência à saúde e a articulação interfederativa, e dá outras providências.
Diário Oficial da União 2011; 20 set.
9. Brasil. Ministério da Saúde (MS). Política Nacional de Atenção Básica. Brasília: MS; 2012.
10. Brasil. Ministério da Saúde (MS). Portaria GM nº 1.555, de 30 de julho de 2013. Dispõe sobre as normas de financiamento e de execução do Componente Bási-co da Assistência Farmacêutica no âmbito do Sistema Único de Saúde (SUS). Diário Oficial da União 2013; 31 jul.
11. Oliveira LCF, Assis MMA, Barboni AR. Assistência Farmacêutica no Sistema Único de Saúde: da Política Nacional de Medicamentos à Atenção Básica à Saúde.
Cien Saude Colet 2010; 15(3):3561-3567.
12. Vieira FS. Gasto do Ministério da Saúde com medica-mentos: tendência dos programas de 2002 a 2007. Rev
Saude Publica 2009; 43(4):674-681.
13. Amaral SMS, Blatt CR. Consórcio intermunicipal para a aquisição de medicamentos: impacto no desabasteci-mento e no custo. Rev Saude Publica 2011; 45(4):799-801.
14. Silva RM, Caetano R. Gastos da Secretaria Municipal de Saúde do Rio de Janeiro, Brasil, com medicamentos: uma análise do período 2002-2011. Cad Saude Publica
2014; 30(6):1207-1218.
15. Brasil. Ministério da Saúde (MS). Portaria nº 271, de 27 de fevereiro de 2013. Institui a Base Nacional de Dados de ações e serviços da Assistência Farmacêutica e regu-lamenta o conjunto de dados, fluxo e cronograma de envio referente ao Componente Básico da Assistência Farmacêutica no âmbito do Sistema Único de Saúde (SUS). Diário Oficial da União 2013; 28 fev.
16. Costa KS, Nascimento Júnior JM. HÓRUS: inovação tecnológica na Assistência Farmacêutica no Sistema Único de Saúde. Rev Saude Publica 2012; 46(1):91-99. 17. Brasil. Ministério da Saúde (MS). Relação Nacional de
Medicamentos Essenciais: Rename 2013. 8a ed. Brasília: MS; 2013.
18. Brasil. Lei nº 8.666, de 21 de junho de 1993. Regula-menta o Art. 37, inciso XXI, da Constituição Federal, institui normas para licitações na administração pú-blica e dá outras providências. Diário Oficial da União
1993; 22 jun.
19. World Health Organization [homepage da internet]. ATC: Structure and principles [acesso em 12 jun 2016]. Disponível em: http://www.whocc.no/atc/structure_ and _principles/
20. Vieira FS. Qualificação dos serviços farmacêuticos no Brasil: aspectos inconclusos da agenda do Sistema Úni-co de Saúde. Rev Panam Salud Publica 2008; 24(2):91-100.
21. Merisio A, Kleba ME, Silva NC, Kovaleski DF. A aqui-sição de medicamentos para o Sistema Único de Saúde em municípios de pequeno porte do Estado de Santa Catarina. Rev Bras Farm 2012; 93(2):173-178. 22. Bevilacqua G, Farias MR, Blatt CR. Aquisição de
medi-camentos genéricos em município de médio porte. Rev
Saude Publica 2011; 45(3):583-589.
23. Marin N, Luiza VL, Osório-de-Castro, CGS, Machado-dos-Santos S, organizadores. Assistência farmacêutica
para gerentes municipais. Rio de Janeiro: OPAS/OMS;
2003.
24. Instituto Brasileiro de Geografia e Estatística (IBGE). Contas nacionais. Divulga os resultados do Sistema de Contas Nacionais relativos às tabelas de recursos e usos, contas econômicas integradas, contas regionais do Brasil, produto interno bruto dos municípios e matriz de insumo
-produto. Rio de Janeiro: IBGE; 2013.
25. Machado CV, Lima LD, Andrade CLT. Federal funding of health policy in Brazil: trends and challenges. Cad
Saude Publica 2014; 30(1):187-200.
26. Bruns SF, Luiza VL, Oliveira EA. Gestão da assistên-cia farmacêutica em municípios do estado da Paraíba (PB):olhando a aplicação de recursos públicos. Revista
de Administração Pública 2014; 48(3):745-765.
27. Brasil. Ministério da Saúde (MS). Secretaria de Vigilân-cia em Saúde. Departamento de Análise de Situação de Saúde. Plano de ações estratégicas para o enfrentamento das doenças crônicas não transmissíveis (DCNT) no Bra-sil 2011-2022. Brasília: MS; 2011.
28. Costa KS, Barros MBA, Francisco PMSB, César CLG, Goldbaum M, Carandina L. Utilização de medicamen-tos e fatores associados: um estudo de base populacio-nal no Município de Campinas, São Paulo, Brasil. Cad
Saude Publica 2011; 27(4):649-658.
Article submitted 26/03/2016 Approved 09/09/2016