Interception measurements and assessment of Gash model
performance for a tropical semi-arid region
1Medidas de interceptação e avaliação do desempenho do modelo de Gash para uma
região semi-árida
Pedro Henrique Augusto Medeiros2 *, José Carlos de Araújo3 e Axel Bronstert4
Abstract – Semi-arid environments usually face water scarcity and conflicts for its use; therefore a complete understanding of the water balance in these regions is desired. To evaluate interception, measurements of precipitation, throughfall and stemflow were carried out in a Brazilian tropical semi-arid experimental watershed with well preserved Caatinga vegetation. Data analysis indicates that interception losses correspond to 13% of total rainfall, representing an important process in the watershed’s water balance, where runoff is only 6% of total precipitation. Gash interception model was applied in the region with good results for long term simulation. Nevertheless, the model produced significant but not systematic errors on a daily basis. This was attributed to its incapability of representing the temporal variation of precipitation during the event, which is a major factor affecting interception. Rainfall intensity was shown to be a good parameter to determine an applicability threshold for Gash model in the study area.
Key words – Canopy interception. Semi-Arid. Caatinga Vegetation. Gash Model.
Resumo – Ambientes semi-áridos normalmente enfrentam escassez hídrica e conflitos pelo uso da água; portanto um completo entendimento do balanço hídrico nessas regiões é desejável. Para avaliar a interceptação vegetal, medidas de precipitação, precipitação interna e escoamento pelos troncos foram realizadas em uma bacia experimental no semi-árido brasileiro com vegetação de Caatinga preservada. A análise dos dados indica que as perdas por interceptação correspondem a 13% da precipitação total, representando um importante processo no balanço hídrico da bacia, onde o escoamento corresponde a uma parcela de somente 6% da precipitação. O modelo de interceptação de Gash foi aplicado na região com bons resultados em simulação de longo prazo. No entanto, o modelo produziu erros significativos, porém não sistemáticos, em escala diária. Isso foi atribuído à sua incapacidade de representar a variação temporal da precipitação durante o evento chuvoso, que é um fator importante que afeta a interceptação. A intensidade da chuva se mostrou um bom parâmetro para determinar um limite de aplicabilidade do modelo de Gash na área de estudo.
Palavras-chave – Interceptação vegetal. Semi-Árido. Caatinga. Modelo de Gash.
* Autor para correspondência
1Recebido para publicação em 08/08/2008; aprovado em 04/03/2009
Publication resulting from a master’s dissertation, Department of Hydraulic and Environmental Engineering, Federal University of Ceará, Brazil 2Civil Engineer, doctorate student, Department of Hydraulic and Environmental Engineering, Federal University of Ceará, Brazil. R. Arq. Reginaldo
Rangel, 155, ap. 2004, CEP: 60 191-250, Fortaleza-CE, phamedeiros@gmail.com
3Civil Engineer, D.Sc., Professor of the Department of Agricultural Engineering, Federal University of Ceará, Centre for Agrarian Sciences, Brazil, jcaraujo@ufc.br
4Civil Engineer, D.Sc., Professor of the Institut für Geoökologie, Universität Potsdam, Complex II Golm, House 1, Room 1.09, Potsdam, Germany, axelbron@uni-potsdam.de
Introduction
Water scarcity has become a major problem in many places around the world, with some regions already under water stress. Climate change predictions indicate that this problem tends to be aggravated, emphasizing the importance to assess the impacts of human actions on watersheds’ water balance. Therefore, a good comprehension of the hydrological processes is essential for the evaluation of water availability and the anthropogenic effects on watersheds, especially with respect to the adoption of deforestation and reforestation practices. Wang et al. (2004), for example, observed great differences in the components of the water balance for bare and re-vegetated sand dune areas.
In semi-arid regions, where hydrological information is essential due to water scarcity, experimental studies investigating processes like interception are rare, as mentioned by Dunkerley (2000), with some exceptions, such as the studies undertaken by Wang et al. (2005), Carlyle-Moses (2004), Návar et al. (1999) and Khan (1999). Carlyle-Moses (2004) emphasizes the importance of evaluating interception losses in semi-arid regions, since experiments carried out in these environments indicate losses with great hydrological importance. Comprehension and quantification of the interception process become, therefore, essential for water availability assessment in semi-arid environments.
In this context, an experiment was realized in a tropical semi-arid region covered by Caatinga vegetation, in Northeast Brazil, aiming at evaluating interception losses. Measurements occurred from December 2003 to May 2006, with a total of 66 rain events monitored. Assessment of the interception modelling approach proposed by Gash (1979) was conducted as well, providing an evaluation of its performance for the region.
Material and methods
Study area
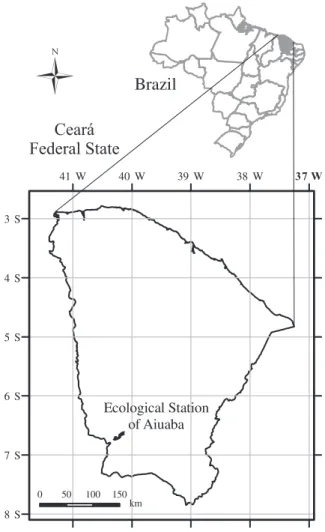
The study was carried out in the Aiuaba Experimental Watershed, located in the Aiuaba Ecological Station, a preservation area in North-eastern Brazil (Figure 1). The experimental site is located in a tropical semi-arid region, on geographic coordinates 40°15’ W, 6°40’ S.
The Caatinga vegetation, a deciduous dry woodland covering most of the semi-arid Brazilian Northeast (ALBUQUERQUE, 1999), is dominated by xerophyte species with a great amount of thorny plants, composed of bushes and trees with small leaves, adapted to transpiration reduction. Canopy is 3 to 7 meters high,
Ceará
Federal State
37 W
Figure 1 – Location map
and since the leaves fall during the dry period, landscape is intensively modified throughout the year.
In the Ecological Station of Aiuaba the Caatinga is well preserved and dense. According to Lemos (2006), the plant families with the greatest amount of species are Leguminosae (37 species) and Euphorbiaceae (15 species), of which the most common species sampled by the author are: Bauhinia cheilantha, Croton floribundus Spreng., Croton nepetifolius Baill., Maprounea guianensis Aubl. and Machaerium sp. In the experimental site, 77 plants with diameter at ground level greater than 3 cm were catalogued, resulting in a density of 7700 units/ha. Fifty-seven percent of the trees in the experimental site have a diameter varying from 3 to 6 cm.
Mean annual precipitation is about 550 mm, concentrated in summer and autumn and the potential evaporation is as high as 2500 mm annually, providing a high atmospheric water deficit during most of the year. The high evaporation rates also provide a precipitation regime characterized by convective rainfall events, i.e. generated
by local evaporation, and therefore of short duration and high intensities. Mean annual temperature in the area shows a reduced monthly variation, from 24.5 ºC in June and July to 27.8 ºC in November. The relative humidity of the air is mild, with a yearly average of 61.1%, and a minimum of 44.0% in September.
Experimental design
As done by most authors (CARLYLE-MOSES, 2004; KHAN, 1999; VIEIRA; PALMIER, 2006; WANG et al., 2005, for instance), interception losses were estimated indirectly, by the difference of total rainfall and the amount of water that reaches the ground, represented by the sum of throughfall and stemflow. The experimental site consisted of a 10 x 10 m² area chosen due to its vegetation representation (same species and vegetation density as observed in the undisturbed Caatinga in North-eastern Brazil, according to Lemos, 2006), access without the need to cut trees (the site is located in a preservation area) and proximity to an open area where total precipitation could be measured. Total precipitation was recorded daily using a ‘Ville de Paris’ rain-gauge located 15 meters from the experimental site, and throughfall was quantified using ten similar rain-gauges, placed randomly under the vegetation and replaced every two weeks as proposed by Lloyd and Marques (1988). The performance of the gross-precipitation rain-gauge (measured manually) was assessed by comparing its measurements with those recorded automatically (5-minute intervals) by another gauge located at the same site. The 5-minute rainfall data recorded automatically were also used to compute rainfall intensities presented on this study.
Throughfall was estimated as the average of the ten values registered on the rain-gauges under the vegetation, not considering those out of the range delimited by the average ± 2 times the standard deviation. This criterion was used to overcome some discrepancies on a few measurements (for instance, 9 gauges recording high volumes and 1 gauge recording a very low throughfall), and the recorded values that were excluded of the analysis seem to have some inconsistency, most of which consisting of zeroes.
Stemflow was measured on five trees of different diameters, around the stems of which gutters were built with plastic mass. It was assumed that each tree was representative of a diameter class, and that the stemflow for all trees of a class was the same as the one for the monitored tree of that same class. Regarding the rain events for which some stemflow had not been computed due to overflow of the reservoirs, the missing value was estimated from a regression between stemflow and rainfall for that specific tree.
Gross precipitation, throughfall and stemflow were measured on a daily scale, and not by events. Therefore,
the values registered may represent more than one rain event occurring during the same day.
Litter interception may also be of importance in the study region. The storage capacity of this layer was estimated as proposed by Crockford and Richardson (1990, apud CROCKFORD; RICHARDSON, 2000) as follows:
• All leaves and branches in a 2.0 x 2.0 m² area were
collected;
• This material was weighted in its natural condition; • The leaves and branches were then saturated by putting
them into water and weighed again while wet;
• By the weight difference, moisture content was
estimated.
Modelling approach
Gash interception model (1979) has been largely used to estimate the interception losses, since it is physically based but includes some simplifications if compared to the model proposed initially by Rutter et al. (1971). The model runs on a daily basis, the same time interval as hydrological models developed for semi-arid regions, such as WASA (GÜNTNER; BRONSTERT, 2004; GÜNTNER et al., 2004) for example.
The model simulates a water balance on the canopy and trunks as a function of the climatic parameters R (mean rainfall rate falling on the saturated canopy) and E (mean evaporation rate during the storm events), and four parameters that represent the canopy and trunks’ characteristics: S = canopy storage capacity; p = free throughfall coefficient; St = trunk storage capacity; pt = proportion of rainfall reaching the trunks. Two additional parameters (the amount of rainfall necessary to fill the canopy – P’G – and the amount of rainfall necessary to fill the trunk – P’t) are required, and can be calculated as:
P' G = - (R/E)S• ln{1 - [E/(R(1 - p -pt))]}
(1)P' t = St/pt
(2)The proportions of interception losses from the canopy and the trunks are given by the equations presented in Table 1, where P is total rainfall during the storm event.
The parameters estimation was carried out for the data during the initial monitoring years (2003/2004). Data from January 2005 to May 2006 were used in the model validation. Canopy and climatic parameters were estimated as suggested in the literature on the subject.
For the estimation of the canopy storage capacity (S) a plot of throughfall versus precipitation was used. An envelope curve was fitted to the points, with S given by the negative intercept of this line with the throughfall data. The proportion of rainfall diverted to the trunks (pt) and the trunk storage capacity (St) were estimated using the regression between stemflow and gross precipitation.
For estimating the free throughfall coefficient, which determines the amount of rain that falls directly to the forest floor without contacting the canopy, some authors (LOUSTAU et al, 1992, for instance) suggest that a relation between throughfall and rainfall for the events insufficient to saturate the canopy should be used. During the parameters estimation period, no events insufficient to saturate the canopy were monitored in the study area. Therefore, estimation of the free throughfall coefficient was realized as proposed by Návar et al. (1999), who carried out their study in a semi-arid region as well. The above-mentioned authors used the minimum relationship between throughfall and rainfall as the free throughfall coefficient. The authors admitted that, under this condition, no drainage occurred, and therefore all throughfall corresponds to water that did not touch the canopy.
Mean rainfall rate on the saturated canopy (R) was estimated based on registers of gross precipitation accumulated in 5 minutes intervals, recorded in a climatic station in the open area where gross precipitation was measured in this study. Mean evaporation rate from the saturated canopy (E) was estimated by the product of R by the slope of the regression between interception loss and precipitation depth for events great enough to saturate the canopy, as suggested by Gash (1979).
Results and discussion
Measurements of total rainfall, throughfall and stemflow carried out in the experimental site from December 2003 to May 2006 indicate that, for the 1658 mm of precipitation registered for the 66 monitored rain events, 81% correspond to throughfall, 6% is characterized as stemflow and the interception losses respond for 13% of total rainfall.
The high interception losses (13% against average runoff coefficient in the Aiuaba Experimental Watershed
Table 1 – Proportions of interception losses from canopy and trunks according to Gash model (1979)
Interception losses Canopy Trunks
Storm sufficient to saturate the canopy or the trunks (1 - p -pt)P' G + (R/E)(P - P' G) St Storm insufficient to saturate the canopy or the trunks (1 - p -pt)P pt • P
of about 6%) are compatible with values found in regions with other types of climate and vegetation, as shown in Figure 2. It was expected that the interception losses in the Caatinga would be of less importance, since the vegetation is characterized as having small leaves, adapting to the environment by reducing the loss of water by transpiration, which should imply a reduced water storage capacity. The high interception losses are possibly due to the elevated evaporation rates in the region, creating a water evaporation-storage cycle during rainy days. Beyond evaporation during a rainfall event, some rain gaps might have occurred and, even though the canopy storage capacity is low (0.5 mm as indicated by Gash model’s parameters estimation), evaporation empties the canopy and makes it possible to intercept more water.
Interception by the litter layer was assessed by two experiments undertaken in November/2004 and February/2005 which showed very similar results, with storage capacity of 1.3 mm and 1.5 mm, respectively. It should be noted that these values are about three times the canopy storage capacity (0.5 mm) estimated in this study for the same region. The litter storage capacity was estimated for a saturation condition, though, which may not occur under natural watering.
The importance of evaporation rate, as well as the precipitation rate, in the interception process in the region was confirmed by a sensitivity analysis of the Gash Model (1979), shown in Figure 3. From the analysis, a 50% variation in the leaves storage capacity (S) or in the trunks storage capacity (St) produces a model estimation error of less than 10%, while a 50% variation in the mean precipitation rate (R) or in the mean evaporation rate (E) results in model estimation errors of at least 30%.
Gash model parameters obtained in this study are shown in Table 2. It can be noted that the parameters estimated for the Aiuaba experimental site are similar to those suggested by Návar et al. (1999) for other semi-arid region, in North-eastern Mexico. This result suggests that the vegetation parameters estimated in this study may be reasonably extrapolated to other semi-arid regions. Nonetheless, mean rainfall rate on the saturated canopy and mean evaporation rate during rainfall should be assessed to local conditions due to model sensitivity to those climatic parameters and their variability for different semi-arid regions (Table 2).
0% 5% 10% 15% 20% 25% 30% 35% 40% 45% 0 500 1000 1500 2000 2500 3000 3500 4000 4500
Mean annual rainfall (mm)
Interceptionlosses(%) Other climate regions Other semi-arid regions This study 1 2 3 4 5 6 7 10 11 12 13 14 15 16 17 18 19 20 21 22 23 24 25 26 27 30 28 29 8 9
1 Arcova et al. (2003) 11 Lima (1998) 21 Scatena (1990) 2 Askad et al. (1998)1 12 Loustau et al. (1992) 22 Singh (1987)1 3 Bruijnzeel and Wiersum (1987)1,2 13 Manfroi et al. (2004) 23 Sinun et al. (1992)1 4 Bruijnzeel and Wiersum (1987)1,2 14 Manokaran (1979)1 24 Valente et al. (1997)2 5 Cantú Silva and Okumura (1996) 15 Mitsudera et al. (1984)1 25 Valente et al. (1997)2 6 Carlyle-Moses (2004) 16 Návar et al. (1999) 26 Veneklaas and Van Ek (1990)1 7 Carlyle-Moses and Price (1999) 17 Opakunle (1989)1 27 Vieira e Palmier (2006) 8 Khan et al. (1999)2 18 Pook and Moore (1991)1,2 28 Wang et al. (2005)2 9 Khan et al. (1999)2 19 Pook and Moore (1991)1,2 29 Wang et al. (2005)2 10 Langkamp et al. (1982)1 20 Pressland (1973)1 30 Yadav and Mishra (1985)1
1
ApudCrockford and Richardson (2000)
2
Two interception values for the same study were obtained from different plant communities or different periods
Figure 2 – Interception losses versus mean annual rainfall
S St R E -50 -40 -30 -20 -10 0 10 20 30 40 50 -50 -40 -30 -20 -10 0 10 20 30 40 50 Parameter variation (%) Estimatedinterceptionlossvariation(%)
Figure 3– Gash model sensitivity analysis of the parameters
1 Apud Crockford and Richardson (2000); 2 Two interception values for the same study were obtained from different plant communities or different periods
The modelling approach fit the observed data well (Figure 4), with cumulative interception losses error of + 9% for the whole period. The model performance was assessed by Nash and Sutcliffe (1970) efficiency coefficient, which resulted in a 0.723 value. Even though it was created for and tested mostly at temperate climate regions, Gash Model performed well in the tropical semi-arid region with Caatinga vegetation.
For the parameterization period between December 2003 and December 2004, application of Gash model resulted in a cumulative error of only + 6%. For the validation period (January 2005 to May 2006), the model overestimated the losses by 12%. This was accomplished even though the periods showed different hydrologic conditions: precipitation during the rainy season for the parameterization period (December/2003 to May/2004) totalled 769 mm, while in 2005 precipitation during the rainy season was 565 mm and in 2006 total rainfall was only 502 mm.
Table 2 – Gash model parameters for the Aiuaba experimental site compared to those by Návar et al. (1999)
Parameter Values for semi-arid regions
Meaning Symbol Unity This study Návar et al. (1999) Free throughfall coefficient p - 0.26 0.15
Canopy storage capacity S mm 0.51 0.46
Proportion of rainfall diverted to stemflow pt - 0.07 0.01
Trunk storage capacity St mm 0.07 0.04
Mean rainfall rate on the saturated canopy R mm h-1 8.69 18.08
Mean evaporation rate during rainfall E mm h-1 1.05 2.52
Rainfall necessary to saturate the canopy P’G mm 0.83 0.60 Rainfall necessary to saturate the trunks P’t mm 1.12 4.30
0 20 40 60 80 100 120 140 160 180 200 220 240
Dec/03 Jan/04 Mar/04 May/04 Jul/04 Sep/04 Nov/04 Jan/05 Mar/05 May/05 Jul/05 Sep/05 Nov/05 Jan/06 Mar/06 May/06
0 20 40 60 80 100 120 140 160 180 200 220 240
Dec/03 Jan/04 Mar/04 May/04 Jul/04 Sep/04 Nov/04 Jan/05 Mar/05 May/05 Jul/05 Sep/05 Nov/05 Jan/06 Mar/06 May/06 Month - year
Measured Modelled
Cumulativeinterceptionloss(mm)
Figure 4 – Cumulative measured and modelled interception losses in the Aiuaba experimental site
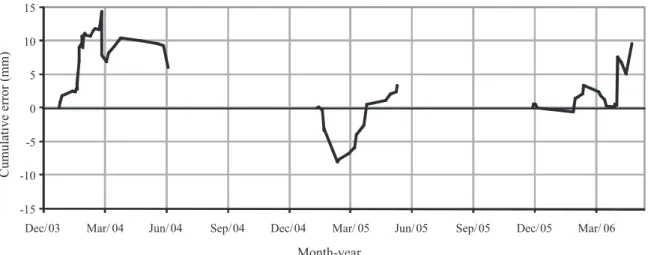
On a daily basis, the model produced significant but not systematic errors, as illustrated in Figure 5, which indicates that, for this temporal scale, the uncertainty is high. It was proved that the lack of leaves at the beginning of the wet period (up to 3 weeks) was not the reason for this inadequate modelling, as shown in Figure 6. It indicates that the accumulated interception losses estimation error does not have a temporal bias: for the first wet period, error after three weeks has a magnitude order of + 10 mm. For the second wet period, it is - 5 mm, whereas for the third wet period it is close to zero.
The events which were imprecisely modelled and that showed high resilience (see Figure 7) were identified and used in establishing a criterion for the Gash model’s applicability on an event basis. The selected events (four) were those whose interception estimation error was greater than the mean daily interception loss (3.3 mm). Therefore, the errors for such events differed from the mean daily
0 2 4 6 8 10 12 14 16 18 20 22 0 2 4 6 8 10 12 14 16 18 20 22
Measured interception loss (mm)
Modelledinterceptionloss(mm)
Figure 5 – Modelled versus measured interception losses in the Aiuaba experimental site (Dec 2003 – May 2006)
Figure 6 – Temporal variation of the cumulative interception losses estimation error in the Aiuaba experimental site (Dec 2003 – May 2006)
Figure 7 – Cumulative interception losses versus precipitation in the Aiuaba experimental site (Dec 2003 – May 2006)
interception loss on at least one order of magnitude. In relation to the measured interception losses, the selected events were modelled with an error greater than 30%.
Total daily rainfall was shown to be insufficient to delimit a threshold value to which Gash model is applicable to the investigation site, as three of the four selected events have total rainfall of the same order of magnitude of seven other events that were adequately modelled by Gash (1979) approach, as illustrated by the histogram of Figure 8.
Considering that the model runs on a daily basis (and therefore it cannot represent the temporal variation of the precipitation during the event), rainfall intensity was selected as the parameter to assess the model applicability.
Figure 8 – Histogram of total rainfall for the rain events modelled with Gash model
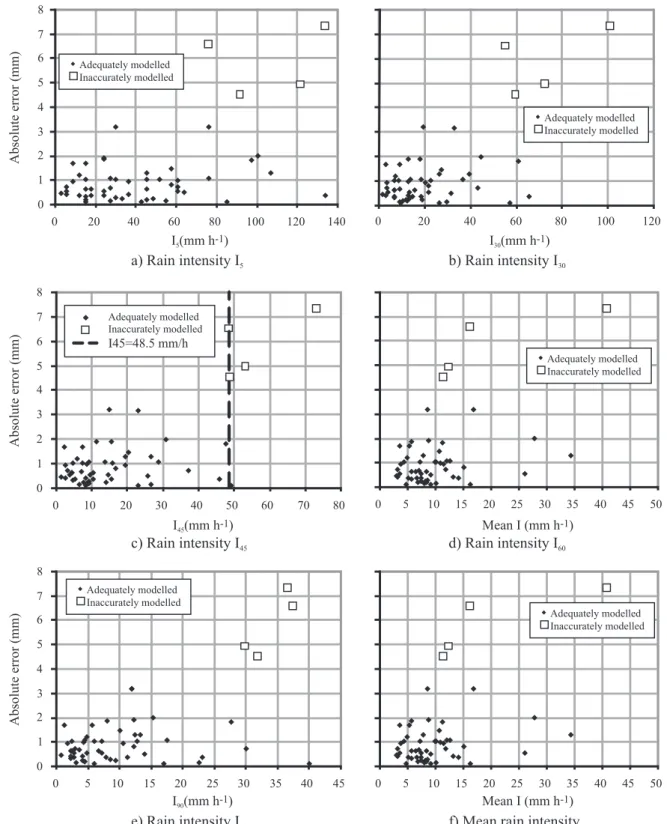
Rainfall intensity was monitored by the climatic station considering the most intense periods of 5 (I5), 30 (I30), 45 (I45), 60 (I60) and 90 (I90) minutes, as well as the mean intensity during the events. From Figure 9 (a – f), a tendency to greater absolute errors related to higher intensities can be detected, although with low correlation. This can be attributed to the fact that rainfall intensity, which is a major factor influencing interception losses, cannot be represented by Gash model, and therefore, for the events with intensity much higher than the mean value used by the model (8.69 mm h-1 in this study), the
modelling result may be of poor quality.
Figure 9 also shows rainfall intensity for the events that were properly modelled and for the four selected ones to which estimated interception error was of importance and showed high resilience. It can be noted that an I45 value of 48.5 mm h-1 separates the events that were modelled
Figure 9 – Absolute error of the Gash model versus rainfall intensity
adequately by Gash Model from those to which the estimated interception loss error was significant, with the exception of one rain event with an I45 value of 49.4 mm h-1, to which the model error estimation was only
1% (0,1 mm).
Based on Nash and Sutcliffe (1970) efficiency coefficient, an event maximum 45-minute intensity (I45) of 48.5 mm h-1 was also established as a good applicability
limit of Gash model for long term simulation in the region. The simulation consisted of varying the I45 limit
and considering only rainfall events that fit the criterion. So, for each simulation, the events that showed higher I45 than that adopted as the limit value were not considered on the simulation. The highest Nash and Sutcliffe efficiency coefficient (0.827), i.e. NSE that indicates the best model performance with Aiuaba data, was accomplished by adopting 48.5 mm h-1 as the limiting I
45 value, as indicated
in Figure 10.
The I45 intensity was found to be a good indicator of Gash model applicability in the study region by a comparative analysis with other durations. No investigation about the processes related to I45 which physically justify this critical duration was carried out. Nonetheless, it should be noticed that the mode of duration of monitored events lies close to 45 minutes.
Conclusions
Measurements in the Aiuaba experimental site from December 2003 to May 2006, indicate that for the 1658 mm of gross precipitation during the monitored period, throughfall, stemflow and interception losses correspond to 81%, 6% and 13% of total rainfall, respectively. Although the vegetation consists of trees and shrubs with small leaves, which implies a reduced water storage capacity, high evaporation rates contribute to interception losses as high as those for regions with different climate and vegetation type.
Gash model performance for the tropical semi-arid region in North-eastern Brazil was assessed for
Figure 10 – Nash and Sutcliffe efficiency coefficient (NSE) for limiting I45 values using data from Aiuaba experimental site (Dec 2003 – May 2006)
long term simulation, showing good agreement with the measured values. Cumulatively, the positive errors were well balanced by the negative ones, with an accumulated error in the estimation of interception losses of +9% for the whole period. Model efficiency was also evaluated by applying Nash and Sutcliffe (1970) coefficient to the data, resulting on a 0.723 coefficient.
On a daily temporal analysis, high variation was observed between measured and modelled interception losses, with 22 of the 66 rain events monitored showing a relative absolute error of over 50%. It was proved that the lack of leaves at the beginning of the wet period was not the reason for this inadequate modelling.
Rainfall intensity was shown to be a good parameter to determine whether an event can be well modelled by Gash Model in the tropical semi-arid research site. The maximum 45-minute rainfall intensity (I45) was shown to be the best predictor of Gash model applicability for the studied region: for I45 lower than 48.5 mm h-1, the model
did apply with good accuracy.
Acknowledgements
The authors would like to thank the Brazilian National Scientific and Technological Development Council - CNPq (MISA Project, process 477906/2003-6) for the support given to the present research and for the scholarship granted to the first author. The authors would also like to acknowledge the German Research Foundation – DFG for the financial support of the SESAM Project.
References
ALBUQUERQUE, S. G. Caatinga vegetation dynamics under various grazing intensities by steers in the semi-arid Northeast, Brazil. Journal of Range Management, v. 52, n. 3, p. 241-248, 1999. ARCOVA, F. C. S.; CICCO, V.; ROCHA, P. A. B. Precipitação efetiva e interceptação das chuvas por floresta de Mata Atlântica em uma microbacia experimental em Cunha – São Paulo. Revista Árvore, v. 27, n. 2, p. 257-262, 2003.
CANTÚ SILVA, I.; OKUMURA, T. Rainfall partitioning in a mixed oak forest with dwarf bamboo undergrowth. Journal of Environmental Hydrology, v. 4, p. 1-16, 1996.
CARLYLE-MOSES, D. E. Throughfall, stemflow and canopy interception loss fluxes in a semi-arid Sierra Madre Oriental matorral community. Journal of Arid Environments, v. 58, n. 2, p. 181-202, 2004.
CARLYLE-MOSES, D. E.; PRICE, A. G. An evaluation of the Gash interception model in a northern hardwood stand. Journal of Hydrology, v. 214, n. 1-4, p. 103-110, 1999.
CROCKFORD, R. H.; RICHARDSON, D. P. Partitioning of rainfall into throughfall, stemflow and interception: effect of forest type, ground cover and climate. Hydrological Processes, v. 14, n. 16-17, p. 2903-2920, 2000.
DUNKERLEY, D. Measuring interception loss and canopy storage in dryland vegetation: a brief review and evaluation of available research strategies. Hydrological Processes, v. 14, n. 4, p. 669-678, 2000.
GASH, J. H. C. An analytical model of rainfall interception by forests. Quarterly Journal of the Royal Meteorological Society, v. 105, n. 443, p. 43-55, 1979.
GÜNTNER, A.; BRONSTERT, A. Representation of landscape variability and lateral redistribution processes for large-scale hydrological modeling in semi-arid areas. Journal of Hydrology, v. 297, n. 1-4, p. 36-161, 2004.
GÜNTNER A. et al. Simple water balance modelling of surface reservoir systems in a large data-scarce semiarid region. Hydrological Sciences Journal, v. 49, n. 5, p. 901-918, 2004. KHAN, M. A. Water balance and hydrochemistry of precipitation components in forested ecosystems in the arid zone of Rajasthan, India. Hydrological Sciences Journal, v. 44, n. 2, p. 149-161, 1999.
LEMOS, J. R. Florística, estrutura e mapeamento da vegetação de Caatinga da Estação Ecológica de Aiuaba, Ceará. 2006. 142 f. Tese (Doutorado em Botânica) – Universidade de São Paulo, SP.
LIMA, P. R. A. Retenção de água de chuva por mata ciliar na região central do Estado de São Paulo. 1998. 99 f. Dissertação (Mestrado em Agronomia) – Universidade Estadual Paulista, SP. LLOYD, C. R.; MARQUES, A. de O. Spatial variability of throughfall and stemflow measurements in Amazonian rainforest. Agricultural and Forest Meteorology, v. 42, n. 1, p. 63-73, 1988.
LOUSTAU, D. et al. Interception loss, throughfall and stemflow in a maritime pine stand. I. Variability of throughfall and
stemflow beneath the pine canopy. Journal of Hydrology, v. 138, n. 3-4, p. 449-467, 1992.
MANFROI, O. J. et al. The stemfow of trees in a Bornean lowland tropical forest. Hydrological Processes, v. 18, n. 13, p. 2455-2474, 2004.
NASH, J. E.; SUTCLIFFE, J. V. River flow forecasting through conceptual models – Part I: A discussion of principles. Journal of Hydrology, v. 10, n. 3, p. 282-290, 1970.
NÁVAR, J.; CARLYLE-MOSES, D. E.; MARTINEZ, M. Interception loss from the Tamaulipan matorral thornscrub of north-eastern México: an application of the Gash analytical interception loss model. Journal of Arid Environments, v. 41, n. 1, p. 1-10, 1999.
RUTTER, A. J. et al. A predictive model of rainfall interception in forests. I. Derivation of the model from observations in a plantation of Corsican pine. Agricultural Meteorology, v. 9, n. 2, p. 367-384, 1971.
SCATENA, F. N. Watershed scale rainfall interception on two forested watersheds in the Luquillo Mountains of Puerto Rico. Journal of Hydrology, v. 113, n. 1-4, p. 89-102, 1990.
VALENTE, F.; DAVID, J. S.; GASH, J. H. C. Modelling interception loss for two sparse eucalypt and pine forests in central Portugal using reformulated Rutter and Gash analytical models. Journal of Hydrology, v. 190, n. 1-2, p. 141-162, 1997.
VIEIRA, C. P.; PALMIER, L. R. Medida e modelagem da intercepção da chuva em uma área florestada na região metropolitana de Belo Horizonte; MG. Revista Brasileira de Recursos Hídricos, v. 11, n. 3, p. 101-112, 2006.
WANG, X. P. et al. Measurement of rainfall interception by xerophytic shrubs in re-vegetated sand dunes. Hydrological Sciences Journal, v. 50, n. 5, p. 897-910, 2005.
WANG, X. P. et al. Water balance change for a re-vegetated xerophyte shrub area. Hydrological Sciences Journal, v. 49, n. 2, p. 283-295, 2004.