Comparação das estimativas da ingestão nutricional obtidas de um inquérito às 24 horas anteriores e de dois inquéritos às 24 horas anteriores
em dias não consecutivos, em idosos
Comparison of the nutritional estimates from one 24-hour recall and two non consecutive 24-hour recalls in elderly
Ana Raquel Oliveira Esteves
Orientada por: Professor Doutor Pedro Moreira
Trabalho de Investigação
1.º Ciclo em Ciências da Nutrição
Faculdade de Ciências da Nutrição e Alimentação da Universidade do Porto Porto, 2012
Resumo
A Autoridade Europeia para a Segurança Alimentar recomenda o uso de pelo menos dois inquéritos em dias independentes para determinar a exposição crónica.
O objetivo deste estudo foi comparar 53 constituintes alimentares, analisados pelo Food Processor SQL®, obtidos de um inquérito às 24 horas anteriores e de dois inquéritos às 24 horas anteriores não consecutivos, em idosos.
Participaram no estudo 127 idosos (92 mulheres), de idade entre 56 e 85 anos.
Foram aplicados os seguintes testes estatísticos: coeficiente de correlação intraclasse que variou de 0,407 para sódio a 0,691 para zinco, depois de ajustados para a energia; teste T de student para amostras emparelhadas ou teste de Wilcoxon; estatística kappa, na qual a maioria das variáveis teve concordância moderada, excetuando a energia proveniente da gordura, gordura total, pré-vitamina A, sódio e colina; percentagem de classificação correta, cujo valor mais baixo foi 52.8%, para gordura total; percentagem de indivíduos mal classificados, cujo valor mais alto foi 5.5% para a proteína; coeficientes de correlação, nos quais todas as variáveis obtiveram bons resultados; gráfico de Bland e Altman para a energia. Todos os testes foram aplicados antes e depois do ajuste para a energia.
Após ajuste para a energia, comparando os resultados de um inquérito com a média dos dois, a concordância e os coeficientes de correlação variaram de moderados a bons para a maioria das variáveis. Além disso, não foram
encontradas diferenças estatisticamente significativas entre as médias de ingestão obtidas pelos dois métodos.
Abstract
The European Food Safety Authority recommends the recall of at least two independent days to determine chronic exposure.
The objective of this study was to compare 53 food constituents, analyzed by the Food Processor SQL®, obtained from one 24hDR and two non consecutive 24hDR conducted under the same conditions, in elderly.
Participants were 127 older adults (92 women) aged 56 to 85 years.
The following statistical tests were applied: intraclass correlation coefficients which ranged from 0,407 for sodium and 0,691 for zinc, after energy adjustment; student T test for paired samples or Wilcoxon’s test; kappa statistics, in which the majority of variables had a moderate agreement, except for energy from fat, total fat, pre-vitamin A, sodium and choline; percentage of correct classification, being 52,8% the lowest value, found for total fat; percentage of gross misclassification, which higher value was 5,5% for protein; correlation coefficients, showing good results for all variables; Bland and Altman plot for energy. All tests were used both before and after adjustment for total energy intake.
After adjusting for total energy intake, comparing the results of a single 24hDR and the mean of two non-consecutive 24hDR, there was a moderate to good agreement and correlation coefficients of almost all variables studied. Furthermore, no significant statistical differences were found when comparing mean intake between the two methods.
Palavras-Chave
Inquérito às 24 horas anteriores; avaliação nutricional; idosos
Keywords
Summary
Abbreviations ... 1
Introduction ... 1
Objective... 2
Population and methods ... 2
Results... 6
Discussion and Conclusions ... 12
Acknowledgements ... 15
Abbreviations
24hDR – Twenty-four hour dietary recall
CIAFEL – Centro de Investigação da Actividade Física, Saúde e Lazer EFSA – European Food Safety Authority
ICC – Intraclass Correlation Coefficient NE – Niacin equivalents
RE – Retinol equivalents TEI – Total Energy Intake
Introduction
The evaluation of nutritional intake in elderly is quite controversial and the question of which is the best method to use is the first to be asked when we address to study this population.
The European Food Safety Authority (EFSA)(1) and Biró et al(2) defend that
the 24hDR may be used in healthy and well-functioning older adults, although Staveren et al(3) concluded that this method was unreliable to be applied in this population.
The 24hDR is a retrospective method used to assess food and beverages intake. In this questionnaire, “respondents are asked to remember and report all the foods and beverages consumed in the preceding 24 hours or in the preceding day”.(4)
The 24hDR is the most recall method used to assess food intake.(1) This method presents important advantages. It does not require literacy of the respondents as it is administered and recorded by a trained interviewer, there is relatively little burden from the respondents, so they will be more willing to participate, the time between the food intake and the record (approximately 24
hours) is little so memory is little affected, also because the recall occurs after the food intake the dietary behaviour is less affected by the assessment method.(4)
To determine acute exposure, EFSA defends that one day 24hDR is sufficient, however, to the estimation of chronic exposure it is recommended the recall of at least two independent days.(1) The application of a 24-hour recall in non-consecutive days is more expensive than the application in consecutive days(1). Studies should address the differences in estimating dietary intake with one 24hDR versus two non-consecutive 24hDR.
Objective
The objective of this study was to compare the nutritional intake from one 24-hour recall (day 1) and two non-consecutive 24-hour recalls (day 1 plus an extra 24-hour recall – day 2) conducted under the same conditions, in elderly.
Population and methods Population: Socio-demographics and anthropometry
Subjects were recruited from participants in the project “Espinho em forma” (a university-based study that promotes leisure physical activity in elderly) that were also participating in a study coordinated by the Centro de Investigação da Actividade Física, Saúde e Lazer (CIAFEL) from Faculdade de Desporto da Universidade do Porto (FADEUP).
There were interviewed a total of 152 subjects but only 127 (92 women) responded to both the 24hDR applied, so these were the ones used in this study.
Data on socio-demographic characteristics was collected in the first interview. Population’s age ranged from 56 to 85, being the mean equal to 69.02 (±6.633) years. In what concerns to professional activity, 80.4% of the individuals are retired and 49.3% have the 4th grade for education. The individual monthly income ranges from 63€ to 3000€, being the mean equal to 572€.
Body weight and height were assessed according to international standards and Body Mass Index (BMI) was evaluated(5). BMI ranged from 17.10 kg/m2 to 40.11 kg/m2, being the mean equal to 29.28 (±4.130) kg/m2; approximately half of the individuals (48%) have a BMI higher than 29 kg/m2, which is considered the cut-off point for overweight by Hajjar at al.(6)
Dietary Intake: The 24-h recall
Food intake was evaluated by 2 non-consecutive, in person, 24-hour recalls. Participants were asked to remember everything they have drunk or eaten as from when they got up one day until they got up the next day.
The first interview was made during the last two weeks of October 2011 and the second one between the last of November 2011 and the first two weeks of January 2012. A statement of consent was signed by each participant along with the first interview.
To determine food portion sizes there were used household measures, parts or multiples of foods that come in natural units and a photo album with 110 coloured photos of raw and cooked foods representing 3 different portion sizes for each food.(7)
The questionnaires were applied by specially trained interviewers to perform this method of assessment.
The conversion of food intake into nutrients [energy (kcal), energy from fat (kcal), energy from saturated fat (kcal), protein(g), carbohydrates (g), fibre (g), soluble fibre (g), monosaccharides (g), disaccharides (g), oligosaccharides (g), total fat (g), saturated fat (g), monounsaturated fat (g), polyunsaturated fat (g), n3 fatty acids (g), n6 fatty acids (g), trans fatty acids (g), cholesterol (mg), water (g), vitamin A ( g of retinol equivalents (RE)), pre vitamin A ( g), vitamin B1, vitamin B2, vitamin B3 (mg of niacin equivalents (NE)), vitamin B6 (mg), vitamin B12 ( g), biotin ( g), vitamin C (mg), vitamin D ( g), vitamin E (mg), folate ( g), vitamin K ( g), pantothenic acid (mg), calcium (mg), chrome (mg), copper (mg), fluorine (mg), iodine ( g), iron (mg), magnesium (mg), manganese (mg), molybdenum ( g), phosphorus (mg), potassium (mg), selenium ( g), sodium (mg), zinc (mg) and choline (mg)] , ethanol (g), caffeine (g) and total food weight (g) was done using the software Food Processor SQL®.(8)
Statistical analysis
Data analysis was performed with the SPSS 19.0. The normality of the distribution of data for nutrient intake was assessed using the Kolmogorov-Smirnov test. Since some distributions were not normal, nutrient values were log-transformed before analysis. For those parameters with a value of zero there was added 0.0001 units to the values originally found, so that logarithmic transformation could be applied. Even after this transformation, some variables kept an abnormal distribution at least in one of the methods (27 out of the 53 studied), so for these we used the original variables and not the transformed ones. All variables were adjusted for total energy intake by applying a linear regression and the residuals method developed by Willet.(9)
Five different approaches for statistical analysis were used, all of them applied both before and after adjustment for total energy intake (TEI): (1) To compare intakes obtained with one or two 24hDR we used the paired samples Student T test (for normal distributions) and the Wilcoxon test (for non-normal distributions); (2) We studied the intraclass correlation coefficients (ICC) between the two questionnaires applied; (3) We categorized individuals in tertiles of intake in each method (one 24hDR and two non-consecutive 24hDR) and we evaluated, with contingency tables, the percentage of correct classification of intake into one tertile, the percentage of gross misclassification (percentage of individuals classified in opposite tertiles by the two methods) and absolute agreement (applying the kappa statistics); (4) We evaluated the correlation coefficients between one 24hDR and two non-consecutive 24hDR, using Pearson’s coefficient for normal distributions and Spearman’s coefficient for non-normal ones; (5) We used the method developed by Bland and Altman(10) to evaluate agreement for energy intake.
For the interpretation of the ICC, we considered that results presented a good consistency when measures were 0.8 or higher(11), however we needed to classify lower values so we considered the following cut-off points: 0-0.2 indicates poor agreement; 0.3-0.4 indicates fair agreement; 0.5-0.6 indicates
moderate agreement; 0.7-0.8 indicates strong agreement; and >0.8
indicates almost perfect agreement.(12) The kappa statistics was interpreted according to Landis and Koch, who considered an excellent agreement for kappa values of 0.75 or higher, intermediate to good agreement for values ranging from 0.40 to 0.75 and poor agreement for values lower than 0,4.(13) As for the
correlation coefficients, they were considered stronger, the closer they were to 1, which represented perfect correlation.(14)
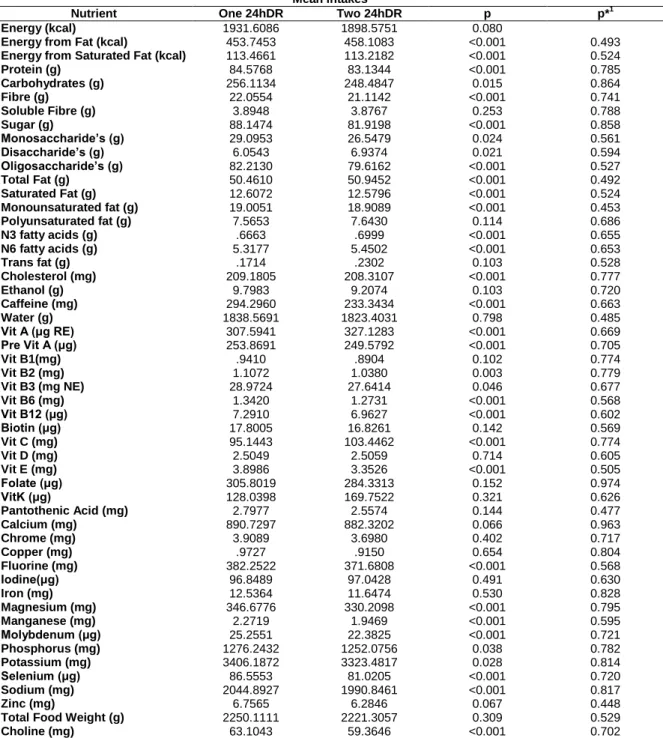
Results Tables below present the results obtained in the various tests applied. Table 1 shows the comparison of means of one 24hDR and the mean of two non-consecutive 24hDR. Before adjustment for TEI, there are 21 variables with p value over 0.05, showing no statistically significant differences between methods. The higher p value found was 0.798 for water and the lower was <0.001 for 26 variables. After energy adjustment, p values ranged from 0.448 for zinc to 0.974 for folate, showing no statistically significant differences between the two methods.
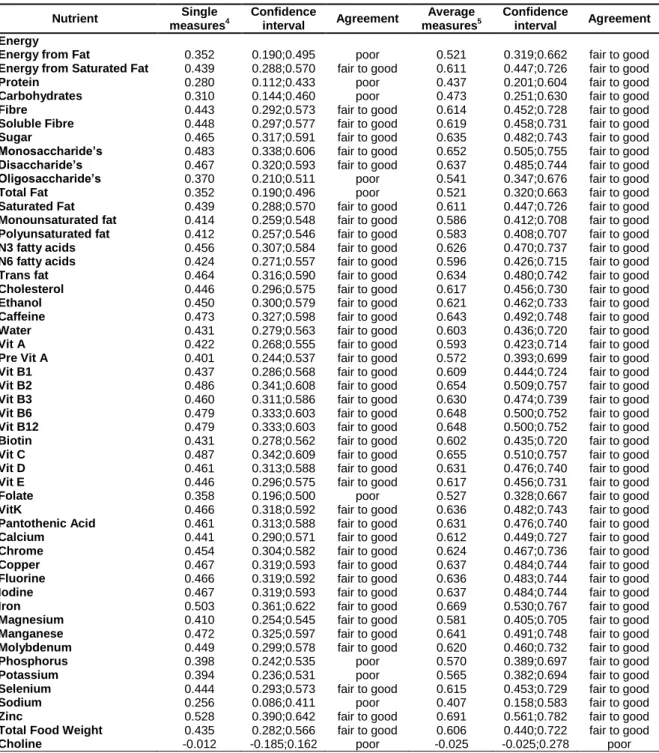
The ICC before adjustment for TEI (Table 2) comparing average measures ranged from -0.031 for trans fatty acids and n3 fatty acids to 0.670 for total food weight, showing fair to good agreement in 17 of all variables studied. After adjustment for total energy intake (Table 3) the ICC for average measures had a lower value of -0.025 for choline and a higher value of 0.691 for n3 fatty acids. This shows a fair to good agreement between methods for all variables, except for choline, which showed poor agreement.
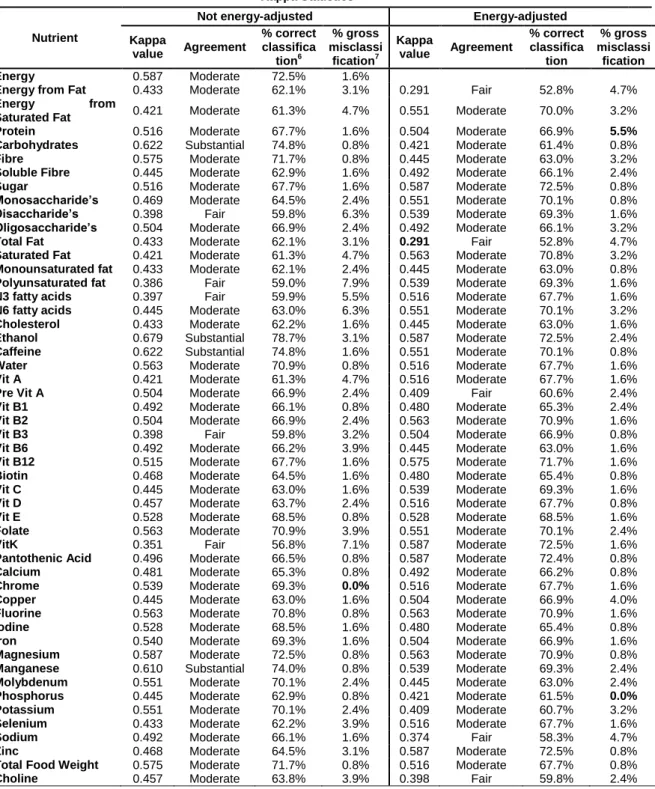
Table 4 shows the kappa statistics, the percentage of correct classification and the percentage of gross misclassification both before and after adjustment for TEI. Before adjustment for TEI, kappa value ranged from 0.351 for vitamin K to 0.679 for ethanol; the percentage of correct classification ranged from 56.8% for vitamin K to 78.7% for ethanol; the percentage of gross misclassification ranged from 0.0% for chrome to 7.9% for polyunsaturated fat. When energy-adjustment was considered, kappa value ranged from 0.291 for energy from fat and total fat to 0.587 for vitamin K, zinc and ethanol; percentage of correct classification ranged
from 52.8% for total fat to 72.5% for sugar, vitamin K, zinc and ethanol; percentage of gross misclassification ranged from 0.0% for potassium to 5.5% for protein.
Table 1- Comparison of mean intake between one 24hDR and two non-consecutive 24hDR
1
Adjusted for energy intake
Mean intakes
Nutrient One 24hDR Two 24hDR p p*1
Energy (kcal) 1931.6086 1898.5751 0.080
Energy from Fat (kcal) 453.7453 458.1083 <0.001 0.493
Energy from Saturated Fat (kcal) 113.4661 113.2182 <0.001 0.524
Protein (g) 84.5768 83.1344 <0.001 0.785 Carbohydrates (g) 256.1134 248.4847 0.015 0.864 Fibre (g) 22.0554 21.1142 <0.001 0.741 Soluble Fibre (g) 3.8948 3.8767 0.253 0.788 Sugar (g) 88.1474 81.9198 <0.001 0.858 Monosaccharide’s (g) 29.0953 26.5479 0.024 0.561 Disaccharide’s (g) 6.0543 6.9374 0.021 0.594 Oligosaccharide’s (g) 82.2130 79.6162 <0.001 0.527 Total Fat (g) 50.4610 50.9452 <0.001 0.492 Saturated Fat (g) 12.6072 12.5796 <0.001 0.524 Monounsaturated fat (g) 19.0051 18.9089 <0.001 0.453 Polyunsaturated fat (g) 7.5653 7.6430 0.114 0.686 N3 fatty acids (g) .6663 .6999 <0.001 0.655 N6 fatty acids (g) 5.3177 5.4502 <0.001 0.653 Trans fat (g) .1714 .2302 0.103 0.528 Cholesterol (mg) 209.1805 208.3107 <0.001 0.777 Ethanol (g) 9.7983 9.2074 0.103 0.720 Caffeine (mg) 294.2960 233.3434 <0.001 0.663 Water (g) 1838.5691 1823.4031 0.798 0.485 Vit A (μg RE) 307.5941 327.1283 <0.001 0.669 Pre Vit A (μg) 253.8691 249.5792 <0.001 0.705 Vit B1(mg) .9410 .8904 0.102 0.774 Vit B2 (mg) 1.1072 1.0380 0.003 0.779 Vit B3 (mg NE) 28.9724 27.6414 0.046 0.677 Vit B6 (mg) 1.3420 1.2731 <0.001 0.568 Vit B12 (μg) 7.2910 6.9627 <0.001 0.602 Biotin (μg) 17.8005 16.8261 0.142 0.569 Vit C (mg) 95.1443 103.4462 <0.001 0.774 Vit D (mg) 2.5049 2.5059 0.714 0.605 Vit E (mg) 3.8986 3.3526 <0.001 0.505 Folate (μg) 305.8019 284.3313 0.152 0.974 VitK (μg) 128.0398 169.7522 0.321 0.626 Pantothenic Acid (mg) 2.7977 2.5574 0.144 0.477 Calcium (mg) 890.7297 882.3202 0.066 0.963 Chrome (mg) 3.9089 3.6980 0.402 0.717 Copper (mg) .9727 .9150 0.654 0.804 Fluorine (mg) 382.2522 371.6808 <0.001 0.568 Iodine(μg) 96.8489 97.0428 0.491 0.630 Iron (mg) 12.5364 11.6474 0.530 0.828 Magnesium (mg) 346.6776 330.2098 <0.001 0.795 Manganese (mg) 2.2719 1.9469 <0.001 0.595 Molybdenum (μg) 25.2551 22.3825 <0.001 0.721 Phosphorus (mg) 1276.2432 1252.0756 0.038 0.782 Potassium (mg) 3406.1872 3323.4817 0.028 0.814 Selenium (μg) 86.5553 81.0205 <0.001 0.720 Sodium (mg) 2044.8927 1990.8461 <0.001 0.817 Zinc (mg) 6.7565 6.2846 0.067 0.448
Total Food Weight (g) 2250.1111 2221.3057 0.309 0.529
Table 2- Intraclass Correlation Coefficients between one 24hDR and two 24hDR, before
adjustment for energy intake
Intraclass Correlation Coefficient (before adjustment for total energy intake)
Nutrient Single measures2 Confidence interval Agreement Average measures3 Confidence interval Agreement
Energy 0.471 0.324;0.596 fair to good 0.640 0.489;0.747 fair to good
Energy from Fat 0.001 -0.173;0.175 poor 0.002 -0.417;0.297 poor
Energy from Saturated Fat 0.006 -0.167;0.18 poor 0.013 -0.402;0.305 poor
Protein 0.007 -0.167;0.18 poor 0.013 -0.402;0.305 poor
Carbohydrates 0.466 0.318;0.592 fair to good 0.636 0.482;0.744 fair to good
Fibre 0.050 -0.125;0.221 poor 0.095 -0.286;0.363 poor
Soluble Fibre 0.365 0.204;0.506 poor 0.535 0.339;0.672 fair to good
Sugar 0.283 0.115;0.435 poor 0.441 0.206;0.606 fair to good
Monosaccharide’s 0.201 0.028;0.362 poor 0.334 0.055;0.531 poor
Disaccharide’s 0.012 -0.162;0.185 poor 0.023 -0.388;0.312 poor
Oligosaccharide’s 0.010 -0.164;0.183 poor 0.019 -0.393;0.309 poor
Total Fat 0.010 -0.164;0.183 poor 0.020 -0.392;0.310 poor
Saturated Fat 0.057 -0.118;0.228 poor 0.107 -0.268;0.371 poor
Monounsaturated fat 0.028 -0.146;0.201 poor 0.054 -0.343;0.334 Poor
Polyunsaturated fat 0.171 -0.003;0.335 poor 0.292 -0.006;0.501 Poor
N3 fatty acids -0.015 -0.189;0.159 poor -0.031 -0.465;0.274 Poor
N6 fatty acids 0.072 -0.103;0.243 poor 0.134 -0.229;0.390 Poor
Trans fat -0.015 -0.188;0.159 poor -0.031 -0.464;0.274 Poor
Cholesterol 0.140 -0.034;0.306 poor 0.246 -0.071;0.469 Poor
Ethanol 0.378 0.219;0.518 poor 0.549 0.359;0.682 fair to good
Caffeine 0.175 0.002;0.339 poor 0.298 0.004;0.506 Poor
Water 0.490 0.346;0.612 fair to good 0.658 0.514;0.759 fair to good
Vit A <0.001 -0.173;0.173 poor <0.001 -0.419;0.295 Poor
Pre Vit A 0.185 0.012;0.347 poor 0.312 0.023;0.515 Poor
Vit B1 0.186 0.012;0.348 poor 0.313 0.025;0.516 Poor
Vit B2 0.223 0.051;0.382 poor 0.364 0.097;0.552 Poor
Vit B3 0.011 -0.163;0.184 poor 0.022 -0.389;0.311 Poor
Vit B6 0.210 0.038;0.370 poor 0.348 0.074;0.541 Poor
Vit B12 0.089 -0.086;0.258 poor 0.163 -0.189;0.411 Poor
Biotin 0.276 0.108;0.429 poor 0.433 0.195;0.601 fair to good
Vit C 0.008 -0.166;0.181 poor 0.015 -0.398;0.307 Poor
Vit D 0.200 0.027;0.361 poor 0.333 0.053;0.530 Poor
Vit E 0.433 0.280;0.564 fair to good 0.604 0.438;0.721 fair to good
Folate 0.002 -0.172;0.176 poor 0.004 -0.415;0.299 Poor
VitK 0.061 -0.114;0.232 poor 0.115 -0.257;0.377 Poor
Pantothenic Acid 0.354 0.192;0.497 poor 0.523 0.322;0.664 fair to good
Calcium 0.462 0.314;0.589 fair to good 0.632 0.478;0.741 fair to good
Chrome 0.197 0.024;0.358 poor 0.329 0.047;0.528 Poor
Copper 0.310 0.144;0.459 poor 0.474 0.252;0.629 fair to good
Fluorine 0.487 0.342;0.609 fair to good 0.655 0.510;0.757 fair to good
Iodine 0.502 0.360;0.622 fair to good 0.669 0.530;0.767 fair to good
Iron 0.226 0.054;0.384 poor 0.368 0.103;0.555 Poor
Magnesium 0.341 0.178;0.486 poor 0.508 0.302;0.654 fair to good
Manganese 0.396 0.239;0.533 poor 0.567 0.385;0.695 fair to good
Molybdenum 0.091 -0.084;0.261 poor 0.168 -0.182;0.414 Poor
Phosphorus 0.350 0.188;0.494 poor 0.519 0.317;0.661 fair to good
Potassium 0.238 0.067;0.395 poor 0.384 0.126;0.566 Poor
Selenium 0.013 -0.161;0.186 poor 0.026 -0.383;0.314 Poor
Sodium <0.001 -0.173;0.174 poor 0.001 -0.419;0.296 Poor
Zinc 0.115 -0.60;0.283 poor 0.206 -0.128;0.441 Poor
Total Food Weight 0.503 0.361;0.623 fair to good 0.670 0.532;0.767 fair to good
Choline 0.158 -0.016;0.323 poor 0.273 -0.033;0.488 Poor
2
Single measures: comparison of the first 24hDR with the second 24hDR
3
Table 3- Intraclass Correlation Coefficients between one 24hDR and two 24hDR, after adjustment
for energy intake
Intraclass Correlation Coefficient (after adjustment for total energy intake)
Nutrient Single measures4 Confidence interval Agreement Average measures5 Confidence interval Agreement Energy
Energy from Fat 0.352 0.190;0.495 poor 0.521 0.319;0.662 fair to good
Energy from Saturated Fat 0.439 0.288;0.570 fair to good 0.611 0.447;0.726 fair to good
Protein 0.280 0.112;0.433 poor 0.437 0.201;0.604 fair to good
Carbohydrates 0.310 0.144;0.460 poor 0.473 0.251;0.630 fair to good
Fibre 0.443 0.292;0.573 fair to good 0.614 0.452;0.728 fair to good
Soluble Fibre 0.448 0.297;0.577 fair to good 0.619 0.458;0.731 fair to good
Sugar 0.465 0.317;0.591 fair to good 0.635 0.482;0.743 fair to good
Monosaccharide’s 0.483 0.338;0.606 fair to good 0.652 0.505;0.755 fair to good
Disaccharide’s 0.467 0.320;0.593 fair to good 0.637 0.485;0.744 fair to good
Oligosaccharide’s 0.370 0.210;0.511 poor 0.541 0.347;0.676 fair to good
Total Fat 0.352 0.190;0.496 poor 0.521 0.320;0.663 fair to good
Saturated Fat 0.439 0.288;0.570 fair to good 0.611 0.447;0.726 fair to good
Monounsaturated fat 0.414 0.259;0.548 fair to good 0.586 0.412;0.708 fair to good
Polyunsaturated fat 0.412 0.257;0.546 fair to good 0.583 0.408;0.707 fair to good
N3 fatty acids 0.456 0.307;0.584 fair to good 0.626 0.470;0.737 fair to good
N6 fatty acids 0.424 0.271;0.557 fair to good 0.596 0.426;0.715 fair to good
Trans fat 0.464 0.316;0.590 fair to good 0.634 0.480;0.742 fair to good
Cholesterol 0.446 0.296;0.575 fair to good 0.617 0.456;0.730 fair to good
Ethanol 0.450 0.300;0.579 fair to good 0.621 0.462;0.733 fair to good
Caffeine 0.473 0.327;0.598 fair to good 0.643 0.492;0.748 fair to good
Water 0.431 0.279;0.563 fair to good 0.603 0.436;0.720 fair to good
Vit A 0.422 0.268;0.555 fair to good 0.593 0.423;0.714 fair to good
Pre Vit A 0.401 0.244;0.537 fair to good 0.572 0.393;0.699 fair to good
Vit B1 0.437 0.286;0.568 fair to good 0.609 0.444;0.724 fair to good
Vit B2 0.486 0.341;0.608 fair to good 0.654 0.509;0.757 fair to good
Vit B3 0.460 0.311;0.586 fair to good 0.630 0.474;0.739 fair to good
Vit B6 0.479 0.333;0.603 fair to good 0.648 0.500;0.752 fair to good
Vit B12 0.479 0.333;0.603 fair to good 0.648 0.500;0.752 fair to good
Biotin 0.431 0.278;0.562 fair to good 0.602 0.435;0.720 fair to good
Vit C 0.487 0.342;0.609 fair to good 0.655 0.510;0.757 fair to good
Vit D 0.461 0.313;0.588 fair to good 0.631 0.476;0.740 fair to good
Vit E 0.446 0.296;0.575 fair to good 0.617 0.456;0.731 fair to good
Folate 0.358 0.196;0.500 poor 0.527 0.328;0.667 fair to good
VitK 0.466 0.318;0.592 fair to good 0.636 0.482;0.743 fair to good
Pantothenic Acid 0.461 0.313;0.588 fair to good 0.631 0.476;0.740 fair to good
Calcium 0.441 0.290;0.571 fair to good 0.612 0.449;0.727 fair to good
Chrome 0.454 0.304;0.582 fair to good 0.624 0.467;0.736 fair to good
Copper 0.467 0.319;0.593 fair to good 0.637 0.484;0.744 fair to good
Fluorine 0.466 0.319;0.592 fair to good 0.636 0.483;0.744 fair to good
Iodine 0.467 0.319;0.593 fair to good 0.637 0.484;0.744 fair to good
Iron 0.503 0.361;0.622 fair to good 0.669 0.530;0.767 fair to good
Magnesium 0.410 0.254;0.545 fair to good 0.581 0.405;0.705 fair to good
Manganese 0.472 0.325;0.597 fair to good 0.641 0.491;0.748 fair to good
Molybdenum 0.449 0.299;0.578 fair to good 0.620 0.460;0.732 fair to good
Phosphorus 0.398 0.242;0.535 poor 0.570 0.389;0.697 fair to good
Potassium 0.394 0.236;0.531 poor 0.565 0.382;0.694 fair to good
Selenium 0.444 0.293;0.573 fair to good 0.615 0.453;0.729 fair to good
Sodium 0.256 0.086;0.411 poor 0.407 0.158;0.583 fair to good
Zinc 0.528 0.390;0.642 fair to good 0.691 0.561;0.782 fair to good
Total Food Weight 0.435 0.282;0.566 fair to good 0.606 0.440;0.722 fair to good
Choline -0.012 -0.185;0.162 poor -0.025 -0.025;0.278 poor
4
Single measures: comparison of the first 24hDR with the second 24hDR
5
Table 4- Kappa Statistics, misclassification and absolute agreement between one 24hDR and two
non-consecutive 24hDR
6
% correct classification: percentage of individuals classified in the same tertile by the two methods
7
% gross misclassification: percentage of individuals classified in opposite tertiles by the two methods
Kappa Statistics
Nutrient
Not energy-adjusted Energy-adjusted
Kappa value Agreement % correct classifica tion6 % gross misclassi fication7 Kappa value Agreement % correct classifica tion % gross misclassi fication Energy 0.587 Moderate 72.5% 1.6%
Energy from Fat 0.433 Moderate 62.1% 3.1% 0.291 Fair 52.8% 4.7%
Energy from
Saturated Fat 0.421 Moderate 61.3% 4.7% 0.551 Moderate 70.0% 3.2%
Protein 0.516 Moderate 67.7% 1.6% 0.504 Moderate 66.9% 5.5%
Carbohydrates 0.622 Substantial 74.8% 0.8% 0.421 Moderate 61.4% 0.8%
Fibre 0.575 Moderate 71.7% 0.8% 0.445 Moderate 63.0% 3.2%
Soluble Fibre 0.445 Moderate 62.9% 1.6% 0.492 Moderate 66.1% 2.4%
Sugar 0.516 Moderate 67.7% 1.6% 0.587 Moderate 72.5% 0.8%
Monosaccharide’s 0.469 Moderate 64.5% 2.4% 0.551 Moderate 70.1% 0.8%
Disaccharide’s 0.398 Fair 59.8% 6.3% 0.539 Moderate 69.3% 1.6%
Oligosaccharide’s 0.504 Moderate 66.9% 2.4% 0.492 Moderate 66.1% 3.2%
Total Fat 0.433 Moderate 62.1% 3.1% 0.291 Fair 52.8% 4.7%
Saturated Fat 0.421 Moderate 61.3% 4.7% 0.563 Moderate 70.8% 3.2%
Monounsaturated fat 0.433 Moderate 62.1% 2.4% 0.445 Moderate 63.0% 0.8%
Polyunsaturated fat 0.386 Fair 59.0% 7.9% 0.539 Moderate 69.3% 1.6%
N3 fatty acids 0.397 Fair 59.9% 5.5% 0.516 Moderate 67.7% 1.6%
N6 fatty acids 0.445 Moderate 63.0% 6.3% 0.551 Moderate 70.1% 3.2%
Cholesterol 0.433 Moderate 62.2% 1.6% 0.445 Moderate 63.0% 1.6%
Ethanol 0.679 Substantial 78.7% 3.1% 0.587 Moderate 72.5% 2.4%
Caffeine 0.622 Substantial 74.8% 1.6% 0.551 Moderate 70.1% 0.8%
Water 0.563 Moderate 70.9% 0.8% 0.516 Moderate 67.7% 1.6%
Vit A 0.421 Moderate 61.3% 4.7% 0.516 Moderate 67.7% 1.6%
Pre Vit A 0.504 Moderate 66.9% 2.4% 0.409 Fair 60.6% 2.4%
Vit B1 0.492 Moderate 66.1% 0.8% 0.480 Moderate 65.3% 2.4%
Vit B2 0.504 Moderate 66.9% 2.4% 0.563 Moderate 70.9% 1.6%
Vit B3 0.398 Fair 59.8% 3.2% 0.504 Moderate 66.9% 0.8%
Vit B6 0.492 Moderate 66.2% 3.9% 0.445 Moderate 63.0% 1.6%
Vit B12 0.515 Moderate 67.7% 1.6% 0.575 Moderate 71.7% 1.6%
Biotin 0.468 Moderate 64.5% 1.6% 0.480 Moderate 65.4% 0.8%
Vit C 0.445 Moderate 63.0% 1.6% 0.539 Moderate 69.3% 1.6%
Vit D 0.457 Moderate 63.7% 2.4% 0.516 Moderate 67.7% 0.8%
Vit E 0.528 Moderate 68.5% 0.8% 0.528 Moderate 68.5% 1.6%
Folate 0.563 Moderate 70.9% 3.9% 0.551 Moderate 70.1% 2.4%
VitK 0.351 Fair 56.8% 7.1% 0.587 Moderate 72.5% 1.6%
Pantothenic Acid 0.496 Moderate 66.5% 0.8% 0.587 Moderate 72.4% 0.8%
Calcium 0.481 Moderate 65.3% 0.8% 0.492 Moderate 66.2% 0.8%
Chrome 0.539 Moderate 69.3% 0.0% 0.516 Moderate 67.7% 1.6%
Copper 0.445 Moderate 63.0% 1.6% 0.504 Moderate 66.9% 4.0%
Fluorine 0.563 Moderate 70.8% 0.8% 0.563 Moderate 70.9% 1.6%
Iodine 0.528 Moderate 68.5% 1.6% 0.480 Moderate 65.4% 0.8%
Iron 0.540 Moderate 69.3% 1.6% 0.504 Moderate 66.9% 1.6%
Magnesium 0.587 Moderate 72.5% 0.8% 0.563 Moderate 70.9% 0.8%
Manganese 0.610 Substantial 74.0% 0.8% 0.539 Moderate 69.3% 2.4%
Molybdenum 0.551 Moderate 70.1% 2.4% 0.445 Moderate 63.0% 2.4%
Phosphorus 0.445 Moderate 62.9% 0.8% 0.421 Moderate 61.5% 0.0%
Potassium 0.551 Moderate 70.1% 2.4% 0.409 Moderate 60.7% 3.2%
Selenium 0.433 Moderate 62.2% 3.9% 0.516 Moderate 67.7% 1.6%
Sodium 0.492 Moderate 66.1% 1.6% 0.374 Fair 58.3% 4.7%
Zinc 0.468 Moderate 64.5% 3.1% 0.587 Moderate 72.5% 0.8%
Total Food Weight 0.575 Moderate 71.7% 0.8% 0.516 Moderate 67.7% 0.8%
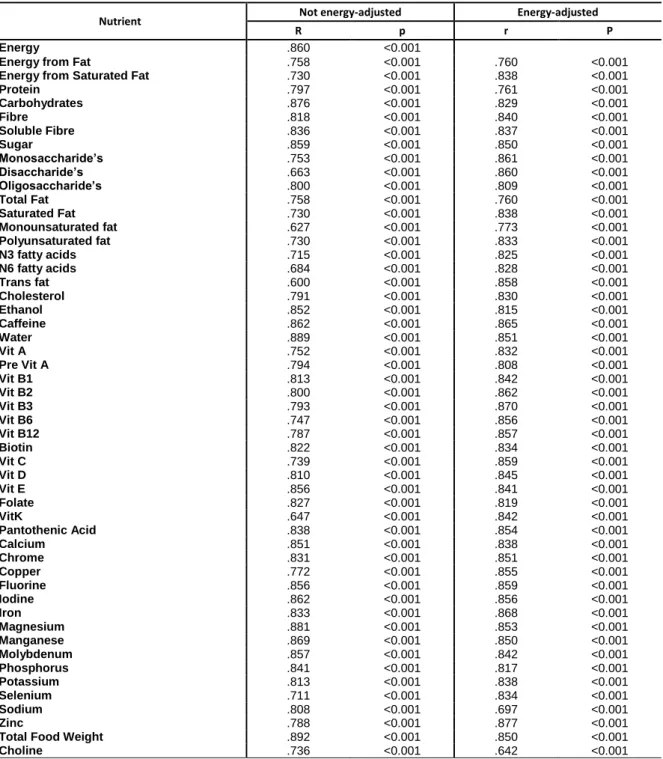
The correlation coefficients obtained are shown in Table 5 before and after energy adjustment. Before adjustment for TEI, coefficients varied between 0.600 for trans fatty acids to 0.889 for water; for energy adjusted variables, coefficients varied from 0.697 for sodium to 0.870 for niacin.
Table 5- Correlation Coefficients between one 24hDR and two non-consecutive 24hDR
Correlation Coefficients
Nutrient Not energy-adjusted Energy-adjusted
R p r P
Energy .860 <0.001
Energy from Fat .758 <0.001 .760 <0.001
Energy from Saturated Fat .730 <0.001 .838 <0.001
Protein .797 <0.001 .761 <0.001 Carbohydrates .876 <0.001 .829 <0.001 Fibre .818 <0.001 .840 <0.001 Soluble Fibre .836 <0.001 .837 <0.001 Sugar .859 <0.001 .850 <0.001 Monosaccharide’s .753 <0.001 .861 <0.001 Disaccharide’s .663 <0.001 .860 <0.001 Oligosaccharide’s .800 <0.001 .809 <0.001 Total Fat .758 <0.001 .760 <0.001 Saturated Fat .730 <0.001 .838 <0.001 Monounsaturated fat .627 <0.001 .773 <0.001 Polyunsaturated fat .730 <0.001 .833 <0.001 N3 fatty acids .715 <0.001 .825 <0.001 N6 fatty acids .684 <0.001 .828 <0.001 Trans fat .600 <0.001 .858 <0.001 Cholesterol .791 <0.001 .830 <0.001 Ethanol .852 <0.001 .815 <0.001 Caffeine .862 <0.001 .865 <0.001 Water .889 <0.001 .851 <0.001 Vit A .752 <0.001 .832 <0.001 Pre Vit A .794 <0.001 .808 <0.001 Vit B1 .813 <0.001 .842 <0.001 Vit B2 .800 <0.001 .862 <0.001 Vit B3 .793 <0.001 .870 <0.001 Vit B6 .747 <0.001 .856 <0.001 Vit B12 .787 <0.001 .857 <0.001 Biotin .822 <0.001 .834 <0.001 Vit C .739 <0.001 .859 <0.001 Vit D .810 <0.001 .845 <0.001 Vit E .856 <0.001 .841 <0.001 Folate .827 <0.001 .819 <0.001 VitK .647 <0.001 .842 <0.001 Pantothenic Acid .838 <0.001 .854 <0.001 Calcium .851 <0.001 .838 <0.001 Chrome .831 <0.001 .851 <0.001 Copper .772 <0.001 .855 <0.001 Fluorine .856 <0.001 .859 <0.001 Iodine .862 <0.001 .856 <0.001 Iron .833 <0.001 .868 <0.001 Magnesium .881 <0.001 .853 <0.001 Manganese .869 <0.001 .850 <0.001 Molybdenum .857 <0.001 .842 <0.001 Phosphorus .841 <0.001 .817 <0.001 Potassium .813 <0.001 .838 <0.001 Selenium .711 <0.001 .834 <0.001 Sodium .808 <0.001 .697 <0.001 Zinc .788 <0.001 .877 <0.001
Total Food Weight .892 <0.001 .850 <0.001
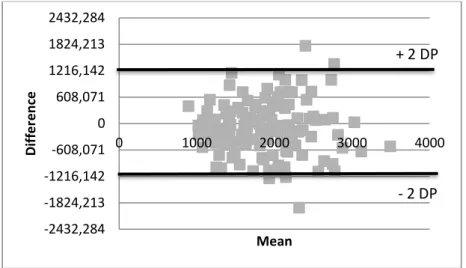
The Bland and Altman plot for energy shows a moderate agreement between the two methods. In Graphic 1 we see that most of the individuals are placed between (-)2 standard deviations and (+)2 standard deviations from the mean.
Graphic 1 – Bland and Altman Plot for energy intake
Discussion and Conclusions
According to our best knowledge, this is the first study that addresses the comparison of nutritional intake obtained with one 24hDR and two non-consecutive 24hDR, in elderly.
The main finding from the present study is that when using one 24hDR or two 24hDR, results may differ particularly for energy from fat, total fat, pre vitamin A, sodium and choline.
Analyzing data from the tables above, we see that, when we compare means, all variables had high p values after adjusting for TEI, showing no differences between the two methods.
-2432,284 -1824,213 -1216,142 -608,071 0 608,071 1216,142 1824,213 2432,284 0 1000 2000 3000 4000 D iff e re n ce Mean + 2 DP - 2 DP
The ICC values obtained before adjustment for TEI show a relatively low degree of agreement between methods. However, after adjusting for this confounder, all of the variables show a fair to good agreement, except for choline.
As for the kappa statistics, percentage of correct classification and percentage of gross misclassification, the adjustment for total energy intake does not have the same effect in all variables studied. Some of the variables improve their degree of agreement while others get worse. The variables that present a decrease in the degree of agreement when energy-adjusted are energy from fat, carbohydrates, total fat, pre-vitamin A, manganese, sodium, ethanol, caffeine and choline. The ones that show an improvement in agreement with energy-adjustment are disaccharides, polyunsaturated fat, vitamin B3 (niacin equivalents), vitamin K and n3 fatty acids. The rest of the variables, even with alterations in the kappa values, kept in the same interval of classification. We eliminated trans fatty acids from this analysis, because the values of intake didn’t allow the division in tertiles. Kappa statistics shows a moderate agreement between the two methods, except for energy from fat, total fat, pre vitamin A, sodium and choline.
The correlation coefficients also had high values for all variables both before and after adjustment for total energy intake.
Studying all the tables obtained from the analysis, we see that the statistical tests applied present different results when evaluating the agreement of the two methods, even if, in general, they show a relatively moderate agreement.
The results of the present study suggest that there are not many differences between the application of one 24hDR and two non-consecutive 24hDR in elderly.
We may also conclude that energy has good results in all the tests, showing that one interview would probably be enough to quantify its intake in elderly. The
same does not apply to the other nutrients because they showed many differences of results in all the tests applied.
The high level of agreement for some variables may have been influenced by the fact that the first day was included in the calculation of the mean of the two days, being used both as the first day of interview and as a contributor for the mean. To overcome this obstacle, we suggest the application of a third 24hDR that would be used to calculate the mean with the second interview. The first day would then be compared with this new variable.
The use of the 24hDR in older people presents some limitations that may have influenced the results of this study. The fact that this method requires the use of recent memory from the respondent may negatively influence energy intake and, consequently, nutrients intake also. A review from Poslusna et al found that respondent’s memory lapses are related to energy misreporting both for under and over reporting.(15)
Furthermore, according to our sample characteristics, energy misreporting might have occurred due to higher number of women, increased age of subjects, low level of education and prevalence of high BMI (15, 16)
There isn’t a gold standard method for evaluating nutritional intake in elderly, however the recommendation is to apply various 24hDR(1). Future studies should assess the differences that may occur in the quality of results obtained with increasing number of 24hDR.
We found no studies that evaluated the differences between the application of one 24hDR and two non-consecutive 24hDR. Being so, we see this paper as a suggestion for further investigation, with a bigger sample size and with different age groups.
Acknowledgements
This study was carried out with the support of FADEUP. Also, we should acknowledge the importance of the participation of the students from FCNAUP and FADEUP that conducted the interviews.
References
1. Authority EFS. General principles for the collection of national food consumption data in the view of a pan-European dietary survey. EFSA Journal. 2009; 7(12)
2. Biró G, Hulshof KFAM, Ovesen L, Cruz JAA. Selection of methodology to assess food intake [Original Communication]. European Journal of Clinical Nutrition. 2002; 56:25-32.
3. Staveren WAv, Groot LCPGMd, Blauw YH, Wielen RPJvd. Assessing diets
of elderly people: problems and approaches. American Journal of Clinical Nutrition. 1994; 59:221-23.
4. Thompson FE, Byers T. Dietary Assessment Resource Manual
[Supplement]. The Journal of Nutrition. 1994; 124:2245-317.
5. Frisancho AR. Anthropometric standards for the assessment of growth and
nutritional status. The University of Michigan Press; 1990.
6. Hajjar R, Kamel HK, Denson K. Malnutrition in aging. The Internet Journal of Geriatrics and Gerontology. 2004; 1(1)
7. Marques M, Pinho O, Almeida MDVd. Manual de quantificação de
alimentos. 1996.
8. Cox K, Golden J, Hohnstein J, King M, Luth J, Mandible D, et al. Food Processor SQL Edition. 10.0.0. Salem, Oregon: ESHA Research; 2006.
9. Willett WC, Howe GR, Kushi LH. Adjustment for total energy intake in epidemiologic studies. The American Journal of Clinical Nutrition. 1997; 65(4 Suppl):1220S-28S.
10. Bland JM, Altman DG. Statistical methods for assessing agreement
between two methods of clinical measurement Lancet. 1986:307-10.
11. Pestana MH, Gageiro Jn. Análise de dados para Ciências Sociais - A complementaridade com o SPSS. 4ª edição ed. Lisboa: Edições Sílabo; 2005. 12. Chang A. Disponível em: http://www.stattools.net/ICC_Exp.php.
13. Landis JR, Koch GG. The measurement of observer agreement for
categorical data. Biometrics. 1977; 33(1):159-74.
14. Guimarães RC, Cabral JAS. Estatística. Amadora: Mc Graw Hill; 1997.
15. Poslusna K, Ruprich J, Vries JHMd, Jakubikova M, Veer Pvt. Misreporting of energy and micronutrient intake estimated by food records and 24 hour recalls, control and adjustment methods in practice. British Journal of Nutrition. 2009; 101(Suppl. 2)
16. Maurer J, Taren DL, Teixeira PJ, Thomson CA, Lohman TG, Going SB, et
al. The Psychosocial and Behavioral Charecteristics Related to Energy Misreporting. Nutrition Reviews. 2006; 64(2):53-56.