Universidade de Aveiro Departamento de Engenharia Mecânica 2015
Carlos Miguel Oliveira
Universidade de Aveiro Departamento de Engenharia Mecânica 2015
Carlos Miguel Oliveira
Rocha
Characterization and application of a
thermoelectric generator
Caracterização e aplicação de um gerador
termoeléctrico
Dissertação apresentada à Universidade de Aveiro para cumprimento dos requisitos necessários à obtenção do grau de Mestrado em Engenharia Mecânica, realizada sob orientação científica de Fernando José Neto da Silva, Professor Auxiliar do Departamento de Engenharia Mecânica da Uni-versidade de Aveiro e de Duncan Paul Fagg, Equiparado a Investigador Principal do Departamento de Engenharia Mecânica da Universidade de Aveiro.
O júri / The jury
Presidente / President Professora Doutora Margarida Isabel Cabrita Marques Coelho
Professora Auxiliar da Universidade de Aveiro
Vogais / Committee Doutor Andrei Kavaleuski
Equiparado a Investigador Principal da Universidade de Aveiro
Professor Doutor Fernando José Neto da Silva
Agradecimentos /
Acknowledgements Dedico este trabalho em especial aos meus pais Américo e Margarida, aosmeus avós e ao resto da minha família por todo o apoio incansável e por acreditarem em mim até ao fim.
Quero também agradecer a todas as pessoas que me acompanharam nesta etapa:
- Ao Professor Doutor Fernando Neto da Silva pela sua orientação, pelo seus ensino e pelo exemplo que é.
- Ao Doutor Duncan Paul Fagg pela sua orientação e pelo conhecimento que me proporcionou.
- Ao Doutor Narendar Nasani pela sua ajuda indispensável. - À Ema Órfão por toda a paciência e apoio.
- Aos meus compadres André Faria, Pedro Alcaide, Pedro Ferreira e Tiago Cappelle pela amizade e apoio.
- Ao Engo André Válega, ao Engo Bruno Abreu, à Inês Matos e ao Engo
Raul Simões pela companhia no trabalho e pela boa disposição. A todos eles um muito obrigado
Palavras-chave seebeck; eficiência; termoelétrico; cogeração; otimização
Resumo Este trabalho é dedicado à caracterização de materiais termoeléctricos, bem como a simulação da sua aplicação e otimização utilizando um modelo matemático. Os geradores termoeléctricos são utilizados com frequência na exploração espacial à várias décadas, no entanto a sua aplicação pode ser alargada à recuperação de gases de escape em automóveis e processos industriais, bem como na alimentação de diferentes tipos de sensores re-motos. No presente trabalho, o material BaGd2N iO5 e seus estados de
dopagem com Ca foram estudados pela primeira vez a nível das suas pro-priedades termoeléctricas tais como coeficiente de Seebeck, condutividade térmica e condutividade eléctrica. Um modelo matemático foi desenvolvido de forma a simular o desempenho da aplicação de um determinado ma-terial termoeléctrico para várias condições de trabalho. Após a validação experimental do modelo, o mesmo foi utilizado para simular o desempenho do composto Ca0.15BaGd1.85N iO5, o qual apresentou as melhores
pro-priedades termoeléctricas. As simulações numéricas permitiram concluir que o desempenho de um gerador termoeléctrico com este tipo de material seria tanto melhor quanto maior for a diferença de temperaturas a que está sujeito e quanto maior for o coeficiente de transferência de calor por con-vecção das fontes quente e fria. A baixa condutividade eléctrica do material Ca0.15BaGd1.85N iO5fez com que a viabilidade da sua utilização apresente
algumas dificuldades uma vez que a sua eficiência será inferior a 1%, sendo a potência produzida igualmente reduzida. Este trabalho permitiu concluir que a dopagem do material BaGd2N iO5 com Ca poderá melhorar as suas
propriedades termoeléctricas, nomeadamente com o aumento da condutivi-dade eléctrica e com a redução da condutivicondutivi-dade térmica. Por outro lado, a otimização da aplicação mostrou ser relevante em termos de aumento do desempenho e redução de material. O modelo matemático permitiu con-cluir que a espessura ótima dos elementos termoeléctricos será tanto menor quanto maior for o coeficiente de transferência de calor por convecção dos fluídos quente e frio. A partir do modelo matemático foi ainda possível con-cluir que um gerador com as propriedades de Ca0.15BaGd1.85N iO5poderia
ter uma grande aplicabilidade e se a sua condutividade eléctrica fosse cem vezes superior ao valor atual.
Keywords seebeck; efficiency; thermoelectric; cogeneration; optimization
Abstract This work is dedicated to the characterization of thermoelectric materials, as well as the simulation of their application and optimization by using a mathematical model. Thermoelectric generators are commonly used in space exploration for many decades, however their application can be ex-tended to the recovery of exhaust gases in automobiles and industrial pro-cesses as well as the powering of different types of remote sensors. In this work, the BaGd2N iO5 material and its doping states with Ca were studied
for the first time in terms of their thermoelectric properties such as Seebeck coefficient, thermal conductivity and electrical conductivity. A mathemat-ical model was also developed to simulate the application performance of any thermoelectric material for various working conditions. After the exper-imental validation of the model it was used to simulate the performance of Ca0.15BaGd1.85N iO5 compound, which presented the best thermoelectric
properties. The numerical simulations showed that the performance of a thermoelectric generator with this material would be as better as larger is the temperature difference that the module is subjected and as greater is the heat transfer from hot and cold sources to the thermoelectric generator. The electrical conductivity of Ca0.15BaGd1.85N iO5 is the main reason for
its low viability since the conversion efficiency was much lower than 1% and the power output was also reduced. This work revealed that the doping of BaGd2N iO5 with Ca can improve its thermoelectric properties, such as the increasing of the electrical conductivity and the reduction of the ther-mal conductivity. Moreover, the optimization of the application showed to be important in terms of increasing the performance and reducing the ma-terial. The mathematical model permitted to conclude that the optimum thickness of the thermoelements will be as smaller as larger is the heat transfer coefficient by convection of the hot and cold fluids. The simula-tions with the mathematical were also useful to conclude that a generator with thermoelectric properties of Ca0.15BaGd1.85N iO5 could have a wide
applicability if its electrical conductivity could be a hundred times greater than the current value.
Contents
I Framework 1
1 Introduction and objectives 3
1.1 Introduction . . . 3
1.2 Objectives . . . 4
2 Literature review 7 2.1 Seebeck effect . . . 7
2.2 Typical materials used in TEGs . . . 8
2.3 Modelling TEG’s performance . . . 9
2.4 Economic considerations . . . 13
II Development 15 3 Concept of Unileg TEG 17 3.1 U-TEG concept . . . 17
3.2 Connector material . . . 18
3.3 Connector bonding . . . 18
3.4 Introduction to CaxBaGd(2-x)NiO5 . . . 19
4 Modeling and Simulation 21 4.1 Model description . . . 21
4.2 Heat exchanger analysis . . . 23
4.3 Geometrical analysis . . . 26
4.4 Materials properties . . . 29
4.5 System thermal analysis . . . 29
4.6 Thermoelement performance . . . 32
5 Experimental methodology 35 5.1 Review of testing technologies . . . 35
5.2 Experimental setup . . . 37
III Results 41 6 CaxBaGd2-xNiO5 characterization 43 6.1 Experimental procedure for samples preparation . . . 43
6.2 Experimental procedure for material characterization . . . 43
6.3 Characterization results . . . 44
7 Model validation 51 7.1 Experimental setup correlation . . . 51
7.2 Model inputs . . . 53
7.3 Results comparison . . . 53
IV Case studies 57 8 Application of the mathematical model 59 8.1 Typical TEG applications . . . 59
8.2 Global application of a Ca0.15BaGd1.85NiO5 U-TEG . . . 60
8.2.1 U-TEG system description . . . 60
8.2.2 Simulation results . . . 61
8.3 Light-duty vehicle application of a Ca0.15BaGd1.85NiO5 U-TEG . . . 67
8.3.1 U-TEG system description . . . 67
8.3.2 Simulation results . . . 69
8.3.3 Optimization suggestions from literature . . . 72
V Conclusions and suggestions for future work 75 9 Conclusions 77 9.1 Material characterization . . . 77
9.2 Modeling and simulation . . . 78
10 Suggestions for future work 79
A Properties fittings 81
List of Tables
2.1 Typical thermoelectric properties from literature materials . . . 9
4.1 Thermal resistance nomenclature . . . 32
6.1 Rietveld refinement results . . . 45
6.2 Geometric densities of each composition . . . 46
7.1 Described measures of the TEG . . . 53
8.1 Vehicle exhaust gases data . . . 67
List of Figures
2.1 Thermoelectric circuit from a thermal dipole . . . 7
2.2 Schematic diagram of a thermocouple . . . 8
2.3 ZT values from literature of n-type (A) and p-type (B) materials . . . 9
2.4 Schematic diagram(a) and equivalent thermal resistance circuit (b) . . . . 11
2.5 Materials cost and figure of merit ZT . . . 13
2.6 Energy recovery years for different generation systems . . . 14
3.1 (a) TEG design, (b) U-TEG design, (c) improved U-TEG design . . . 17
4.1 Schematic diagram of the mathematical model . . . 22
4.2 Flow chart of the model application . . . 24
4.3 Cylindrical leg U-TEG concept . . . 26
4.4 Improved design of a series of thermoelements . . . 26
4.5 U-TEG geometrical nomenclature . . . 27
4.6 Location of the cross sections . . . 27
4.7 Areas of interest in the TE unit . . . 28
4.8 Equivalent thermal circuit scheme . . . 31
5.1 Tunnel vent testing rig scheme . . . 35
5.2 Schematic overview of the test facility . . . 36
5.3 Experimental setup of the thermoelectric generator . . . 36
5.4 Thermoelectric module mounting . . . 37
5.5 Data acquisition module connections . . . 38
5.6 Thermocouple’s auxiliar plate . . . 38
5.7 Full assembly of the experimental setup . . . 39
6.1 Electrical conductivity and Seebeck coefficient measurement setup . . . . 44
6.2 Powder X-ray diffraction patterns . . . 45
6.3 Variation of unit cell volume . . . 46
6.4 Temperature dependence of the Seebeck Coefficient . . . 47
6.5 Temperature dependence of the electrical conductivity . . . 48
6.6 Temperature dependence of the power factor . . . 48
6.7 Temperature dependence of the thermal conductivity . . . 49
6.8 Temperature dependence of the thermal capacity . . . 49
6.9 Temperature dependence of the thermal diffusivity . . . 50
6.10 Figure of merit ZT . . . 50
7.1 Temperature comparison . . . 54 v
7.2 TEG’s thermal resistance comparison . . . 55
7.3 Electrical current and voltage comparison . . . 56
7.4 Power and conversion efficiency comparison . . . 56
8.1 BMW X6 improvements in fuel efficiency with a TEG system . . . 59
8.2 Power output with different fluid temperatures . . . 61
8.3 Conversion efficiency with different fluid temperatures . . . 62
8.4 Parametric study of the convective heat transfer influence . . . 63
8.5 Parametric study of the thickness influence . . . 64
8.6 Optimum thickness trend . . . 65
8.7 Parametric of the electrical conductivity influence . . . 65
8.8 Study of the power cost . . . 66
8.9 Engine energy balance . . . 67
8.10 Fitting of exhaust gases temperature . . . 68
8.11 Fitting of exhaust gases flow rate . . . 68
8.12 Thermoelectric module’s initial performance . . . 69
8.13 Flow channels optimization . . . 70
8.14 Thermoelements thickness optimization . . . 71
8.15 Initial and optimized system comparison . . . 71
8.16 Transverse topology for thermoelectric modules . . . 72
8.17 Optimal coolant flow analysis for a vehicle at 48.3 km/h . . . 73
8.18 Chaos shape heat exchange interface temperature (a) and streamline (b) . 73 A.1 Fitting of air Density . . . 81
A.2 Fitting of air Thermal conductivity . . . 82
A.3 Fitting of air Dynamic viscosity . . . 82
A.4 Fitting of air Prandtl number . . . 83
A.5 Fitting of air Kinematic viscosity . . . 83
B.1 Simulation tool user interface . . . 85
List of Acronyms
EHR Exhaust heat recovery ERY Energy recovery years GHG Greenhouse gases IC Internal combustion
OECD Organisation for Economic Co-operation and Development rpm Rotations per minute
RTG Radioisotope thermoelectric generator TAGS Tellurium - Antimony - Germanium - Silver TE Thermoelement
TEC Thermoelectric cooler TEG Thermoelectric generator U-TEG Unileg thermoelectric generator XRD X-ray diffraction
List of Symbols
Greek letters
– Seebeck coefficient #µV · K≠1$ Difference [≠] Á Emissivity [≠] ÷ Efficiency [%] µ Dynamic viscosity #kg· m≠1· s≠1$ µD Rolling resistance [≠] ‹ Kinematic viscosity #m2· s≠1$ fl Electrical resistivity # · m≠1$ Í Density #kg· m≠3$ ‡ Electrical conductivity #S· m≠1$¨‡ Stefan Boltzmann constant value #W · m≠2· K≠4$ · Thomson coefficient #µV · K≠1$ ‚ Average velocity #m· s≠1$ Ï Thermal diffusivity #J · m≠3· K≠1$
Roman letters
A Area #m2$ a Lattice parameter a ËÅÈ b Lattice parameter b ËÅÈbsf c Brake specific fuel consumption #g· kW≠1· h≠1$
C Perimeter [m]
c Lattice parameter c ËÅÈ
cp Heat capacity #J· kg≠1· K≠1$
D Diameter [m]
Fs Fuel savings ratio [≠]
f Friction factor [≠]
G Geometric length [m]
H Spacing [m]
h Convective heat transfer coefficient #W · m≠2· K≠1$
I Electrical current [A]
K Thermal conductance #W · K≠1$
k Conductive heat transfer coefficient #W · m≠1· K≠1$ ix
L Length [m] m Mass [kg] ˙m Flow rate #kg· s≠1$ N u Nusselt number [≠] P Power output [W ] P F Power factor #W · m≠2· K≠1$ P r Prandtl number [≠] q Thermal power [W ] R Electrical resistance [ ] Ra Raleigh number [≠] Re Reynolds number [≠] S Section area #m2$ T Temperature [K] U Electrical voltage [V ]
v Lattice cell volume ËÅ3È
X Geometric parameter [≠]
x Channel length [m]
Y Electrical resistance ratio [≠]
Z Figure of merit #K≠1$
ZT Absolute figure of merit [≠]
Subscripts
ΠAmbient 1 Hot source 2 Cold source A Additional app Apparent avg Averageb thermoelectric module air gaps
C Cold side
CHP combined heat and power cond Conduction conv Convection D Driveline transmission E0 Initial e Hot fluid eq Equivalent f fuel f l Film G Generator GEN Generated global Global H Hot side
h1 First auxiliary point h2 Second auxiliary point
I Internal i Furnace J Joule j Collector L Load N ET Net oc Open circuit p Collector plate P CU Power control unit rad Radiation
sh Hot channel section
T Thomson
t target
T E Thermoelement
teg Thermoelectric generator
Part I
Framework
Chapter 1
Introduction and objectives
1.1 Introduction
The high price and the increasing consumption of fossil fuels poses an increasing need to change the intensive way in which they are being spent and explored. This change covers both the use of renewable sources in power generation and the efficiency increase of energy conversion.
Road transport is responsible for 72% of the CO2emitted by all transport and 17% of
the total amount of the emitted CO2. These values have been shown to rapidly increase
with non-OECD countries development [1].
There are many efforts to reduce greenhouse gases (GHG) emissions and oil con-sumption from transports in the European Union [2]. In terms of GHG emissions there is a reduction target of 20% from 2008 levels by 2030 and in terms of oil consumption the goal is a 70% reduction by 2050 as compared to 2008 values.
In order to reduce the CO2 emissions from transport sector it is important to
main-tain its usage needs. For example, the substitution of all internal combustion (IC) road vehicles with electric ones would lead to autonomy and drive range problems. On the other hand, the electricity production can be also associated with pollutant emissions, so the electricity usage increasing could lead to environmental problems as well. For these reasons, the actual trend in the transport sector is the improvement of vehicle’s fuel efficiency and the reduction of GHG emissions. It is possible to consider that the main objective is fuel consumption reduction, since it will lead to lower emission values, by means of a higher fuel efficiency.
An internal combustion engine is far from being a perfect machine and has high values of energy losses as heat waste in exhaust gases. In a typical gasoline vehicle about 40% of the fuel energy is wasted from the exhaust pipe and about 30% is lost into the coolant [3]. The partial recovery of that wasted energy would reduce the energy consumption, as seen in turbocharged engines that use a turbine to convert the exhaust gases enthalpy into mechanical work to power the inlet air compressor.
The process of recovering wasted heat from a thermal machine is known as cogen-eration, which is widely used in the industry to improve the efficiency of machines that run on heat generation and which have high power losses by exhaust gases and other heat sinks.
The need to improve the efficiency of heat engines opens a path to the proliferation of thermoelectric generators (TEGs) due to its simplicity and reliability. The TEG
4 1.Introduction and objectives works based on the Seebeck effect, a phenomena discovered by Thomas Seebeck in 1823, that states that when any isolated conducting material is subjected to a temperature gradient it will generate an electrical potential [4]. The electrical voltage generated by the Seebeck effect is given by U = – · T, where – is the Seebeck coefficient and T is the temperature gradient. The Seebeck effect is commonly used in thermocouple thermometers.
Thermoelectric generators have been used for decades in space missions and in remote locations where there is not another possibility of obtaining electrical power, being today an attractive way to recover thermal energy wasted in any heat engine as turbines, internal combustion engines, boilers, etc.. However there is a need to increase TEGs efficiency and reduce their costs in order for they become a viable and competitive generation or cogeneration process.
Some authors claim TEG usage is not competitive yet due its low conversion efficiency [5], that remains in development. The development around thermoelectric generators requires new and better thermoelectric materials as well as adequacy of the design and optimization of the application according to its working conditions.
Actual research is centered in the development of thermoelectric materials able to operate under high temperatures such as exhaust gas temperatures and this work will be another contribution, including an analysis of the applicability and optimization of these systems.
1.2 Objectives
The main objective of this work is the characterization of thermoelectric materials, as well as the simulation of their application and optimization by using a mathematical model.
The first step will be understanding the manufacturing process of a determined ther-moelectric material and the data acquisition of its therther-moelectric properties, such as Seebeck coefficient, thermal conductivity and electrical conductivity.
A new material will be studied in terms of thermoelectric properties in order to give a contribution to the development of thermoelectric materials. Methods to enhance the material’s properties will also be considered.
During this work a recent concept of thermoelectric generator will be approached, the Unileg thermoelectric generator, which can bring some advantages with respect to the TEGs and deserves some attention.
A mathematical model will be developed to simulate a thermoelectric application in different operation conditions, such as a wide range of fluid temperatures and different convective heat transfer coefficients. The model will be used to perform an optimization process in order to increase the generated power and the conversion efficiency.
An experimental setup will be prepared to validate the mathematical model and its results. This comparison will determine the accuracy of the results proposed by the mathematical model.
Two case studies will be performed with the model, one for overall applications and another with a factual application, in particular an automotive thermoelectric integra-tion.
The weight and the specific power are key factors for some TEG applications, for Carlos Miguel Oliveira Rocha Dissertação de Mestrado
1.Introduction and objectives 5 example in the automotive industry and the space exploration, however there has not yet been significant studies on this aspect. The present work will approach this concern during the simulation and optimization of a potential application.
In order to increase the interest in thermoelectrics and their development it is impor-tant to promote their demonstration and the viability of the technology. This work has an additional objective, to explore the thermoelectric applications potential in order to introduce this technology in the automotive sector as well as in industrial applications. Some economic analysis will be made regarding the TEG energy recovery for various kinds of applications.
A proper discussion of the results and the respective conclusions will also be presented at the end of the work.
Chapter 2
Literature review
2.1 Seebeck effect
According to the Seebeck effect, a thermoelectric material has the capability of con-verting a temperature gradient to electrical power. The electrical voltage generated by the effect is given by U = – · T, where – is the Seebeck coefficient, often expressed in micro volts per degree µV · K≠1, and T is the temperature gradient [4].
There is also the opposite of Seebeck effect, known as the Peltier effect, whose purpose is to force a heat flux across the thermoelement (TE) when an electrical current is applied. Peltier effect is applied in thermoelectric coolers (TECs) but this phenomena is also present in TEGs operation.
The thermoelectric materials can be divided in two kinds, the p-type and n-type. A p-type semiconductor is characterized by having a deficiency of electrons (holes) and for generating a positive charge carrier mobility when subjected to a temperature gradient. The opposite occurs with the n-type semiconductor that has an excess of electrons and generates a negative charge carrier mobility when subjected to a temperature difference [6, 7]. Figure 2.1 represents the p-type and n-type behavior when placed between and hot and a cold reservoir.
Figure 2.1: Thermoelectric circuit from a thermal dipole [7]
The connection in series between a p-type and a n-type material can be also called a thermocouple. Generally, many series of thermocouples can be arranged in order to increase the generated electric power, which is the principle of a thermoelectric generator. The usual arrangement of a thermocouple applied to electricity generation is represented in Figure 2.2 that shows a couple of p-type and n-type thermoelements.
8 2.Literature review
Figure 2.2: Schematic diagram of a thermocouple
The operation of a thermoelectric generator can be compared to an heat engine where the electrons and holes work as if they were the operating fluid.
2.2 Typical materials used in TEGs
The Seebeck coefficient –, the electrical conductivity ‡ and the thermal conductivity k can be arranged in a figure of merit Z given by Z = –2 · ‡ · k≠1. A dimensionless
absolute figure of merit ZT can be also used for a given absolute temperature T and it is calculated by ZT = –2 · ‡ · k≠1 · T . The higher the Z value, the greater is the
thermoelectric material’s performance [8], so a good thermoelectric material possesses a high Seebeck coefficient, a high electrical conductivity and a low thermal conductivity. Some authors defend that a ZT greater than 1 is suitable for application [9].
As seen in Figure 2.3, Bi2T e3 alloys are suitable for low temperature applications
once they can achieve a ZT s 1 between 200K and 400K, this is the most common material in commercially available TEGs. For high temperature applications, other kinds of materials are needed, such as ceramics, SiGe alloys, PbTe alloys and TAGS, however these applications remain, to date, poorly explored. The acronym TAGS derived from the name of its constituents: tellurium, antimony, germanium and silver.
The described thermoelectric properties of some typical materials are shown in Table 2.1. They have in common a low electrical resistivity, a low thermal conductivity and a high Seebeck coefficient. In Table 2.1 the electrical behavior is presented as fl, that is the electrical resistivity, the inverse of the electrical conductivity.
PbTe-based alloys are a suitable choice for a temperature range between 500K and 800K and are attractive materials for the automobile industry, space exploration and domestic solutions [8].
2.Literature review 9
Figure 2.3: ZT values from literature of n-type (A) and p-type (B) materials [10] Table 2.1: Typical thermoelectric properties from literature materials [10]
Thermoelectric Material TZT max fl – k
alloy Type (K) (µ · m) (µV · K≠1) (W · m≠1· K≠1) Bi1≠xSbx n 100-150 1.0 -150 3.5 Bi2T e3≠xSex n 250-350 10 -200 1.4 Bi2≠xSbxT e3 p 250-350 8.0 +180 1.3 P b1≠xSnxT e1≠ySey n 650-750 30 -225 1.2 P b1≠xSnxT e1≠ySey p 650-750 50 +260 1.2 T e≠ Ag ≠ Ge ≠ Sb p 675-775 15 +205 1.7 Si0.8Ge0.2 n ≥ 1150 17 -235 3.6 Si0.8Ge0.2 p ≥ 1100 21 +230 4.5
For a higher temperature range, such as between 800K and 1200K, Si0.8Ge0.2 alloys
are the best choice from this typical materials list. SiGe is expected to be stable for over 10 years [11], it can achieve a conversion efficiency of 4.4% and it has special interest in space exploration and in the industrial sector [8]. In fact, SiGe was used to power spacecrafts as Voyager 1 and 2 with a conversion efficiency of 6.7% [12].
2.3 Modelling TEG’s performance
A dimensionless figure of merit ZTavg is used to quantify the TEG conversion
per-formance and is given by Equation 2.1 [13]. ZTavg = –2p,n 1Ò kn ‡n + Òk p ‡p 22 TH+ TC 2 (2.1)
where –p,n is the Seebeck coefficient subtraction between p-type and n-type legs, ‡p
and ‡n are respectively the electrical conductivities of p-type and n-type legs, kp and
ke are the thermal conductivities of p-leg and n-leg respectively, TH is the hot side
10 2.Literature review temperature and TC is the cold side temperature of the TEG. The value obtained by
‡p,n2(Ô‡p+ Ô‡n)2 is also known as power factor, PF.
According to the Equation 2.1, the performance is proportional to the TEG’s average temperature and is mostly affected by the Seebeck coefficient.
The TEG’s conversion efficiency is often estimated using the average absolute figure of merit ZTavg and the temperatures from the cold and hot sides using Equation 2.2 [14].
÷teg= T TH A ZTavg + 1 ≠ 1 ZTavg+ 1 + 1 ≠ THT B (2.2) Lesage and Pagé-Potvin [15] used Equation 2.3 to estimate the power output in terms of the temperature difference and the electrical load resistance
P = RL 3N · T · – p,n RI+ RL 42 (2.3) where N is the number of n-type and p-type couples connected in series, RL is the
electrical load resistance and RI is the internal TEG’s electrical resistance, the sum of
all thermoelements electrical resistance.
In addition to the Joule, Seebeck and Peltier effects, there is also another thermoelec-tric phenomena in TEG’s operation. When a thermoelement is exposed to an electhermoelec-tric current and to a temperature gradient, there is a reversible absorption or liberation of heat known as the Thomson effect which is given by Equation 2.4 [16].
PT = · · I · T (2.4)
where · stands for Thomson coefficient and I for electric current. The Thomson coeffi-cient is difficult to obtain experimentally and its effect is much smaller than the Joule heat effect. For these reasons the Thomson effect is often ignored in the literature, although the Thomson coefficient can be estimated with Equation 2.5.
· = Tavg
d–
dT (2.5)
The electric current is the same along all the thermoelements once they are connected in series. Assuming the same temperature gradient for each TE and an inverse Seebeck coefficient for p-type and n-type legs, the net energy due to the Thomson effect in each thermocouple will be zero.
Thermodynamics and thermoelectric phenomenons can be arranged to calculate the heat amount absorbed by the TEG from the high temperature source qH with Equation
2.6 and the heat amount released to the cold temperature source qC with Equation 2.7.
These equations are often used in the literature [17–21]. Figure 2.4 shows the model schematics and the corresponding equivalent thermal resistance.
qH = h1· F1(TH ≠ T1) = N (q1+ qk≠ 0.5qJ) (2.6)
qC = h2· F2(T2≠ Tc) = N (q2+ qk+ 0.5qJ) (2.7)
where h1 and h2 are the heat transfer coefficients in hot source and cold source and
F1 and F2 are the heat transfer surfaces are in hot-side and cold-side respectively. TH
2.Literature review 11
Figure 2.4: Schematic diagram(a) and equivalent thermal resistance circuit (b) and TC are the high and low temperature heat reservoir respectively. T1 and T2 are the
hot-side temperature and the cold-side temperature of the TEG.
qJ is the Joule heat power in one pair of TE elements when current passes through
it and its given by Equation 2.8.
qJ = I2.R (2.8)
where R is the thermocouple electrical resistance, calculated by Equation 2.9: R= Lp
(‡p· Ap) +
Ln
(‡n· An) (2.9)
where Lp and Ln are the p-type and n-type TEs length, ‡p and ‡n are the electrical
conductivities, Ap and An are the cross sectional areas.
The Peltier effect is given by q1 and q2, which are respectively the heat flux absorbed
from the hot source and the heat flux released to the cold source, calculated by:
q1 = –p,n· I · T1 (2.10)
q2 = –p,n· I · T2 (2.11)
where T1 is the TE’s hot-side temperature and T2 is the cold-side temperature. The
Peltier effect expressions is the same over the literature [16]
Arranging Equation 2.6 and Equation 2.7 with Equations 2.8, 2.10 and 2.11, qH and
qC can be now calculated with Equations 2.12 and 2.13 respectively.
qH = N Ë –· I · T1+ K (T1≠ T2) ≠ 0.5I2· RL È (2.12) qC = N Ë –· I · T2+ K (T1≠ T2) + 0.5I2· RL È (2.13) where K is the thermal conductance and given by k.A≠1.
12 2.Literature review It is important to note that Thomson effect and heat transfer by radiation inside the TEG are ignored.
Finally the electrical power output is given by
P = qH≠ qC (2.14)
and the TEG’s conversion efficiency by
÷= P
qH (2.15)
Alternatively, the electrical power output can be expressed by Equation 2.16 [17]. P = (–p,1≠ –n,1) I · T1≠ (–p,2≠ –n,2) I · T2≠ I2· RL (2.16)
where I is calculated by:
I = –· T
RL+ RI (2.17)
According to some authors the maximum electrical power occurs output when there is a match in load resistance Rload = RT E [17], although others also defend that a slightly
higher resistance will give a better performance [22].
If somehow the thermoelements where subjected to temperatures higher than their maximum acceptable temperature, the maximum allowable heat power crossing the sys-tem could be estimated in order to avoid damages. The maximum heat power can be calculated with Equation 2.18 [23]. Limiting the hot side temperature of the TEG will avoid damages in the system and ensure its durability. Date et al. [23] proposed this precaution for a TEG solar application with a Fresnel lens, however Equation 2.18 can also be applied in any TEG system.
qin = ËR 1 T E NT E + 1 hb·Ab È(Tt≠ T Œ) + ht.At(Tt≠ TŒ) + ¨‡ · Á · At 1 Tt4≠ TŒ42[W ] (2.18) where TŒis the ambient temperature, Ttthe target temperature, h is the convection heat
transfer coefficient, RT E is the thermoelement’s thermal resistance, NT E is the amount
of thermoelements, Á is the emissivity of target surface and ‡ is the Stefan Boltzmann constant. The subscripts b and t stands respectively for the module air gap area and for the outside target area of the module.
There are many simplifying assumptions that can be used in the mathematical model. However any assumption has its associated error. It is important to know the real properties of the thermoelements and the TEG operation conditions in order to do the right assumptions. The most common assumptions found in the literature are:
• Steady state condition [17,24]
• The work of control volume is zero [24]
• Kinetic and potential energy changes are negligible [24] • Specific heat of exhaust gases is temperature-dependent [24]
2.Literature review 13 • Combustion products are assumed as an ideal gas such as air [24]
• The thermal resistance of copper internal connections is ignored [17] • The presence of gas in the gaps is ignored [17]
• There is no contact thermal resistance [17]
• Heat conduction is perpendicular to flow direction, the heat conduction in the axial direction is omitted and the heat radiation is also omitted [17]
• The thermal conductivity of PN unit is constant [17]
• Thomson heat is ignored [17], although it can be significant at high temperatures [16]
• The heat transfer by radiation will be substantial for higher temperatures and it will occur inside the TEG on the empty space between plates [17].
2.4 Economic considerations
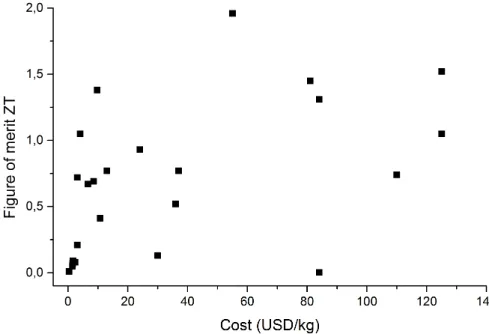
Accordingly to LeBlanc et al. [25], a cheap material with a low ZT value can present a lower e.W≠1 indicator than an expensive material with a high ZT and from their
lit-erature review it was possible to plot the relation between some thermoelectric materials cost and their figure of merit e.W≠1, as shown in Figure 2.5
Figure 2.5: Materials cost and figure of merit ZT
Seijiro Sano et al. [11] presented another relevant economic indicator named as energy recovery years (ERY), the number of the necessary years to generate the amount of energy used to produce the TEG system, where the ERY of a Bi-Te based TEG is 0.85. According to this indicator, the thermoelectric power generation has sufficient Carlos Miguel Oliveira Rocha Dissertação de Mestrado
14 2.Literature review competitiveness when compared to other systems such as photovoltaic, which has almost 10 ERYs, as shown in Figure 2.6.
Figure 2.6: Energy recovery years for different generation systems [11]
In order to get an estimated price of the overall TEG system, the heat sinks and the ceramic plates price can be approximated accordingly to some previous works. The price for the heat sinks can be considered as 20e·m≠2[26]. On the other hand, the overall price
of the heat exchangers and the cermaic plates can be assumed as 188.48e · W≠1· K≠1,
which are the major factors to increase the overall TEG cost [25].
Part II
Development
Chapter 3
Concept of Unileg TEG
3.1 U-TEG concept
A common thermoelectric material requires the usage of two different thermoelectric materials, p-type and n-type, however their temperature behavior can be also different. Couple matching must ensure the materials have similar behavior and this may be diffi-cult to achieve. A different thermal expansion coefficient can lead to high internal stress in the module and different ZT value can decrease the TEG’s overall performance.
The TEG manufacturing can be economically more viable if it depended only on one thermoelectric material. This can be achieved by an unileg concept (U-TEG) as shown in Figure 3.1, which would also reduce the number of electrical contacts in the module. A prototype of one U-TEG module performed a volumetric power density 2.5 times greater than a common TEG [27].
Figure 3.1: (a) TEG design, (b) U-TEG design, (c) improved U-TEG design [27] The U-TEG design is basically the substitution of one thermoelement leg type for a continuous connector, permitting the optimization of the single leg, without being limited by the second one used in the coupling.
18 3.Concept of Unileg TEG
3.2 Connector material
According to previous studies, the materials currently used as connectors are nickel [28], copper [29], platinum [30] and NiCr coated constantan [27]. The connectors must not have influence on the U-TEG performance, so a null Seebeck coefficient would be the ideal scenario. On the other hand the electrical conductivity of the connector will have a great influence on module performance, for example a nickel connector has conductivity 4 times greater than a copper one and the power output will be approximately the double [29].
The conductor oxidation is also a limiting factor for the TEG performance and its stability must be taken into account in order to avoid its oxidation temperature. The oxidation stability of a metal connector exposed to oxygen can be analyzed using the Ellingham diagram, which is a well know tool in the extraction and separation of metal. According to Harold Ellingham, the Elligham diagram shows the variation with the temperature of the standard free energy of formation of oxides and sulphides in a metal [31].
As an example, a connector made of non coated constantan, will start to oxidize at 600K, so its application must be under this temperature in order to avoid the connector oxidation [27]. This means a non coated constantan connector would not be suitable for high temperature applications as 900 ≠ 1200K.
A good connector must have a Seebeck coefficient close to zero, must ideally be a different type from that of the thermoelement, and should offer good electric conductivity and high oxidation temperature.
Noble metals as silver, platinum and gold would be a good choice to use as connectors materials since they are known for their good electrical conductivity, good resistance to corrosion and oxidation and a Seebeck coefficient near to zero [6]. However the best candidate will be silver, since its cheaper than gold and platinum.
3.3 Connector bonding
The U-TEG construction requires a solid union between the ceramic plates, the connectors and the thermoelements. This bond must operate under high temperatures (≥ 1000K), or above the connectors and thermoelements fusion point, otherwise it will limit the module maximum operation temperature.
There are two different bonds, the bonding between the ceramic plate and the con-nector and the bonding between the concon-nector and the thermoelement. In terms of plate-connector bond, it does not require to be electrically conductive, it just need to ensure a solid connection between the plates and the module core. However the connector-thermoelement bond already requires a good electrical conduction to ensure a good electric current flow.
The bonds must provide a good thermal conduction since the thermoelement tem-perature gradient must be maximized. Hence they can also play the role of reducing the thermal contact resistance between the interfaces.
Silver based glues could be a suitable choice for the connectors bonding.
3.Concept of Unileg TEG 19
3.4 Introduction to Ca
xBaGd
(2-x)NiO
5There are various types of materials that have been tested for thermoelectric appli-cations such as Bi2T e3 alloys [8]. However the inability of these material to work at
intermediate temperatures promoted the researchers to search for new type of materials to achieve higher efficiency. In order to manufacture a TEG system able to perform un-der high operation temperatures, the thermoelements are often made of semiconductor materials [6].
The research on oxide thermoelectric materials has been reported from more than 50 years, but the work has been more intense during the past decade [32, 33]. Layered cobaltites, as Ca3Co4O9 and NaCo2O4, showed to be an interesting thermoelectric
ma-terial in terms of high temperature applications since they present a good thermoelectric performance and a low price [34]. Layered cobaltites are also known for be stable at high temperature and to have a environment friendly behavior [35].
The intense research on these ceramic materials led to the discovery and optimization of new compositions [36].
In the pursuit for new materials for thermoelectric applications, rare earth doped bar-ium chain nickelates (BaR2N iO5, R= Gd, Y, Sm) are considered as promising materials
due to their unique structure and thermal and electrical properties [37–41]. Moreover, the chain nickelates have a one dimensional (1D) spin Heisenberg antiferromagnetic character, also called as Haldane gap compounds, that was first discovered by Hal-dane in the BaY2N iO5 system [42]. Among all the chain nickelates, BaY2N iO5 is well
studied in terms of structural, magnetic and electrical properties [37, 38, 43–49]. How-ever, the electrical conductivity of BaY2N iO5 is quite low due to the absence of oxygen
vacancies and conduction occurs only through a thermally activated electron hopping mechanism [38,49]. Nonetheless, the electrical conductivity can be enhanced by doping with alkali elements such as strontium and calcium where they alter the valency of the nickel cation. On the other hand, their stability is uncertain in water and carbon dioxide environments [41,49].
Another interesting material from family of chain nickelates is gadolinium doped bar-ium nickelate (BaGd2N iO5). BaGd2N iO5 is an isostructural material to BaY2N iO5,
of orthorhombic symmetry with space group Immm [50]. The crystal structure of BaGd2N iO5 reveals that it has isolated chains of NiO6 flattened octahedras, BaO10
bicapped quadrangular prisms and GdO7 capped trigonal prisms. Moreover, Infrared
optical spectroscopy and Mossbauer spectroscopy has shown that BaGd2N iO5 first
be-comes antiferromagnetic at T N = 58K and then transforms to a magnetic spin reori-entation at T R = 23K, where the nickel magnetic moments rotate from a-axis toward b-axis [51–53]. Although the magnetic and structural properties of BaGd2N iO5 are
well studied, no electrical and thermal properties are currently available in the litera-ture. The twisted one-dimensional nature, Haldane energy gap and unique structure of BaGd2N iO5 material provided the attraction to study its electrical properties and its
viability towards thermoelectric applications.
In this context, BaGd2N iO5 is chosen for the first time as a possible promising
thermoelectric material for intermediate temperatures and its thermal and electrical properties are mechanistically studied. In this work, the structural, thermal, electrical properties and Seebeck coefficient of undoped and calcium doped BaGd2N iO5 were
also explored in detail. An effort to find a new suitable thermoelectric material for Carlos Miguel Oliveira Rocha Dissertação de Mestrado
20 3.Concept of Unileg TEG applications like an U-TEG.
Due its structure arrangement, BaGd2N iO5 is expected to have a low thermal
con-ductivity, and an improved electrical conductivity with the Ca dopage, hopefully a good candidate for a thermoelectric material.
Chapter 4
Modeling and Simulation
A mathematical model describing the physical phenomena of a determined system is an helpful tool in order to predict its behavior. Its usage is very important in engineering since they can simulate a system operation without the necessity to build it in reality.
Although some resources and processing power are required to prepare and run a mathematical model, its savings will be much more significant with respect to exper-imental testing. A validated mathematical model will prevent unnecessary waste of materials, money and human resources with non viable systems.
In this work, a mathematical model was developed in order to simulate an U-TEG performance subjected to a large range of operation conditions. This permits the study of the viability of any thermoelectric material as well as its best operating conditions.
A mathematical model to simulate an U-TEG system firstly needs to consider the hot and cold sources properties as the temperature and the flow rate in the case of liquid and gaseous sources. The geometry associated with the thermal sources and the thermoelectric generator must also be characterized. On the other hand, it is also necessary to describe the thermal and electric properties of the materials composing the system.
All properties will be intrinsically related so the mathematical model will be very relevant in terms of parametric optimization of the system.
4.1 Model description
The proposed mathematical model is designed to be unidimensional, so the the tem-perature is the same for each studied layer. This means the heat transfer phenomena are perpendicular to the fluids flow directions.
The heat transfer by thermal radiation will be considered since the model can be applied in high temperatures applications.
It is expected to use the model for a wide range of temperatures so the fluids and materials properties will be considered as temperature dependent to avoid highly rough approximations.
Other considerations will be used in order to simplify the mathematical model with-out compromising its reliability. The simplifications include:
• The system works in steady state conditions. 21
22 4.Modeling and Simulation • The flow is fully developed by thermal and hydrodynamic means.
• The work of the control volume is zero.
• Kinematic and potential energy changes are negligible. • The air is considered to be an ideal gas.
• The gaps are assumed to be empty, without gases.
• The contact resistances are assumed to be all equal to a single standard value. • Thomson effect is ignored for being quite small and for not being perpendicular to
the fluids flow directions.
The model can be divided in three input blocks as shown in Figure 4.1, named Heat Exchange Analysis, Geometrical Analysis and Materials Properties. These three blocks are followed by the Thermal analysis and the Thermoelement performance output.
Figure 4.1: Schematic diagram of the mathematical model
4.Modeling and Simulation 23 The Heat exchanger analysis block has the objective to estimate the Nusselt number and the convective heat transfer coefficient of both hot and cold channels. The convection coefficient will be dependent on the exchanger geometry, the fluid Prandtl number and its flow rate or mean velocity.
The Geometrical analysis will give the necessary inputs of lengths and areas for the Thermal analysis and is basically the geometric description of the thermoelectric generator system.
The Materials properties block allows a changeable setup of the temperature depen-dence properties of the used materials, such as thermal conductivity, electrical conduc-tivity, emissivity and Seebeck coefficient.
These three input blocks are correlated to provide the necessary data to perform an intermediary block, the Thermal analysis. After the Thermal analysis the final block named of Thermoelement performance will give the results output as the generated open voltage, power output as well as the element efficiency.
Simultaneously to the model development, a Microsof ExcelTM workbook was made
to run the model accordingly to the chosen inputs, a helpful tool to easily simulate a thermoelectric generator running in a heat harvest application. The user interface of the simulation tool is presented in Appendix B.
Once the materials properties are considered to be temperature dependent and since these are initially unknown, a two variable iteration was performed with the Excel Solver tool in order to perform an automatic simulation method. The proposed convergence factor tends to a value close to zero as the auxiliary temperatures tend to the real value as shown below
(TA≠ Ta)2+ (TB≠ Tb)2 <10≠6 (4.1)
where TA and TB are the hot-side and cold-side auxiliary temperatures. Ta and Tb are
the real temperatures predicted by the model.
The model can be used directly with both cold and hot fluid temperatures and the respective convective heat transfer coefficient to estimate the thermoelectric generator performance.
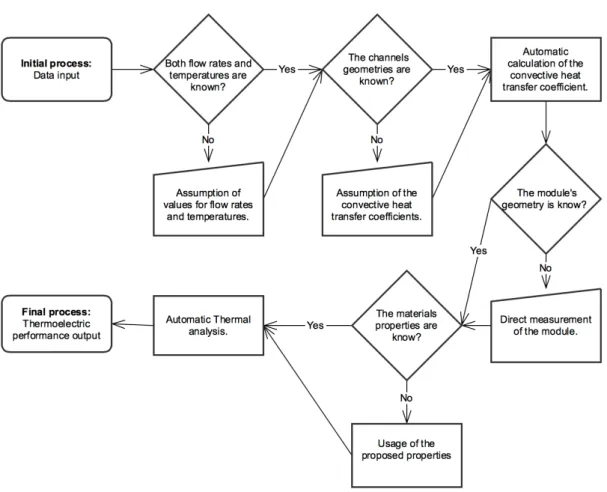
In order to apply the model it is necessary to follow some crucial steps between the first one (gathering all the needed data) until the last one (getting results of the thermoelectric performance). This process is presented in Figure 4.2 as a flow chart.
4.2 Heat exchanger analysis
If the heat transfer from the hot fluid to the thermoelectric generator occurs by forced convection, it is necessary to know the channel geometry and the mass flow rate to achieve the convective heat transfer coefficient, remembering that the gas properties are temperature dependent.
Considering a flow of hot air, fully developed and incompressible, the hot channel Reynolds number is given by
Ree= 4 ˙me
fi· De· µe (4.2)
where ˙me is the hot mass flow rate, µe is the exhaust air dynamic viscosity and De is
the hot channel hydraulic diameter.
24 4.Modeling and Simulation
Figure 4.2: Flow chart of the model application If the channel is not circular, the hydraulic diameter De is given by
De© 4Ash
Ch [m] (4.3)
where Ash and Ch are respectively the hot channel section area and the section wet
perimeter.
Associating Equations 4.2 and 4.8 the Reynolds number can be also calculated by Ree© ˙me· Ch
fi· µe· Ash (4.4)
The Nusselt number can be then calculated with Equation 4.5. This correlation pro-posed by Gnielinski is valid when Prandtl number is between 0.5 and 2000, for Reynolds numbers inferior than 5 ◊ 106 and for a ratio L · D≠1 higher than 10 [54].
N ue= 1f 8 2 (Ree≠ 1000) P re 1 + 12.71f 8 21 2 3 P r23 e ≠ 1 4 (4.5)
4.Modeling and Simulation 25 where P re is the fluid Prandtl number and f is the friction factor of a smooth pipe as
calculated by Equation 4.6.
f = (0.790 ln ·Re ≠ 1.64)≠2 3000 . Re . 5 ◊ 106 (4.6) The convective heat transfer coefficient is finally given by
he©
N ue· ke
De Ë
W · m≠2· K≠1È (4.7)
where ke is the thermal conductivity of the fluid.
The exactly same calculus are applied to the cold flow channel, where the subscript eis substituted by c, standing for the change from hot to cold fluid.
Dc © 4Asc Cc [m] (4.8) Rec © 4 ˙mc fi· Dc· µc (4.9) N uc = 1f 8 2 (Rec≠ 1000) P rc 1 + 12.71f 8 21 23 P r23 c ≠ 1 4 (4.10) hc © N uc· kc Dhc Ë W · m≠2· K≠1È (4.11)
Alternatively, the Reynolds number can be calculated based on the fluid mean ve-locity by
Re= fl· v · D
µ (4.12)
where fl is the fluid density and v is the fluid mean velocity.
The Equations 4.13, 4.14, 4.15 and 4.16 represent respectively the air thermophysic properties depending on its temperature, respectively for the dynamic viscosity (µ), the Prandtl number (P r), the thermal conductivity (k) and the density (fl). The equations were obtained by fitting the values available in the literature for a temperature range between 300 ≠ 1400K [54], which fitting plots are presented in Appendix.
These equations are not very common in the literature. Commonly a constant value is chosen accordingly to the fluid average temperature, however it makes sense to fit the values to a single equation since this mathematical model was designed to be applied in a wide temperature range (300 ≠ 1400K), including a large possibility of common cold and hot sources.
µ= 0.33540+0.00582T ≠2.6497◊10≠6T2+6.4389◊10≠10T3Ë105· kg · m≠1· s≠1È (4.13)
P r= 0.86656≠8.92522◊10≠4T+1.47533◊10≠6T2≠9.85445◊10≠10T3+2.38124◊10≠13T4 (4.14) Carlos Miguel Oliveira Rocha Dissertação de Mestrado
26 4.Modeling and Simulation
k= 0.45046 + 0.79300 ◊ 10≠2T ≠ 1.6028 ◊ 10≠6T2Ë102· W · m≠1· K≠1È (4.15)
fl= 2.1455 ≠ 0.00447T + 3.8132 ◊ 10≠6T2≠ 1.1410 ◊ 10≠9T3Ëkg· m≠3È (4.16)
4.3 Geometrical analysis
The referred thermoelements geometry is cylindrical, since accordingly to previous studies, this geometry presents better performance and lower thermal stress. [55]. For this reason, the geometrical analysis was developed for this type of geometry.
Figure 4.3 shows the cylindrical leg concept applied in the U-TEG, sandwiched in both sides by electrical connectors, ceramic plates and fluid channels walls.
Figure 4.3: Cylindrical leg U-TEG concept
A series connection of many elements is presented in Figure 4.4 accodingly to the U-TEG improved design proposed by Waruna Wijesekara et al. [27].
Figure 4.4: Improved design of a series of thermoelements
This series can be divided in multiply unitary TE units, which will be helpful in order to study U-TEG internal phenomenons and to assign the different geometric variables Carlos Miguel Oliveira Rocha Dissertação de Mestrado
4.Modeling and Simulation 27 as presented in Figure 4.5. Each unitary unit is considered as a parallelepiped with the thermoelement centered on it.
Figure 4.5: U-TEG geometrical nomenclature
Analyzing Figure 4.5 it is possible to conclude that the spacing between two ther-moelements will be two times the Spacing length Gs.
In the case of using a non-cylindrical geometry, as well as a rectangular prism, a correlated diameter can be used to fix the thermoelement section area as shown below
GdÕ =
Û
4AT E
fi [m] (4.17)
where GdÕ is the equivalent diameter and A
T E is the thermoelement section area.
The thermoelement unit can be divided in four different cross sections, which will be helpful to quantify the existing heat transfer phenomenons (Figure 4.6). The respective section views from Figure 4.6 are represented in Figure 4.7, where is possible to see there are eight different areas of interest (S) in the thermoelement unit. These areas will be necessary for Thermal analysis block.
Figure 4.6: Location of the cross sections
28 4.Modeling and Simulation
Figure 4.7: Areas of interest in the TE unit
Section A represents the cross area of both hot-side and cold-side ceramic plates and channel walls, where there is only heat transfer by conduction. This section also represents the thermoelement unit area, which can be used to estimate the number of TEs that can arranged along the heat exchanger available area.
Sections B, D and F are respectively the U-TEG gap areas between the hot-side ceramic plate and the cold-side connector, the two ceramic plates and the hot-side con-nector and the cold-side ceramic plate. These three regions can be used to describe the heat transfer phenomenons on the U-TEG gaps, either by radiation, conduction or convection.
Sections C and G represent the connector cross areas, where heat transfer occurs only by conduction.
Finally, Section E is the thermoelement cross sectioned area, where the heat transfer occurs by conduction.
The respective areas are calculated by the assigned geometrical variables as seen in Carlos Miguel Oliveira Rocha Dissertação de Mestrado
4.Modeling and Simulation 29 Figure 4.5: SA= Gl· Gl Ë m2È SB= 0.5 (SA≠ 2SD≠ SE) Ë m2È SC = SE + SB Ë m2È SD = Gl· Gs Ë m2È SE = 0.25fi · Gd2 Ë m2È SF = SB≠ SG Ë m2È SG= Gd· Gc Ë m2È (4.18)
4.4 Materials properties
Apart from the emissivity and the thermal contact resistance, all other properties were fitted by fifth degree polynomials to describe the thermal conductivity, electrical conductivity and Seebeck coefficient of the materials. Moreover the electrical properties are just required for the thermoelement.
For this work, the flow channels were assumed to be made of stainless steel, with a thermal conductivity of 16W · m≠1· K≠1 for the cold channel wall and 20W · m≠1· K≠1
for the hot channel wall. The connector is assumed to be made of pure platinum, with a thermal conductivity of 140W · m≠1 · K≠1. Since the thermal conductivity of the
alumina plate is sightly sensitive to the temperature, the value will be temperature dependent accordingly to kap= 58.6 ≠ 0.101T + 5.03 ◊ 10≠5T2 for a temperature range
of 200 ≠ 1000K. [54]
The ceramic plates emissivity is considered to be constant at 0.69, the value for 600K. Notwithstanding, its emissivity at 1000K decreases to 0.55 [54]. The thermal contact resistance in two solids interface occurs due to superficial roughness and occurrence of air gaps between them. This resistance can be reduced using indium, lead, tin or silver foil or even using a thermal grease, which have higher thermal conduction than air. The exact resistance value can be only obtained experimentally for each situation, although it can be assumed in order to get a simulation closer to the reality. Based on the values presented in the literature, a stain solder thermal contact resistance is considered as 1.4 ◊ 10≠5m2 · K · W≠1 and a simple contact resistance is considered as
6 ◊ 10≠5m2· K · W≠1 [54].
4.5 System thermal analysis
Analogously to the relation between an electrical resistor and the electrical conduc-tivity, the unidimensional heat transference can be associated with a thermal resistance. The thermal resistances are given by Equations 4.19, 4.20 and 4.21 for heat transfer by conduction, convection and radiation respectively.
Rcond©
T1≠ T2
q =
L
k· A (4.19)
30 4.Modeling and Simulation Rconv© T1≠ TŒ q = 1 h· A (4.20) Rrad © T1≠ Tviz q = 1 hr· A (4.21)
where hr is the radiation heat transfer coefficient given by the following equation for
two infinite parallel planes [54].
hr= ‘ · ¨‡ (T1+ T2) 1
T12+ T222 ËW · m≠2· K≠1È (4.22) The thermal contact resistance between two solids is calculated by
Rtc= Rt,c”
A (4.23)
where Rt,c” is the chosen thermal contact resistance coefficient.
Knowing the system equivalent resistance Reqthe transferred thermal power is given
by
q © T
Req (4.24)
where Req is the system equivalent resistance and is obtained by simplifying the
equiv-alent thermal circuit resistors as if it were an electrical circuit. Figure 4.8 shows the proposed U-TEG equivalent thermal circuit and Table 4.1 contains the respective nomen-clature.
The heat transfer in the U-TEG gaps is approximated to a situation where the connectors thickness is ignored in order to simply the thermal circuit. Without this simplification, the electrical resistances of the equivalent electrical circuit would be ir-reducible as common series and parallel connections. An irir-reducible circuit could be solved by the ≠ Y transform theory [56], however the nodes (temperatures) solutions could be incorrect in terms of heat transference.
Accordingly to the U-TEG equivalent thermal circuit, the corresponding thermal resistance can be finally calculated by
Req = ReqA+ 1
Rrii≠1+ ReqC≠1 2≠1
+ ReqD
ReqA= Rhec+ Rhmc+ Rhmci+ Rhic
ReqB = Rhctc+ Rutc+ Rcctc+ Rccc ReqC = Rhicc+ Rhcc+ 1 ReqB≠1+ Rucc≠1 2≠1 + Rccic
ReqD = Rcic+ Rcimc+ Rcmc+ Rcwc
(4.25)
Using Equation 4.24 it is possible to calculate the thermal power crossing the heat harvesting system knowing the Reqvalue and the hot and cold fluid temperatures, which
will be helpful to obtain an estimated temperature of each point of the system.
4.Modeling and Simulation 31
Figure 4.8: Equivalent thermal circuit scheme
32 4.Modeling and Simulation Table 4.1: Thermal resistors nomenclature
Nomenclature Extended name
Rhec Thermal resistance to hot fluid convection
Rhmc Thermal resistance to hot-side metal conduction
Rhmci Thermal resistance to hot-side metal-isolation contact
Rhic Thermal resistance to hot-side isolation conduction
Rrii Thermal resistance to isolation-isolation radiation
Rhicc Thermal resistance to hot-side isolation-connector contact
Rhcc Thermal resistance to hot-side connector conduction
Rhctc Thermal resistance to hot-side connector-thermoelement contact
Rucc Thermal resistance to U-TEG core connector conduction
Rutc Thermal resistance to U-TEG core thermoelement conduction
Rcctc Thermal resistance to cold-side thermoelement-connector contact
Rccc Thermal resistance to cold-side connector conduction
Rccic Thermal resistance to cold-side connector-isolation contact
Rcic Thermal resistance to cold-side isolation conduction
Rcimc Thermal resistance to cold-side isolation-metal contact
Rcmc Thermal resistance to cold-side metal conduction
Rcwc Thermal resistance to cold fluid convection
4.6 Thermoelement performance
As seen in Equation 2.15 the thermoelement efficiency is given by the ratio between the generated power and the heat absorbed from the hot side. Accordingly to Equations 2.14, 2.12 and 2.17 the efficiency can be rewritten as
÷= –2· T Y R+R 1 1 ≠ R (Y R+R)2 2 –·T1 Y·R+R+ K ≠0.5–· T ·R(Y ·R+R)2 (4.26) where T1 is the hot side thermoelement temperature and Y is the ratio between the load
resistance and the TE resistance Y = RL· R≠1.
The thermoelement’s power output can also be rewritten as P = –
2· T2
(Y · R + R)
3
1 ≠Y · R + RR 4 (4.27)
The U-TEG total power will be proportional to the amount of thermoelements inside it, Ptotal= N · PT E, where N is the TEs quantity.
As seen in Section 2.3, to achieve the maximum power output the load resistance must be equal or slightly higher to the internal generator resistance.
The temperature difference T of the thermoelements can be obtained based on the thermal analysis performed in Section 4.5.
Knowing the fluids temperatures Te and Tc and the system equivalent thermal
resis-tance Req,the transferred heat from the hot source to the heat sink is given by
q = Te≠ Tc
Req [W ] (4.28)
4.Modeling and Simulation 33 In order to simulate the thermoelement performance it is necessary to know the hot-side temperature as well the temperature difference to which it is submitted. As seen in Figure 4.8, the heat flux across the arrangement takes two paths, one by the gaps and another by the connector and the thermoelement, so the first temperature to know is the one after Rhic (Th1) and it is easily acquired by Equation 4.29. Th1 represents the
inner side temperature of the hot-side ceramic insulator plate.
Th1 = Te≠ q (Rhec+ Rhmc+ Rhmci+ Rhic) (4.29)
The second node of interest is Th2, representing the inner side temperature of the
connector stripe, placed after Rhcc and given by
Th2 = Th1≠ (Rhicc+ Rhcc)
q· Rrii
Rrii+ RReqB
(4.30) In order to calculate the thermoelement temperatures it is also necessary to calculate the thermal power crossing it, which is given by
qT E =
q· Rucc· Rrii
(Rrii+ ReqB) (Rucc+ ReqC) (4.31)
The thermoelement temperature difference is finally given by
T = qT E· Rutc (4.32)
On the other hand, the hot-side temperature of the thermoelement is given by T1 = Th2≠ qT E · Rhctc[K] (4.33)


![Figure 5.2: Schematic overview of the test facility [60]](https://thumb-eu.123doks.com/thumbv2/123dok_br/15912097.1092800/61.892.206.663.251.550/figure-schematic-overview-test-facility.webp)


