Ultrasonographic Evaluation of Uterine
Involution in the Early Puerperium
Avaliação ultrassonográ
fi
ca da involução uterina no
puerpério precoce
Juliana Hocevar Kristoschek
1Renato Augusto Moreira de Sá
1,2Fernanda Campos da Silva
3Guillermo Coca Vellarde
11Medical Sciences Post Graduation, Universidade Federal Fluminense,
Niterói, RJ, Brazil
2Clinical Research Unit, Instituto Fernandes Figueira, Fiocruz, Rio de
Janeiro, RJ, Brazil
3Universidade Federal do Estado do Rio de Janeiro (UNIRIO), Rio de
Janeiro, RJ, Brazil
Rev Bras Ginecol Obstet 2017;39:149–154.
Address for correspondence Renato Augusto Moreira de Sá, PhD, Unidade de Pesquisa Clínica–Av. Rui Barbosa 716, Flamengo, Rio de Janeiro, RJ, Brazil (e-mail: [email protected]).
Keywords
►
postpartum period
►
uterus
►
ultrasonography
Abstract
Purpose
Our aim was to describe the changes observed by ultrasonography in uterine
dimensions during the early puerperium among women who experienced an
uncom-plicated puerperium. Additionally, the in
fl
uence of parity, mode of delivery,
breast-feeding and birth weight on uterine involution was evaluated.
Methods
Ninety-one patients underwent an ultrasound examination on days 1 (D1), 2
(D2) and 7 (D7) of the postpartum period. The longitudinal, anteroposterior and transverse
uterine diameters were measured, and the uterine volume was calculated by the formula:
longitudinal diameter (LD) X anteroposterior diameter (APD) X transverse diameter (TD) X
0.45. The thickness and length of the uterine cavity were also measured.
Results
The uterine volume and the LD, APD and TD decreased by 44.8%, 20.9%,
11.8% and 20.0% respectively. The uterine cavity thickness was reduced by 23%, and
the length of the cavity was reduced by 27.2% on D7. Uterine involution was correlated
inversely with parity when the day of the postpartum period was not taken into account
(
p
¼
0.01). However, when the uterine involution was correlated to parity separately,
with D1, D2 or D3, no correlations were found. A signi
fi
cant difference occurred at D2,
when it was found that the uterus had a smaller volume following cesarean section
compared with vaginal delivery (
p
¼
0.04). The high birth weight and breastfeeding
were signi
fi
cantly related to uterine involution (p
0.01 and
p
¼
0.04).
Conclusion
The sonographic evaluation of the uterus in the early puerperium should
consider birth weight, breastfeeding and parity, as well as the delivery route on D2, to
identify abnormalities related to uterine involution.
Resumo
Objetivo
Descrever as alterações observadas pela ultrassonogra
fi
a nas dimensões
uterinas durante o puerpério precoce em mulheres com evolução puerperal não
received May 27, 2016
accepted after revision January 12, 2017
DOIhttp://dx.doi.org/ 10.1055/s-0037-1601418. ISSN 0100-7203.
Copyright © 2017 by Thieme-Revinter Publicações Ltda, Rio de Janeiro, Brazil
Introduction
During the postpartum period, the uterus, which weighs over 1 kg immediately after parturition, undergoes a physiological involution and returns to the non-pregnant condition.1The process of involution, which is one of the main characteristics of the postpartum period, may be affected in pathological conditions such as uterine infection and hemorrhage.1,2Both are main causes of maternal death worldwide; therefore, a correct diagnosis is of paramount importance.1,2
The uterine involution has been previously evaluated with respect to the palpation of the uterine height, which can be difficult in obese women or in those with uterine myoma.1The uterus was one of thefirst organs to be examined by ultraso-nography when ultrasound was introduced into the clinical practice by Donald and his collaborators.2The high-resolution ultrasound equipment that is currently available increases the role of ultrasonography in assessing the normal and abnormal3 puerperal dynamics. Ultrasonography is a non-invasive, low-cost technique that is well accepted by patients.2
There is no consensus in the literature regarding the influence of some factors, such as parity,4–10
breastfeed-ing5–8,10and birth weight,5,6,8,10on uterine involution. It is
important to know the normal ultrasonographic involution of the uterus during the postpartum period to improve our ability to distinguish the pathological from the normal puerperium and thereby avoid unnecessary invasive proce-dures. Furthermore, the knowledge obtained from ultraso-nographic examinations can help us better understand the physiology of the postpartum period. The postpartum period has been arbitrarily divided into the immediate puerperium, or thefirst 24 hours after parturition; the early puerperium,
which extends until the first week postpartum; and the remote puerperium, which includes the period of time required for involution of the genital organs and return of menses, usually6 weeks.
The aim of this study was to describe the changes in the uterine dimensions using ultrasound in the early puerperium following cesarean section or vaginal birth among women delivering term singleton infants who experienced an uncom-plicated postpartum period. A secondary objective was to assess the influence of parity, mode of delivery, breastfeeding and birth weight on uterine involution according to the time at which it was assessed.
Methods
Ninety-one puerperal women who delivered singletons at term at Hospital Universitário Antonio Pedro and Materni-dade Municipal Alexander Fleming in the city of Rio de Janeiro, Brazil, were invited to participate. The Committee of Ethics in Research from Universidade Federal Fluminense approved this study. All the subjects received and signed the free and informed consent form. The exclusion criteria were the presence of postpartum infections (surgical wound or endometritis) or placental remains.
The patients underwent pelvic (transvaginal and trans-abdominal) ultrasound evaluations on days 1 (D1), 2 (D2) and 7 (D7) of the postpartum period. The ultrasound equip-ment used was Sonoace 8000 EX prime (Medison, Seoul, Seoul, South Korea) with a 3.5-MHz convex transducer. The examinations included the assessment of: the longitudinal, anteroposterior and transverse uterine diameters; the
complicada, considerando a in
fl
uência da paridade, tipo de parto, amamentação e peso
ao nascer sobre a involução uterina.
Métodos
Noventa e uma pacientes foram submetidas a exame ultrassonográ
fi
co nos
dias 1 (D1), 2 (D2) e 7 (D7) do puerpério. Os diâmetros uterinos longitudinal,
anteroposterior e transversal foram medidos, e o volume uterino foi calculado pela
fórmula: diâmetro longitudinal (DL) X diâmetro anteroposterior (DAP) X diâmetro
transverso (DT) X 0,45. A espessura e comprimento da cavidade uterina também foram
medidos.
Resultados
O volume uterino e o DL, DAP e DT diminuíram 44,8%, 20,9%, 11.8% e
20,0% respectivamente no D7. A espessura da cavidade uterina reduziu em 23%, e o
comprimento da cavidade foi reduzido em 27,2% no D7. A involução uterina se
correlacionou inversamente com a paridade quando o dia do puerpério não foi levado
em conta (
p
¼
0,01). Uma diferença signi
fi
cativa foi encontrada em D2, quando se
veri
fi
cou que o útero tinha um volume menor no grupo submetido a cesariana em
comparação com o parto vaginal (
p
¼
0,04). O peso ao nascer elevado e amamentação
apresentaram relação estatisticamente signi
fi
cativa com a involução uterina (p
0,01
e
p
¼
0,04).
Conclusão
A avaliação ultrassonográ
fi
ca do útero no puerpério precoce deve
consi-derar o peso ao nascer, a amamentação e a paridade, assim como a via de parto no D2,
para a identi
fi
cação de anormalidades relacionadas à involução uterina.
Palavras-chave
►
período pós-parto
►
útero
uterine volume (by the formula: longitudinal diameter (LD) X anteroposterior diameter (APD) X transverse diameter (TD) X 0.45); and the thickness and length of the uterine cavity. The patients were asked whether they were breastfeeding. Birth weight, mode of delivery and parity were obtained from the obstetric records.
All of the examinations were performed by a single researcher directly involved in the project. Data were ana-lyzed with the statistical analysis program S-Plus 8.0 (Solu-tion Metrics, Sydney, Australia). The studied parameters underwent a descriptive analysis, and the results were ex-pressed as the mean and standard deviation (SD). Parametric and nonparametric mean comparison tests were used (anal-ysis of variance [ANOVA] and Spearman’s rank correlation coefficient).
The authors declare no conflict of interest.
Results
Ninety-one puerperal women underwent pelvic ultrasono-graphic examinations on D1 and D2, and 57 women also had an exam on D7 (total of 239 assessments). The mean
age was 24 years (range 13–41 years). The most prevalent self-reported skin color among the patients was racially mixed (n¼43), followed by women who reported being white (n¼26), and the less prevalent, who reported being black (n¼22). Thirty-seven women were primiparous, 24 were secundiparous, and 30 had had 3 or more parturitions. The average number of children was 2.3. Fifty-four deliveries were vaginal, and 37 deliveries were by cesarean section. The average birth weight was 3,184 g (range 2,125–4,320 g); 20 infants weighed more than 3,500 g, and only 10 weighed less than 1,500 g. Most puerperal women (n¼80) reported breastfeeding.
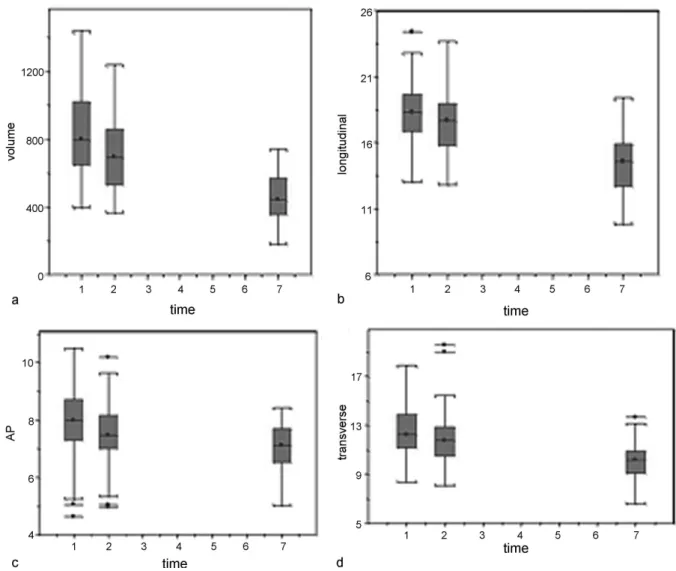
►Fig. 1illustrates the variations in the uterine volume and diameter for each day of the postpartum period evaluated; ANOVA was conducted, and a boxplot is displayed. a) In the first postpartum week, the mean uterine volume was decreased by 44.8%, corresponding to a reduction from 840 cm3 on D1 to 463 cm3 on D7. From D1 to D2, the
mean uterine volume decreased less (from 840 to 717 cm3,
corresponding to 14.6%). b) The mean uterine longitudinal diameter was 18.3 cm on D1. It decreased by 3.9% on D2 to an average of 17.6 cm, and it decreased by 20.9% on D7 to an
Fig. 1 Boxplot of the observed values of the uterine dimensions on D1, D2 and D7:(a)uterine volume (cm3);(b)longitudinal diameter (cm);
average of 14.5 cm. c) The uterine anteroposterior diameter decreased by 5.5% from D1 to D2, corresponding to an average change from 8.0 to 7.6 cm. Reductions in size were maintained until D7, when the average was 7.1 cm, corre-sponding to a reduction of 11.8%. d) The uterus transverse diameter was 12.5 cm on D1. The average diameter was 11.8 cm on D2, which represented a decrease of 5.1%, and the average was 10.1 cm on D7, which represented a decrease of 20.0%.
The variations in the dimensions of the thickness and length of the uterine cavity during the study period were also verified. a) In thefirst week postpartum, the uterine cavity thickness decreased by 23%; the average thickness decreased from 0.7 cm on D1 to 0.57 cm on D7. b) The uterine cavity length decreased by 27.2% during the same period; the average length decreased from 13.4 cm on D1 to 9.7 cm on D7.
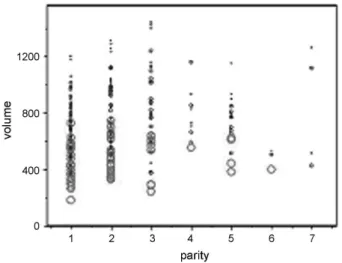
When the factors that could influence the uterine involu-tion were analyzed, it was found that parity, regardless of the postpartum day, was significantly correlated (p¼0.01) with uterine involution. Spearman’s rank correlation coefficient confirmed a direct correlation between parity and uterine volume, although it was weak (r¼0.16) (►Fig. 2). However, no significant differences were found from the parity analyses when the time from birth was taken into account. The significance of the influence of parity on the uterine volume, regardless of time, resulted in an analysis of the overlapping regions that can be observed in►Fig. 3. When the values obtained on D1, D2 and D7 are plotted on this graph, it is possible to observe a tendency to form an ascendant line, parallel to the axis of parity, on D1, D2 and D7; when analyzed separately, no such relation was found. Positive correlations were found among birth weight (p0.01), breastfeeding (p¼0.04) and uterine volume at all of the periods studied.
►Table 1presents the analysis of the effect of the delivery mode on uterine involution according to time. Vaginal deliver-ies and deliverdeliver-ies by cesarean section yielded similar uterine volumes. The only significant difference occurred on D2, when the uterine volume was found to be smaller in women who underwent delivery by cesarean section (p¼0.044).
Discussion
Since the introduction of ultrasonography into the obstetric practice,2 performing non-invasive investigations of the uterus was made possible.5Several authors have examined the uterus by ultrasonography after vaginal births. Sokol et al11performed ultrasound exams 48 hours after vaginal birth. Edwards and Ellwood12 evaluated 40 patients on postpartum days 7, 14 and 21, and Al-Bdour et al8evaluated women on postpartum days 1, 7, 14, 28 and 56. Defoort et al7 performed ultrasound examinations in thefirst 24 hours after vaginal birth, and found a significant correlation be-tween parity and uterine involution. Many authors evaluated uterus involution after birth using a three-dimensional (3D) ultrasound. Belachew et al13studied using the transabdo-minal ultrasound on days 1, 7 and 14, and the transvaginal ultrasound on days 28 and 56 postpartum in 63 women after spontaneous delivery. The median uterine volume decreased from 756 cm3on day 1 postpartum to 440 cm3on day 7. The
mean uterine volume was decreased by 41.8%, and these results are similar to our data. Wataganara et al14found a high correlation between two-dimensional (2D) and 3D ultrasound estimations of the uterine volume.
When we analyzed the influence of parity on the uterine volume, we found a significant direct correlation (p¼0.01),
Fig. 2 Correlation between parity and uterine volume (cm3), without taking the examination time into consideration (ANOVA:p¼0.01; Spearman’s rank correlation coefficient: r¼0.16).
Fig. 3 Correlation between parity and uterine volume (cm3) at overlapping times (D1, D2 and D7). D1 is expressed as small blue circles, D2 is expressed as medium blue circles, and D3 is expressed as red circles.
Table 1 Effect of delivery mode on uterine involution according to day (Student’s t test)
n Day Vaginal deliveries (mean uterine volume)
Cesarean section (mean uterine volume)
p
91 D1 852.6 814.1 0.477
91 D2 754.4 663.0 0.044
regardless of the examination time. When the analysis of the effect of parity on the uterine volume was performed accord-ing to the examination time (D1, D2, and D7), no significant correlation was found at any of the studied times, which is similar to the results from the literature. Belachew et al13also found no significant difference (D1 and D7) using the VOCAL imaging program (3D ultrasound technology). When we dis-regard the influence of the examination time in the analysis, an increase in parity is correlated with larger uterine volumes, unlike when we evaluate each period of time separately. Parity was not significantly correlated with the uterine volume. Wataganara et al14considered the uterinevolume to be independent of parity
Diniz et al15performed abdominal ultrasound evaluations during thefirst 48 hours after childbirth. The mean volume of the uterus was greater than our results when we compare with D2.
The mode of delivery was analyzed by Negishi et al,16who evaluated 319 puerperal women after vaginal birth and 72 after cesarean section, and found larger uterine volumes after cesarean section. However, the results were not statistically significant. Koskas et al17 postulated that dis-crepancies between uterine measurements can occur due to the differences among the surgical techniques and the doses of oxytocin given following a cesarean section, which can be different than those given to patients following a vaginal birth. Bae et al18evaluated uterine involution 2 and 6 weeks postpartum. They showed differences in relation to delivery mode and gestational age at delivery.
When evaluating birth weight, we observed a significant direct correlation with the uterine volume (p<0.01), regardless of the examination time. Buisson et al,19 Wachs-berg et al,10Mulic-Lutvica et al,5and Al-Bdour et al8did not find this correlation. Rodeck and Newton6found a significant correlation between the birth weight and the uterine cavity length on thefirst postpartum day, but only among secun-diparous women.
A significant direct correlation was found between breast-feeding and the uterine volume (p¼0.04), regardless of time, although the number of puerperal women who reported exclusive breastfeeding (80) was much higher than the num-ber of women who reported other breastfeeding practices (11), which prevented a meaningful statistical analysis. Ne-gishi et al16analyzed non-exclusive breastfeeding. They did notfind significant differences in the size of the uterus one month after vaginal birth among women with breastfeeding rates of 80% per day (infants required complementary feeding with non-breast milk sources until 20% of daily energy expen-diture) and in women with breastfeeding rates of 20% per day. However, the longitudinal and anteroposterior diameters 3 months after delivery in women with breastfeeding rates of 80% were lower than those in women with breastfeeding rates of 20%. Rodeck and Newton,6Defoort et al,7Buisson et al,19Wachsberg et al,10Mulic-Lutvica et al,5Sokol et al11and Wataganara et al14 considered the uterine volume to be independent of breastfeeding.
The major difficulty in conducting this study was the limited number of measurements made on D7. Long
distances between the homes of some women and the place where the examinations were performed, as well as the demands of childcare, were the main causes of the non-attendance on the last day of examinations.
Although there is no consensus in the literature regarding the influence of factors such as parity, breastfeeding and birth weight on the process of uterine involution, knowledge of the normal ultrasound changes of the uterus during the postpar-tum period is a prerequisite for the ultrasound diagnosis of pathological conditions. Ultrasound is a low-cost and painless diagnostic tool that is easily accessible to the population. It may provide a best quality of health assistance for women if it is available to clarify many puerperal abnormalities.18Ideally, each obstetrics service would have its own reference curve with values corresponding to its own patients. Medical care for pregnant women does not end with parturition, as care during the puerperium represents a good indicator of the life and health quality of a population.
References
1 Beazley JM, Underhill RA. Fallacy of the fundal height. BMJ 1970;4 (5732):404–406
2 Donald I, MacVicar J, Brown TG. Investigation of abdominal masses by pulsed ultrasound. Lancet 1958;1(7032):1188–1195 3 Almeida CM. Curva da involução uterina no puerpério normal por
ultrassonografia [dissertação]. Campinas: Universidade Estadual de Campinas; 2002
4 Mauad Filho F, Beduschi AF, Albergue R, et al. [Ultrasonographic evaluation of uterine volume variations]. Rev Bras Ginecol Obstet 2001;23(03):175–179 Portuguese.
5 Mulic-Lutvica A, Bekuretsion M, Bakos O, Axelsson O. Ultrasonic evaluation of the uterus and uterine cavity after normal, vaginal delivery. Ultrasound Obstet Gynecol 2001;18(05):491–498 6 Rodeck CH, Newton JR. Study of the uterine cavity by ultrasound
in the early puerperium. Br J Obstet Gynaecol 1976;83(10): 795–801
7 Defoort P, Benijts G, Thiery M, Martens G. Ultrasound assessment of puerperal uterine involution. Eur J Obstet Gynecol Reprod Biol 1978;8(02):95–97
8 Al-Bdour ANA, Akasheh HF, Al-Husban NA. Ultrasonography of the uterus after normal vaginal delivery. Saudi Med J 2004; 25(01):41–44
9 Lee CY, Madrazo B, Drukker BH. Ultrasonic evaluation of the postpartum uterus in the management of postpartum bleeding. Obstet Gynecol 1981;58(02):227–232
10 Wachsberg RH, Kurtz AB, Levine CD, Solomon P, Wapner RJ. Real-time ultrasonographic analysis of the normal postpartum uterus: technique, variability, and measurements. J Ultrasound Med 1994;13(03):215–221
11 Sokol ER, Casele H, Haney EI. Ultrasound examination of the postpartum uterus: what is normal? J Matern Fetal Neonatal Med 2004;15(02):95–99
12 Edwards A, Ellwood DA. Ultrasonographic evaluation of the postpartum uterus. Ultrasound Obstet Gynecol 2000;16(07): 640–643
13 Belachew J, Axelsson O, Mulic-Lutvica A, Eurenius K. Longitudinal study of the uterine body and cavity with three-dimensional ultrasonography in the puerperium. Acta Obstet Gynecol Scand 2012;91(10):1184–1190
study of the postpartum uterus. J Matern Fetal Neonatal Med 2015;28(18):2221–2227
15 Diniz CP, Araujo Júnior E, Lima MM, Guazelli CA, Moron AF. Ultrasound and Doppler assessment of uterus during puerperium after normal delivery. J Matern Fetal Neonatal Med 2014;27(18): 1905–1911
16 Negishi H, Kishida T, Yamada H, Hirayama E, Mikuni M, Fujimoto S. Changes in uterine size after vaginal delivery and cesarean section determined by vaginal sonography in the puerperium. Arch Gynecol Obstet 1999;263(1-2):13–16
17 Koskas M, Nizard J, Salomon LJ, Ville Y. Abdominal and pelvic ultrasoundfindings within 24 hours following uneventful Cesar-ean section. Ultrasound Obstet Gynecol 2008;32(04):520–526 18 Bae HS, Ahn KH, Oh MJ, Kim HJ, Hong SC. Postpartum uterine