Adelmo de Souza Machado NetoI,II
Tarcisio Matos AndradeI Gilênio Borges FernandesIII Helder Paulo ZachariasIII Fernando Martins CarvalhoIV Ana Paula Souza MachadoII Ana Carmen Costa DiasII Ana Carolina Rocha GarciaII Lauro Reis SantanaI
Carlos Eduardo RolinI Cyntia SampaioI Gisele GhiraldiI
Francisco Inácio BastosV
I Departamento de Medicina. Faculdade de Medicina da Bahia (FMB). Universidade Federal da Bahia (UFBA). Salvador, BA, Brasil II Escola Bahiana de Medicina e Saúde
Pública. Fundação Bahiana para o Desenvolvimento das Ciências. Salvador, BA, Brasil
III Departamento de Estatística. Instituto de Matemática. UFBA. Salvador, BA, Brasil IV Departamento de Medicina Preventiva e
Social. FMB-UFBA. Salvador, BA, Brasil. V Laboratório de Informações em Saúde.
Instituto de Comunicação e Informação Cientifi ca e Tecnológica em Saúde. Fundação Oswaldo Cruz. Rio de Janeiro, RJ, Brasil
Correspondence:
Adelmo de Souza Machado Neto Universidade Federal da Bahia R. Humberto de Campos, 144 Sala 1103 40150-120 Salvador, BA, Brasil E-mail: machadonetoa@yahoo.com.br Received: 3/11/2009
Approved: 4/6/2010
Article available at: www.scielo.br/rsp
Reliability of a questionnaire
on substance use among
adolescent students, Brazil
Confi abilidade de questionário sobre
uso de drogas por escolares, Brasil
ABSTRACT
OBJECTIVE: To analyze reliability of a self-applied questionnaire on substance use and misuse among adolescent students.
METHODS: Two cross-sectional studies were carried out for the instrument
test-retest. The sample comprised male and female students aged 11–19 years from public and private schools (elementary, middle, and high school students) in the city of Salvador, Northeastern Brazil, in 2006. A total of 591 questionnaires were applied in the test and 467 in the retest. Descriptive statistics, the Kappa index, Cronbach’s alpha and intraclass correlation were estimated.
RESULTS: The prevalence of substance use/misuse was similar in both test and
retest. Sociodemographic variables showed a “moderate” to “almost perfect” agreement for the Kappa index, and a “satisfactory” (>0.75) consistency for Cronbach’s alpha and intraclass correlation. The age which psychoactive substances (tobacco, alcohol, and cannabis) were fi rst used and chronological age were similar in both studies. Test-retest reliability was found to be a good indicator of students’ age of initiation and their patterns of substance use.
CONCLUSIONS: The questionnaire reliability was found to be satisfactory
in the population studied.
DESCRIPTORS: Questionnaires. Adolescent. Adolescent Behavior. Illicit
Substance use and misuse and drug dependence consti-tute a major public health issue worldwide. Substance misuse usually begins during adolescence, but popu-lation-based studies targeting adolescent students are relatively scarce in low and middle-income countries. The psychometric properties such as test-retest reli-ability of questionnaires addressing sociodemographic, behavioral and patterns of substance use/misuse depend on the characteristics of the population under evalua-tion, local social values and mores and the comprehen-sibility and cultural sensitivity of the instrument in a given context.4
Some factors have been explored in recent literature including proper understanding of the phrasing used in the questionnaire,25 respondents’ willingness to provide
reliable answers,1,6 interest and time available to take
part in the study and statistical power of the sample under analysis.18,21,22
In Brazil, previous studies applied standard question-naires to assess substance use/misuse.3,4,9,10 These
ques-tionnaires usually consist of adaptations of instruments originally developed in English.3,9,10
There are few studies of questionnaire reliability on drug use in Brazil, with signifi cant methodology differences (in sampling and statistical analysis).3,4,10 A
RESUMO
OBJETIVO: Analisar a confi abilidade de um questionário auto-aplicável sobre o uso e abuso de substâncias entre adolescentes escolares.
MÉTODOS:Foram realizados dois estudos transversais para teste e re-teste
do questionário em amostra representativa de alunos de ambos os sexos, de 11 a 19 anos, de escolas públicas e privadas (do curso fundamental e médio) de Salvador, BA, em 2006. Foram aplicados 591 questionários na primeira aplicação e 467 na segunda. Foram calculados a estatística descritiva, o índice kappa, alfa de Cronbach e correlação intraclasse.
RESULTADOS: A prevalência do uso/abuso das substâncias foi semelhante
em ambas as avaliações. Para as variáveis sociodemográfi cas o índice kappa indicou concordância “moderada” a “quase perfeita” e a análise do alfa de Cronbach e correlação intraclasse indicaram consistência “satisfatória”. A idade de experimentação das substâncias psicoativas (tabaco, álcool e maconha) e idade dos estudantes foram semelhantes nas duas avaliações. A idade de iniciação do consumo e padrões de uso foram considerados indicadores confi áveis.
CONCLUSÕES: A confi abilidade do questionário foi satisfatória para a
população estudada.
DESCRITORES: Questionários. Adolescente. Comportamento do
Adolescente. Drogas Ilícitas. Reprodutibilidade dos Testes.
INTRODUCTION
Brazilian reliability study adapted an American questio-nnaire on psychoactive drug use in general population without specifying its performance among adolescents.3
Another study used a self-report instrument on drug use in a Brazilian sample of public elementary school children (from fi fth grade on), but the instrument’s reliability was not reported.9 Considering that, the
present study aimed to analyze reliability of a self-applied questionnaire on substance use and misuse among adolescent students.
METHODS
Test-retest reliability was assessed in a comprehen-sive study in 2006. The self-applied questionnaire consisted of 93 questions on basic sociodemographic information, substance use and misuse,7,19 related
behaviors, the adolescents’ relationship with school and their parents, and their opinions about the media and media campaigns to prevent tobacco, alcohol, and cannabis use. The questions were based on previous studies.2,3,13
a Brasil. Ministério da Educação e Cultura. Censo Educacional 2000.
grades), and high schools (tenth, 11th, and 12th grades).
A total of 715,877 students were enrolled in these schools: 538,364 in elementary and middle schools (467,961 in public and 70,403 in private schools), and 177,513 in high schools (156,784 in public and 20,729 in private schools).a
Five schools (two state-run schools, two private schools, and one municipal school) were randomly selected by means of an electronic drawing using education census data. An initial database was created with names, number of classes and number of enrolled students in each class. Each school was stratifi ed according to type of school (public or private) and level (elementary, middle, or high school).
A total of three seventh grade, three eighth grade, three ninth grade, two tenth grade, two 11th grade, and one
12th grade class were selected. Students from each
class were invited to participate in the study and were informed that the same questionnaire would be applied again two weeks later.
A minimum sample size of 466 students was estimated based on the following assumptions: inter-questionnaire agreement ≥0.80, with an estimated error of 0.03,15
and a study power over 95% for the kappa index, the intraclass correlation and the Cronbach’s alpha.1,5
The sample studied was greater than that estimated. In some schools, the number of students per class was higher than estimated in the study planning due to
inaccurate school enrollment information. We opted to include them all to prevent interference in the school routine during data collection. If part of a class were selected, many students would be idle and could inter-fere with school activities of non-selected classes. Exclusion criteria included the absence of the standard labels provided by the study coordination codes, being older than 19 or younger than 11, and incomplete ques-tionnaires. Incomplete questions were excluded, as well as those with unmatched answers to the questions. The questionnaire was applied to 591 students in the test and 467 in the retest with a two-week interval in-between.20 It was applied by medical students during
regular school hours.
The students were informed about the study confi den-tiality and that they could choose to participate or not, or skip questions they consider too sensitive or inap-propriate. Two labels with a code were given to each student to be used in the test and retest.
The refusal rate was lower than 1.0% in the test and 1.7% of the questionnaires were excluded from the analysis (respondents were 19 years old or older). Among those who did not participate in the retest (124), 59.7% had lost their code labels or forgotten their confi dential identifi cation number, 32.3% missed class on the day of retest, and 8.1% refused to participate in the retest (Figure).
ID = registered; W/o = forgot confi dential identifi cation Estimated n
Total = 500 Total = 591 Total = 467 (79%)
107 (80.5%)
190 (76%)
170 (81.7%)
Total W/o = 74 (12.5% ) Total Absences = 40 (6.8 %) Total Refused = 10 (1.7%) Total Loss = 124 (21%) Public
364
Private 136
Private 136 Municipal
108
State-runl 256
Retest loss Retest n
Elem/middle 133
W/o ID: 20; Absence: 6 Total : 26 (19.5%)
Refusal: 5; W/o ID: 21; Absences: 11 Total: 37 (21.5%)
Refusal: 4; W/o ID: 14; Absences: 5 Total: 23 (29.5%)
Refusal: 1; W/o ID: 15; Absences: 14 Total: 30 (20.5%)
W/o ID: 4; Absences: 4 Total: 8 (12.9%) Elem/middle
172
High school 78
Elem/middle 146
High school 62 Test n
Of those who did not participate in the retest, 71% attended public schools, 60.5% were male, 73.4% were enrolled in elementary and middle schools with a mean age of 15.1 years (SD= 1.9). There were no statistical differences between those who participated and those who did not participate in the retest regarding type of school (p=0.14) and grade (p=0.268), but differences were seen regarding gender (p<0.001) and mean age (p<0.005).
A complete questionnaire was considered valid when it had a label with a valid code and was fi lled out with pen, as required.
A draft instrument was tested among junior students at a federal university aiming at adjusting the ques-tionnaires’ phrasing and structure. A revised version was then applied to sophomore students from a private high school to amend language usage issues and other problems found by the respondents. The respondents’ questions and their receptiveness were recorded and examined.
The “bogus pipeline” technique in the form of a sham lie detector (fake question) was used to check for accuracy of responses.17
The study variables were classifi ed as follows: type of school (public, private), gender (male, female), grade (elementary, middle, or high school), ethnicity (Caucasian, African Brazilian, Native, or Asian), living situation (living with parents, grandfather and/ or grandmother, living with other relatives e.g. uncle/ aunt, living with friends), parents’ education level (illiterate, complete elementary, middle, or high school, college, university education), and their mother’s and/ or father’s habits regarding smoking, alcohol, and/or cannabis use (yes/no).2
The study used the kappa index, Cronbach’s alpha, and intraclass correlation (ICC) to measure the questionnaire’s reliability. Due to limitations of the exclusive use of the kappa index in the assessment of reliability and the comprehensiveness of analyses, the three indices were used in a concerted manner.11,12,16
The criteria used in the interpretation of kappa index, intraclass correlation and Cronbach’s alpha fi ndings are summarized in the Annex.21 There were estimated 95%
confi dence intervals (95% CI) as well as the prevalence point for each variable studied.
EpiData 6.0® was used for tabulating the data. Data were analyzed with SPSS 10®, EpiInfo 6.0® and
Winpepi®.
The ICC was calculated using a mixed-effects model and means after assessing putative interactions.14, 15
Prevalence ratios and chi-square statistics were calcu-lated for the different substances in order to assess if
losses in the test-retest were signifi cantly associated with the use of each substance.
The study was approved by the Research Ethics Committee of Universidade Federal da Bahia (Protocol 01/04 – March 3, 2004). We obtained the consent of the principal of each participating school and they were asked to sign an informed consent form and schedule the application of the instrument in the classroom. Following the Research Ethics Committee guidelines it was not necessary to obtain a signed informed consent from each student individually, given the self-applicable and anonymous character of the instrument.
RESULTS
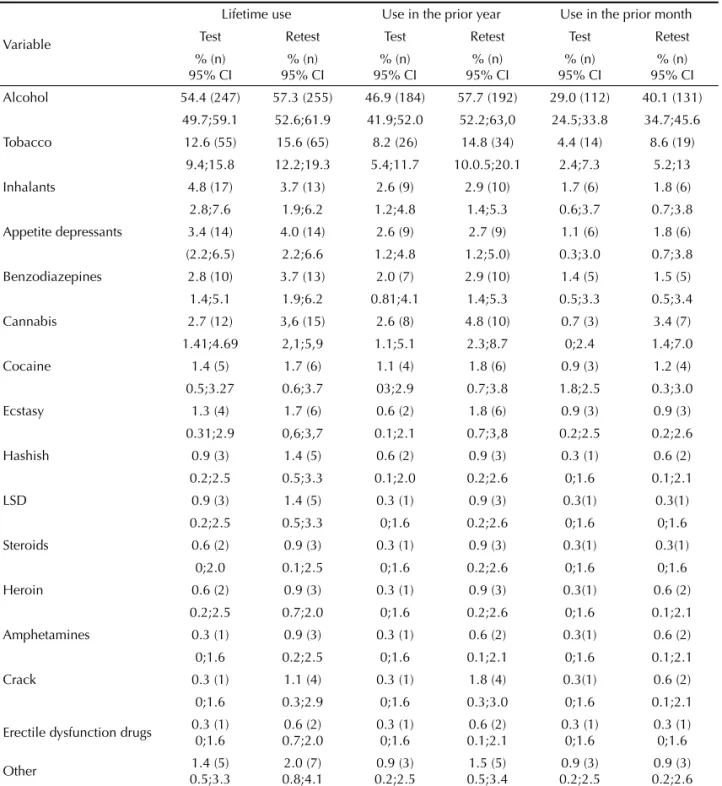
Lifetime, yearly or monthly substance use, with the exception of cannabis, was similar among the students who participated in the test and retest.
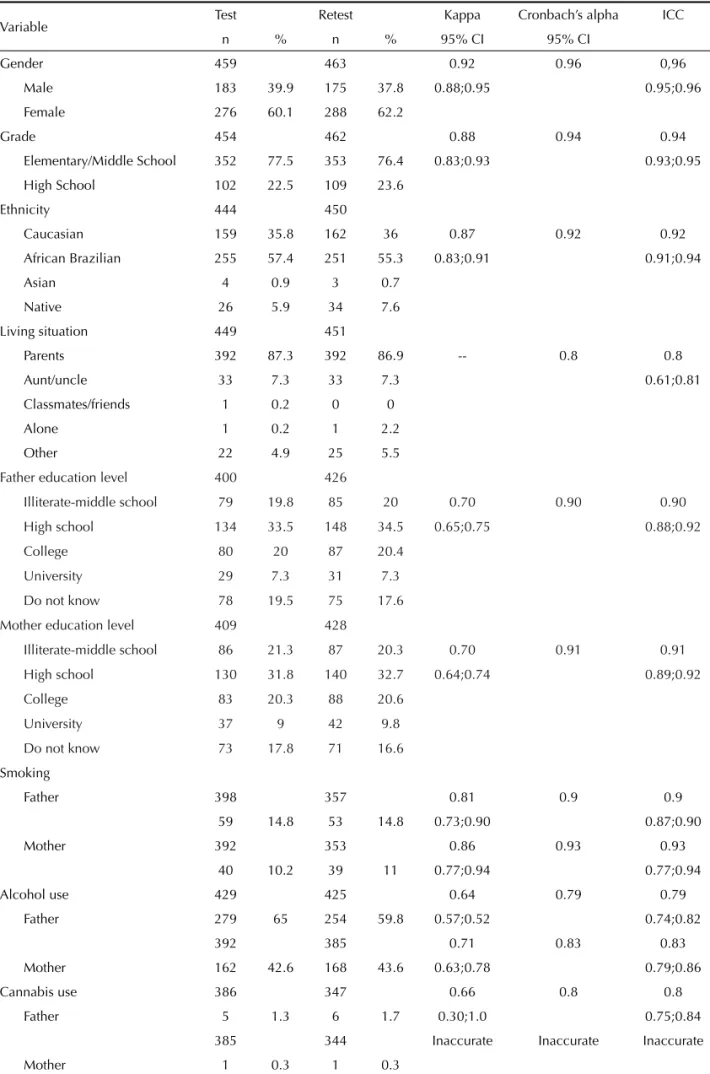
The mean age (n=451) was 14.4 years (SD=1.6) (minimum=11 and maximum=19) for the entire sample. The distribution of enrolled students per administrative unit was: 40.6% students were enrolled in state-run schools, 22.9% in municipal schools, and 36.4% in private schools (Figure). The distribution of sociodemographic variables in the test and retest is summarized in Table 1.
The prevalences of ever use of substances in the test and retest were similar for most substances. There was a non-signifi cant trend toward higher prevalences in the retest, except for the use of inhalants, which was lower than that reported in the test. The prevalence of use of most substances studied in the year and month prior to the questionnaire application was similar in the test and retest, except for alcohol and tobacco use, which was signifi cantly higher in the retest. The prevalence of drug use was inaccurate since some substances reported by the students (hashish, LSD, steroids, heroin, ampheta-mines, crack, and erectile dysfunction drugs) showed wide 95% CIs (Table 2).
Table 1. Frequency and reproducibility indicators (kappa, Cronbach’s alpha, and intraclass correlation) according to sociodemographic variables among 459 adolescent students. City of Salvador, Northeastern Brazil, 2006.
Variable Test Retest Kappa Cronbach’s alpha ICC
n % n % 95% CI 95% CI
Gender 459 463 0.92 0.96 0,96
Male 183 39.9 175 37.8 0.88;0.95 0.95;0.96
Female 276 60.1 288 62.2
Grade 454 462 0.88 0.94 0.94
Elementary/Middle School 352 77.5 353 76.4 0.83;0.93 0.93;0.95
High School 102 22.5 109 23.6
Ethnicity 444 450
Caucasian 159 35.8 162 36 0.87 0.92 0.92
African Brazilian 255 57.4 251 55.3 0.83;0.91 0.91;0.94
Asian 4 0.9 3 0.7
Native 26 5.9 34 7.6
Living situation 449 451
Parents 392 87.3 392 86.9 -- 0.8 0.8
Aunt/uncle 33 7.3 33 7.3 0.61;0.81
Classmates/friends 1 0.2 0 0
Alone 1 0.2 1 2.2
Other 22 4.9 25 5.5
Father education level 400 426
Illiterate-middle school 79 19.8 85 20 0.70 0.90 0.90
High school 134 33.5 148 34.5 0.65;0.75 0.88;0.92
College 80 20 87 20.4
University 29 7.3 31 7.3
Do not know 78 19.5 75 17.6
Mother education level 409 428
Illiterate-middle school 86 21.3 87 20.3 0.70 0.91 0.91
High school 130 31.8 140 32.7 0.64;0.74 0.89;0.92
College 83 20.3 88 20.6
University 37 9 42 9.8
Do not know 73 17.8 71 16.6
Smoking
Father 398 357 0.81 0.9 0.9
59 14.8 53 14.8 0.73;0.90 0.87;0.90
Mother 392 353 0.86 0.93 0.93
40 10.2 39 11 0.77;0.94 0.77;0.94
Alcohol use 429 425 0.64 0.79 0.79
Father 279 65 254 59.8 0.57;0.52 0.74;0.82
392 385 0.71 0.83 0.83
Mother 162 42.6 168 43.6 0.63;0.78 0.79;0.86
Cannabis use 386 347 0.66 0.8 0.8
Father 5 1.3 6 1.7 0.30;1.0 0.75;0.84
385 344 Inaccurate Inaccurate Inaccurate
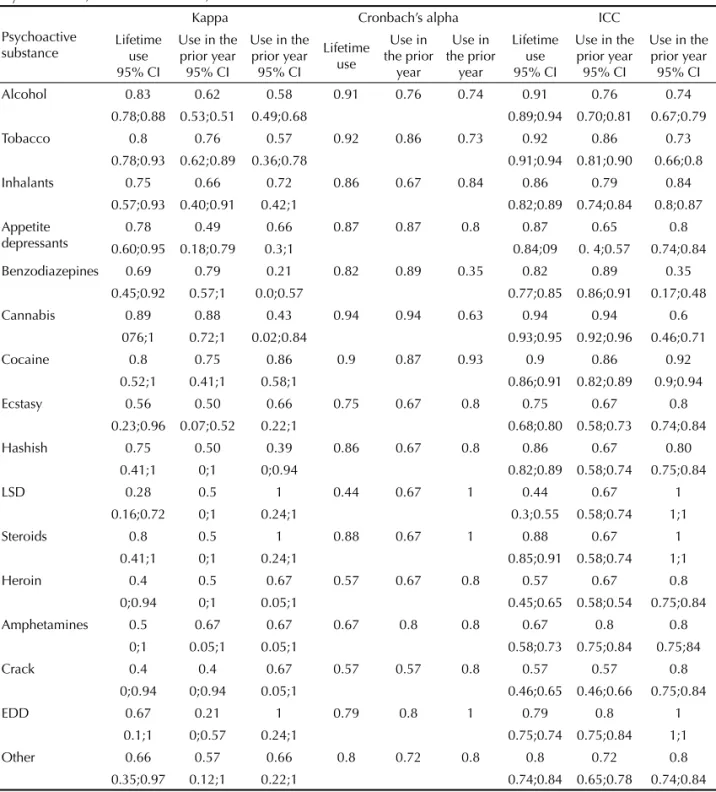
crack, and erectile dysfunction drugs were seldom reported and had values ranging from 0.21 to 1.0, with wide 95% CIs (Table 3).
Cronbach’s alpha and ICC were considered acceptable and satisfactory for most substances, regardless of time of use (lifetime, in the prior year or month). ICC values ranged from 0.44 (satisfactory) to 0.94 (excellent) for lifetime substance use. On the other hand, regarding the use in the prior year, they ranged between 0.57 and 0.94, and in the prior month they ranged from 0.35 (unacceptable) to one. With respect to the use of benzodiazepines in the prior month, reproducibility was
unacceptable (0.35) (Table 3).
The kappa index for alcohol, tobacco, and cannabis use (for different time of use) did not show any signifi cant association with type of school, gender, age, grade, parents’ education level and parental substance use (alcohol, tobacco, and cannabis).
A signifi cant difference in the kappa index was seen for cannabis use in the prior month. The kappa index was 0.66 (95% CI: 0.04;1.00) among public school students and 0.31 (95% CI: 0.00;0.80) among private school students, with a kappa adjusted by sample size of 0.47 (95% CI 0.08;0.85).
Table 2. Frequency of psychoactive substance use (test and retest) for lifetime, in the prior year, and prior month by substance among 459 adolescent students. City of Salvador, Northeastern Brazil, 2006.
Variable
Lifetime use Use in the prior year Use in the prior month
Test Retest Test Retest Test Retest
% (n) 95% CI
% (n) 95% CI
% (n) 95% CI
% (n) 95% CI
% (n) 95% CI
% (n) 95% CI
Alcohol 54.4 (247) 57.3 (255) 46.9 (184) 57.7 (192) 29.0 (112) 40.1 (131)
49.7;59.1 52.6;61.9 41.9;52.0 52.2;63,0 24.5;33.8 34.7;45.6
Tobacco 12.6 (55) 15.6 (65) 8.2 (26) 14.8 (34) 4.4 (14) 8.6 (19)
9.4;15.8 12.2;19.3 5.4;11.7 10.0.5;20.1 2.4;7.3 5.2;13
Inhalants 4.8 (17) 3.7 (13) 2.6 (9) 2.9 (10) 1.7 (6) 1.8 (6)
2.8;7.6 1.9;6.2 1.2;4.8 1.4;5.3 0.6;3.7 0.7;3.8
Appetite depressants 3.4 (14) 4.0 (14) 2.6 (9) 2.7 (9) 1.1 (6) 1.8 (6)
(2.2;6.5) 2.2;6.6 1.2;4.8 1.2;5.0) 0.3;3.0 0.7;3.8
Benzodiazepines 2.8 (10) 3.7 (13) 2.0 (7) 2.9 (10) 1.4 (5) 1.5 (5)
1.4;5.1 1.9;6.2 0.81;4.1 1.4;5.3 0.5;3.3 0.5;3.4
Cannabis 2.7 (12) 3,6 (15) 2.6 (8) 4.8 (10) 0.7 (3) 3.4 (7)
1.41;4.69 2,1;5,9 1.1;5.1 2.3;8.7 0;2.4 1.4;7.0
Cocaine 1.4 (5) 1.7 (6) 1.1 (4) 1.8 (6) 0.9 (3) 1.2 (4)
0.5;3.27 0.6;3.7 03;2.9 0.7;3.8 1.8;2.5 0.3;3.0
Ecstasy 1.3 (4) 1.7 (6) 0.6 (2) 1.8 (6) 0.9 (3) 0.9 (3)
0.31;2.9 0,6;3,7 0.1;2.1 0.7;3,8 0.2;2.5 0.2;2.6
Hashish 0.9 (3) 1.4 (5) 0.6 (2) 0.9 (3) 0.3 (1) 0.6 (2)
0.2;2.5 0.5;3.3 0.1;2.0 0.2;2.6 0;1.6 0.1;2.1
LSD 0.9 (3) 1.4 (5) 0.3 (1) 0.9 (3) 0.3(1) 0.3(1)
0.2;2.5 0.5;3.3 0;1.6 0.2;2.6 0;1.6 0;1.6
Steroids 0.6 (2) 0.9 (3) 0.3 (1) 0.9 (3) 0.3(1) 0.3(1)
0;2.0 0.1;2.5 0;1.6 0.2;2.6 0;1.6 0;1.6
Heroin 0.6 (2) 0.9 (3) 0.3 (1) 0.9 (3) 0.3(1) 0.6 (2)
0.2;2.5 0.7;2.0 0;1.6 0.2;2.6 0;1.6 0.1;2.1
Amphetamines 0.3 (1) 0.9 (3) 0.3 (1) 0.6 (2) 0.3(1) 0.6 (2)
0;1.6 0.2;2.5 0;1.6 0.1;2.1 0;1.6 0.1;2.1
Crack 0.3 (1) 1.1 (4) 0.3 (1) 1.8 (4) 0.3(1) 0.6 (2)
0;1.6 0.3;2.9 0;1.6 0.3;3.0 0;1.6 0.1;2.1
Erectile dysfunction drugs 0.3 (1) 0;1.6
0.6 (2) 0.7;2.0
0.3 (1) 0;1.6
0.6 (2) 0.1;2.1
0.3 (1) 0;1.6
0.3 (1) 0;1.6
Other 1.4 (5)
0.5;3.3
2.0 (7) 0.8;4.1
0.9 (3) 0.2;2.5
1.5 (5) 0.5;3.4
0.9 (3) 0.2;2.5
When stratifi ed by type of school (public vs. private), the kappa index, Cronbach’s alpha, and ICC were not accurate among public school students regarding the use of ecstasy, crack, heroin, LSD, amphetamines, and erectile dysfunction drugs (regardless of time of use) (data not shown). Among private school students there was a clear higher prevalence of lifetime use of these substances (with the exception of cannabis), and use of these substances in the prior year and month (p<0.001). The proportion of students who reported the use of these substances was quite low with zero
prevalence among public school students.
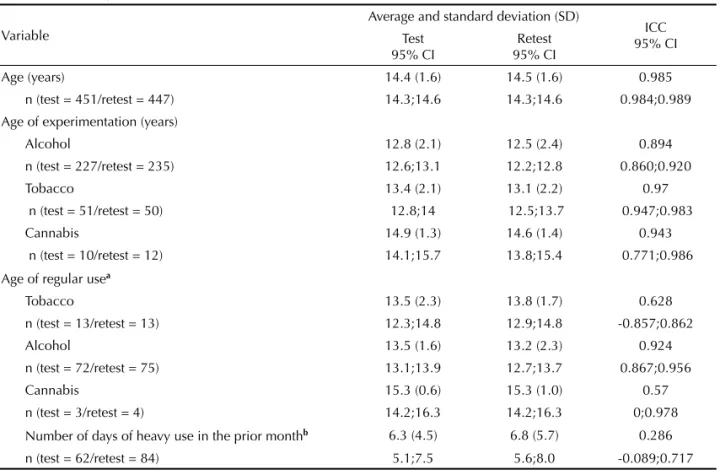
The students’ mean age and mean age of initiation of substance use (tobacco, alcohol, and cannabis) were similar in the test and retest (Table 4). The ICC was excellent for age, age of initiation of substance use (tobacco, alcohol, and cannabis), and age of initiation of regular alcohol use. The coeffi cients were found to be inaccurate with respect to age of regular tobacco and cannabis use, and the number of days of heavy alcohol consumption in the prior month, with wide 95% CIs (Table 4).
Table 3. Indicators of reproducibility (kappa, Cronbach’s alpha, and intraclass correlation) of the frequency of psychoactive substance use (test and retest) for lifetime, in the prior year, and prior month by substance among 459 adolescent students. City of Salvador, Northeastern Brazil, 2006.
Psychoactive substance
Kappa Cronbach’s alpha ICC
Lifetime use 95% CI
Use in the prior year
95% CI
Use in the prior year
95% CI
Lifetime use
Use in the prior
year
Use in the prior
year
Lifetime use 95% CI
Use in the prior year
95% CI
Use in the prior year
95% CI
Alcohol 0.83 0.62 0.58 0.91 0.76 0.74 0.91 0.76 0.74
0.78;0.88 0.53;0.51 0.49;0.68 0.89;0.94 0.70;0.81 0.67;0.79
Tobacco 0.8 0.76 0.57 0.92 0.86 0.73 0.92 0.86 0.73
0.78;0.93 0.62;0.89 0.36;0.78 0.91;0.94 0.81;0.90 0.66;0.8
Inhalants 0.75 0.66 0.72 0.86 0.67 0.84 0.86 0.79 0.84
0.57;0.93 0.40;0.91 0.42;1 0.82;0.89 0.74;0.84 0.8;0.87
Appetite depressants
0.78 0.49 0.66 0.87 0.87 0.8 0.87 0.65 0.8
0.60;0.95 0.18;0.79 0.3;1 0.84;09 0. 4;0.57 0.74;0.84
Benzodiazepines 0.69 0.79 0.21 0.82 0.89 0.35 0.82 0.89 0.35
0.45;0.92 0.57;1 0.0;0.57 0.77;0.85 0.86;0.91 0.17;0.48
Cannabis 0.89 0.88 0.43 0.94 0.94 0.63 0.94 0.94 0.6
076;1 0.72;1 0.02;0.84 0.93;0.95 0.92;0.96 0.46;0.71
Cocaine 0.8 0.75 0.86 0.9 0.87 0.93 0.9 0.86 0.92
0.52;1 0.41;1 0.58;1 0.86;0.91 0.82;0.89 0.9;0.94
Ecstasy 0.56 0.50 0.66 0.75 0.67 0.8 0.75 0.67 0.8
0.23;0.96 0.07;0.52 0.22;1 0.68;0.80 0.58;0.73 0.74;0.84
Hashish 0.75 0.50 0.39 0.86 0.67 0.8 0.86 0.67 0.80
0.41;1 0;1 0;0.94 0.82;0.89 0.58;0.74 0.75;0.84
LSD 0.28 0.5 1 0.44 0.67 1 0.44 0.67 1
0.16;0.72 0;1 0.24;1 0.3;0.55 0.58;0.74 1;1
Steroids 0.8 0.5 1 0.88 0.67 1 0.88 0.67 1
0.41;1 0;1 0.24;1 0.85;0.91 0.58;0.74 1;1
Heroin 0.4 0.5 0.67 0.57 0.67 0.8 0.57 0.67 0.8
0;0.94 0;1 0.05;1 0.45;0.65 0.58;0.54 0.75;0.84
Amphetamines 0.5 0.67 0.67 0.67 0.8 0.8 0.67 0.8 0.8
0;1 0.05;1 0.05;1 0.58;0.73 0.75;0.84 0.75;84
Crack 0.4 0.4 0.67 0.57 0.57 0.8 0.57 0.57 0.8
0;0.94 0;0.94 0.05;1 0.46;0.65 0.46;0.66 0.75;0.84
EDD 0.67 0.21 1 0.79 0.8 1 0.79 0.8 1
0.1;1 0;0.57 0.24;1 0.75;0.74 0.75;0.84 1;1
Other 0.66 0.57 0.66 0.8 0.72 0.8 0.8 0.72 0.8
0.35;0.97 0.12;1 0.22;1 0.74;0.84 0.65;0.78 0.74;0.84
Table 4. Average and standarddeviation (test and retest) and intraclass correlation (ICC) according to age, age of experimentation, age of regular use, and number of days of heavy alcohol use of 459 school-age adolescents. Municipality of Salvador, Northeastern Brazil, 2006.
Variable
Average and standard deviation (SD)
ICC 95% CI Test
95% CI
Retest 95% CI
Age (years) 14.4 (1.6) 14.5 (1.6) 0.985
n (test = 451/retest = 447) 14.3;14.6 14.3;14.6 0.984;0.989
Age of experimentation (years)
Alcohol 12.8 (2.1) 12.5 (2.4) 0.894
n (test = 227/retest = 235) 12.6;13.1 12.2;12.8 0.860;0.920
Tobacco 13.4 (2.1) 13.1 (2.2) 0.97
n (test = 51/retest = 50) 12.8;14 12.5;13.7 0.947;0.983
Cannabis 14.9 (1.3) 14.6 (1.4) 0.943
n (test = 10/retest = 12) 14.1;15.7 13.8;15.4 0.771;0.986
Age of regular usea
Tobacco 13.5 (2.3) 13.8 (1.7) 0.628
n (test = 13/retest = 13) 12.3;14.8 12.9;14.8 -0.857;0.862
Alcohol 13.5 (1.6) 13.2 (2.3) 0.924
n (test = 72/retest = 75) 13.1;13.9 12.7;13.7 0.867;0.956
Cannabis 15.3 (0.6) 15.3 (1.0) 0.57
n (test = 3/retest = 4) 14.2;16.3 14.2;16.3 0;0.978
Number of days of heavy use in the prior monthb 6.3 (4.5) 6.8 (5.7) 0.286
n (test = 62/retest = 84) 5.1;7.5 5.6;8.0 -0.089;0.717
a at least 5 times per month b 5 or more doses
DISCUSSION
Our results can be extrapolated to adolescents enrolled in schools in Salvador from the last year of elemen-tary school to the last year of high school. However, they cannot be extrapolated to adolescents out of the educational system or in other contexts, outside the city of Salvador.
A questionnaire to be applied in a future comprehensive study on this population in Salvador was developed and reviewed through successive adjustments and improvements. The fi nal instrument was a scannable form allowing more reliable results and minimizing data entry errors.3
According to the literature,3,20 intervals of two to 14
days can be used between test and retest. In the present study, a two-week interval between assessments was used since smaller intervals seemed to increase memo-rization bias.25 A previous Brazilian study retested a
questionnaire within an interval of 30 days and proved reproducible by kappa analysis.3
The sample size is a key aspect for epidemiological and test-retest studies.1,15,25 Overestimated samples
are time and money consuming, and small samples may compromise accuracy of the fi ndings, yielding estimates with too broad confi dence intervals.1,25 In a
test-retest assessment, sample size must be estimated for each specifi c statistics (kappa, Cronbach’s alpha and the ICC),1 and in the present study the sample had
enough power to properly assess the three indices.1,24
Among those students who did not participate in the retest, statistically signifi cant differences were seen concerning gender and age, but no signifi cant diffe-rence was found associated with the use of any specifi c substance.
Different studies have shown that the use of a “bogus pipeline” method for anonymous instruments tends to increase the reliability of cross-sectional and prospec-tive studies on drug use.17 This technique enhances the
likelihood of positive answers when substance use and misuse is concerned.26
In the present study, the reported prevalences of subs-tance use tended to be higher (with no statistical
signi-fi cance) in the retest. This fi nding may be explained by: a favorable impact (motivation) of the previous successful test on retest;15,17 students’ increased trust on
the research team after a prior positive experience; and the use of the “bogus pipeline” as a check for putative biases. The reported prevalence of use was too low for some substances, making such estimates inaccurate,20,25
The kappa index had moderate to substantial corre-lation between sociodemographic variables for most substances (and different times of use), except for LSD, steroids, heroin, amphetamines, crack, and erectile dysfunction drugs. This inaccuracy seems to be secondary to a low prevalence of use of these substances.8,23
The fi rst study on substance use and misuse in Brazil used exclusively the kappa index for the assessment of reliability with a mean value of 0.79 (95% CI 0.50;1.00).3 Although this index was similar in the
present study, the fi ndings from the two studies were not fully comparable. In the current study 95% CIs were provided, as well as the results for the ICC and Cronbach’s alpha, but such information are absent in the previous one, compromising a comprehensive compa-rison of the psychometric properties of the respective questionnaires.
ICC was found to be satisfactory to excellent and Cronbach’s alpha measures were acceptable. These indices are more accurate than the kappa index since they rely less on the prevalence and symmetry of the events under analysis and probe the internal consistency of the instruments under analysis.4,16 ICC showed high
values for most continuous variables, except for age of initiation of regular use (tobacco and cannabis) and heavy use of alcohol, probably due to the low preva-lence of such harmful habits.1
Missing information and/or participant losses between test and retest may have biased fi ndings and may cons-titute a limitation of the present study.25 Even
conside-ring the limitations associated with underestimating or overestimating substance use, our questionnaire showed reliability among adolescent students in the city of Salvador, and may be a useful and culturally-sensitive instrument for the assessment of substance use and misuse in this population.
1. Bonett LMG. Sample size requirements for testing and estimating coeffi cient Alpha. J Educ Behav Stat.
2002;27(4):335-40. DOI:10.3102/10769986027004335
2. Brener ND, Kann L, Kinchen SA, Grunbaum JA, Whalen L, Eaton D, et al. Methodology of the youth risk behavior surveillance system. MMWR Recomm Rep. 2004;53(RR-12):1-13.
3. Carlini EA, Galduróz JCF, Noto AR, Nappo SA. I levantamento domiciliar sobre uso de drogas psicotrópicas no Brasil: estudo envolvendo as 107 maiores cidades do país - 2001. São Paulo: Cebrid/ Unifesp/Senad; 2002.
4. Chor D, Faerstein E, Alves MG, de Souza Lopes C. How reproducible is self-reported information on exposure to smoking, drinking, and dietary patterns? Evidence among Brazilian adults in the Pro-Saude Study. Sao Paulo Med J. 2003;121(2):63-6. DOI:10.1590/S1516-31802003000200006
5. Donner A, Eliasziw M. A goodness-of-fi t approach to inference procedures for the kappa statistic: confi dence interval construction, signifi cance-testing and sample size estimation. Stat Med. 1992;11(11):1511-9. DOI:10.1002/sim.4780111109
6. Engels RC, Knibbe RA, Drop MJ. Inconsistencies in adolescents’ self-reports of initiation of alcohol and tobacco use. Addict Behav. 1997;22(5):613-23. DOI:10.1016/S0306-4603(96)00067-6
7. Fagerström KO. Treatment of nicotine dependence.
Prog Brain Res. 1989;79:321-6. DOI:10.1016/S0079-6123(08)62491-7
8. Feinstein AR, Cicchetti DV. High agreement but low kappa: I. The problems of two paradoxes. J Clin Epidemiol. 1990;43(6):543-9. DOI:10.1016/0895-4356(90)90158-L
9. Galduroz JC, Noto AR, Fonseca AM, Carlini EA. V levantamento nacional sobre o consumo de drogas psicotrópicas entre estudantes do ensino fundamental
e médio da rede pública de ensino nas 27 captais brasileiras, 2004. São Paulo: Cebrid/Senad; 2005.
10. Henrique IFS, De Micheli D, Lacerda RB, Lacerda LA, Formigoni MLOS. Validação da versão brasileira do teste de triagem do envolvimento com álcool, cigarro e outras substâncias (ASSIST). Rev Assoc Med Bras. 2004;50(2):199-206. DOI:10.1590/S0104-42302004000200039
11. Kottner J, Dassen T. Interpreting interrater reliability coeffi cients of the Braden scale: a discussion paper.
Int J Nurs Stud. 2007;45(8):1238-46. DOI:10.1016/j. ijnurstu.2007.08.001
12. Lantz CA, Nebenzahl E. Behavior and interpretation of the kappa statistic: resolution of the two paradoxes. J Clin Epidemiol. 1996;49(4):431-4. DOI:10.1016/0895-4356(95)00571-4
13. Machado Neto AS, Cruz AA. Smoking among school adolescents in Salvador (BA). Jornal de Pneumologia.
2003;29:264-72
14. Mak TK. Analysing intraclass correlation for dichotomous variables. Appl Statist. 1988;37(3):344-52. DOI:10.2307/2347309
15. Müller MJ, Szegedi A. Effects of interrater reliability of psychopathologic assessment on power and sample size calculations in clinical trials.
J Clin Psychopharmacol. 2002;22(3):318-25. DOI:10.1097/00004714-200206000-00013
16. Murray DM, Rooney BL, Hannan PJ, Peterson AV, Ary DV, Biglan A, et al. Intraclass correlation among common measures of adolescent smoking: estimates, correlates, and applications in smoking prevention studies. Am J Epidemiol. 1994;140(11):1038-50.
17. Murray DM, O’Connell CM, Schmid LA, Perry CL. The validity of smoking self-reports by adolescents: a reexamination of the bogus pipeline procedure.
Addict Behav. 1987;12(1):7-15. DOI:10.1016/0306-4603(87)90003-7
Article based on the doctoral thesis of AS Machado Neto submitted to the Graduate Program in Medicine and Health of Universidade Federal da Bahia, in 2009.
The authors declare that there are no confl icts of interests. 18. Nam JM. Homogeneity score test for the intraclass
version of the kappa statistics and sample-size determination in multiple or stratifi ed studies.
Biometrics. 2003;59(4):1027-35. DOI:10.1111/j.0006-341X.2003.00118.x
19. Organização Mundial da Saúde. CID-10: Classifi cação estatística internacional e problemas relacionados à saúde (décima revisão). São Paulo: Edusp; 1998.
20. Severson HH, Ary DV. Sampling bias due to consent procedures with adolescents. Addict Behav.
1983;8(4):433-7. DOI:10.1016/0306-4603(83)90046-1
21. Sim J, Wright CC. The kappa statistic in reliability studies: use, interpretation, and sample size requirements. Phys Ther. 2005;85(3):257-68.
22. Tavaré CJ, Sobel EL, Gilles FH. Misclassifi cation of a prognostic dichotomous variable: sample size
and parameter estimate adjustment. Stat Med.
1995;14(12):1307-14. DOI:10.1002/sim.4780141204
23. Thompson WD, Walter SD. Kappa and the concept of independent errors. J Clin Epidemiol. 1988;41(10):969-70. DOI:10.1016/0895-4356(88)90033-9
24. Walter SD, Eliasziw M, Donner A. Sample size and optimal designs for reliability studies. Stat Med.
1998;17(1):101-10. DOI:10.1002/(SICI)1097-0258(19980115)17:1<101::AID-SIM727>3.0.CO;2-E
25. Watson D. Stability versus change, dependability versus error: issues in the assessment of personality over time. J Res Pers. 2004;38(4):319-50.
DOI:10.1016/j.jrp.2004.03.001
26. Werch CE, Lundstrum RH, Moore A. Bogus-pipeline effects on self-reported college student drug use, problems, and attitudes. Int J Addict.
1989;24(10):1003-10.
Annex. Values and interpretation of the kappa index, intraclass correlation, and Cronbach’s alpha.
Value Interpretation
Kappa index
<0 No agreement
0;0.19 Poor agreement
0.20;0.39 Fair agreement
0.40;0.59 Moderate agreement
0.60;0.79 Substantial agreement 0.80;1.00 Almost perfect agreement Intraclass correlation
<0.4 Poor reproducibility
0.4;0.75 Satisfactory reproducibility >0.75 Excellent reproducibility Cronbach’s alpha
<0.6 Unacceptable reproducibility
0,6;0,79 Acceptable reproducibility
0.8;0.94 Good reproducibility