CHARACTERISTICS OF PHONETOGRAPHY ON SUBJECTS
WITH DENTOFACIAL BALANCE IN POST VOCAL CHANGE
Características da fonetograia em indivíduos
com equilíbrio dentofacial pós-muda vocal
Cláudia Tiemi Mituuti(1), Cibele Carméllo Santos(2),
Lídia Cristina da Silva Teles(3), Giédre Berretin-Felix (4)
(1) Speech Language Pathologist; Master of Speech Lan-guage Pathology by the Dentistry School in Bauru, Univer-sity of São Paulo – FOB/USP, Bauru, SP, Brazil.
(2) Speech Language Pathologist Master of Speech Language Pathology by the Dentistry School in Bauru, University of São Paulo – FOB/USP, Bauru, SP, Brazil.
(3) Speech Language Pathologist, Professor from the Depart-ment of Speech Language Pathology from the Dentistry College in Bauru/USP – FOB/USP, Bauru, SP, Brazil; PhD in Rehabilitation Sciences at the Hospital for Rehabilitation of Craniofacial Anomalies/USP.
(4) Speech Language Pathologist, Professor from Department of Speech Language Pathology from the Dentistry Col-lege in Bauru/USP – FOB/USP, Bauru, SP, Brazil; Ph.D.
performance. It was described by Damsté1 and, in
1983; the Union of European Speech Language Pathologists proposed that this to be done as part of the evaluation of the voice of individuals with normal voices2. This exam may be performed manually
or computerized3, and provides information on the
proile of vocal range, through the deinition of an
area between the intensities obtained from the
minimum and maximum frequencies of the vocal
range4-6.
The literature has documented the use of phone-tography to distinguish normal vocal voices5,7,8,
documenting changes in voice due to fatigue, and
to evaluate the change in vocal quality after voice
therapy4, or vocal training for singing6,9. Speciically
regarding the standardization of benchmarks, there are studies for the Thai population10, German11 and
Finnish12. In Brazil, a study that found that
phone- INTRODUCTION
The phonetography is an exam that relects the
individual physiological vocal limits or capacities,
and is considered a exam of laryngeal maximum
ABSTRACT
Purpose: to characterize, by means of phonetography, the proile of voice extension in individuals
with post changes, dentofacial balanced voice. Method: ifteen male individuals participated in this
study, in vocal postmutation, aged between 14 and 35 years old. They answered a speciic self-response questionnaire, and they were also submitted to an anthropometric assessment of the face, dento-occlusal evaluation, phonetography examination and to an analysis of the usual fundamental frequency of the voice. Results: minimum Fundamental Frequency: =89Hz±3Hz or =29st±14st,
Maximum Fundamental Frequency: X=665Hz±179Hz or X=63st±5, Voice Extension: X=34st±6st, Minimum Intensity: X=66dB±3dB, Maximum Intensity: X=114dB±5dB, Maximum Dynamic Extension: X=42dB±4dB, Phonetogram Area: X=936,4dB.st±258,8dB.st or X=42,1cm2±11,6cm2, Usual
Fundamental Frequency of the “a” vowel: X=111,26Hz±15,24Hz. Conclusion: although national and international studies presented in this work do not consider the dentofacial condition of the subjects, the results were very similar.
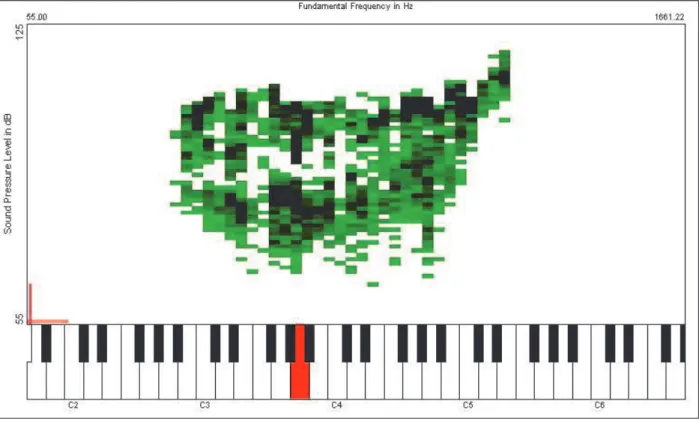
To examine the phonetography was used VRP
Program (Voice Range Proile) from Kay Elemetrics’
Multi Speech, with an unidirectional headset
micro-phone, RM – MZ3R brand, positioned at a distance of 3cm from the lip commissure of the participant. The recordings were performed in an acoustically treated room. For the measurements of
phoneto-graphy requested to issue the prolonged vowel “a”
in modal register, for at least 5 seconds at intensities
stronger and weaker as possible. The exam started
in C3 (dó3, 131 Hz) with continuous ascending and descending scale.
The analyzed measures were:
• minimum and maximum fundamental frequency
of the voice (FMÍN e FMÁX), expressed in semitones
(st) and Hertz (Hz), which correspond to higher notes and more serious musical scale produced in strong and weak intensities;
• vocal extention (VE), expressed in semitones
and Hertz, which is the extension of frequency,
comprising the total number of musical notes played and analyzed by the difference between
the maximum and minimum frequency;
• minimum intensity and maximum intensity (IMÍN e
IMÁX), obtained from the lowest point of the lower curve and the highest point of the upper curve of phonetogram;
• maximum dynamic extension (MDE) expressed
in decibels, the largest difference in intensity between the upper and lower phonetogram
curves in the same frequency;
• phonetogram area, resulting area of the
connec-tion between all points of the lower and upper
curve in relation to vocal range, expressed in
dB.st and cm2. It was obtained from the data
of VRP through a program that performs the
conversion from dB.st to cm2, using the
conver-sion factor of 0.045 cm2, in which 10 dB
corres-ponds to 15mm and 12 st correscorres-ponds to 36mm2.
The measures from all frequencies given in the abscissa of the phonetogram obtained by VRP in
the phonetography (Figure 1) were converted from Hertz to semitone in order to allow the calculation of the phonetogram area, for being the semitone a linear measure which presents regular intervals in musical scale in 12 semitones, which does not
occur with Hertz, which is an exponential measure.
Moreover, the values of the vocal range in the litera-ture have been used in semitones5, 8,13,23,24, enabling
later comparisons. Studies also indicate to be an association
between the dimensions of the vocal tract and the
characteristics of voice quality and formants15.16;
between voice disorders and oral muscular disor-ders17,18, being described, too, the relationship
between the severity of temporomandibular
dysfunc-tion and vocal quality19.
Despite the literature demonstrate the rela-tionships between the characteristics of the stoma-tognathic system and speech function, no studies
were found to examine the vocal parameters consi -dering facial type and dento-occlusal balance condi-tion. Being phonetography an important instrument for achieving vocal assessment, the objective of this
study is to characterize the proile of the vocal range
of male subjects with dentofacial balance after voice change, through phonetography.
METHOD
The study included 15 male subjects, after voice change, with ages from 14 to 35 years old (average = 18.86). Criteria considered for inclusion were: presenting medium facial type with medium
and lower equilibrium; appropriate length of upper and lower lips, Standard I20facial proile, which
was considered in relation to the nasolabial angle
balance, facial convexity angle, ratio between
average anterior facial height and lower anterior facial height, as well as the proportion of the lower
face, the relationship of the irst permanent molar
in class I21; overbite and horizontal measuring between 1 and 4 mm22, not presenting vocal
altera-tions, having completed vocal changes14, not having
syndromic or neurological impairments related to
speech or expressive or receptive language, being
a native speaker of Brazilian Portuguese, not having undergone laryngeal surgeries, not having prior vocal training, not having hearing complaints, not being alcoholic, not being nor having ever been a smoker, presenting good general health and no symptoms of laryngeal or respiratory alterations
on the exam day. For this, all subjects answered a speciic form of auto-responder investigating
the aspects mentioned above, but also underwent anthropometric measurements of the face, dental--occlusal evaluation, perceptual evaluation of voice
as well as assessment of expressive and receptive
about the procedures and were asked to sign
the “Term of Free and Informed Consent” for all
participants.
RESULTS
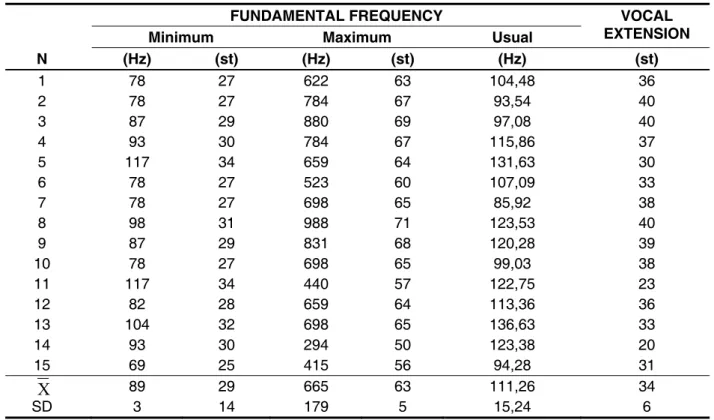
From the examination of phonetography, it
was found the measures of minimum fundamental
frequency, maximum fundamental frequency, range
from FMIN=89Hz±3Hz and FMAX=665Hz±197Hz,
corresponding to ±14st and 63st±5st, and the number of semitones from the vocal range
(VE=34st±6st). We also analyzed the values of the usual fundamental frequency (F0) of the sustained
vowel “a” from the 15 participants who underwent
phonetography, where the average value was
F0=111,26Hz±15,24Hz. Such information is
presented in Table 1. For the analysis of the fundamental usual
frequency, the voices of individuals were recorded in
a computer through the Sound Forge 7.0 program. The recorded speech sample was the sustained
vowel “a” in normal tone and intensity, analyzed
in the program Multi Dimensional Voice Program
(MDVP) by Kay Elemetrics.
The average values of the fundamental
frequency, minimum and maximum frequencies, vocal range, minimum and maximum intensities, maximum dynamic range and the phonetogram
area were obtained by the results that are provided
by the VRP program, and the average of the funda
-mental usual frequency by the MDVP program.
This study complied every ethical standard advo-cated for research involving human beings, having received approval from the Ethics Committee in Research of the institution where it was conducted, case number 88/2006. The subjects were informed
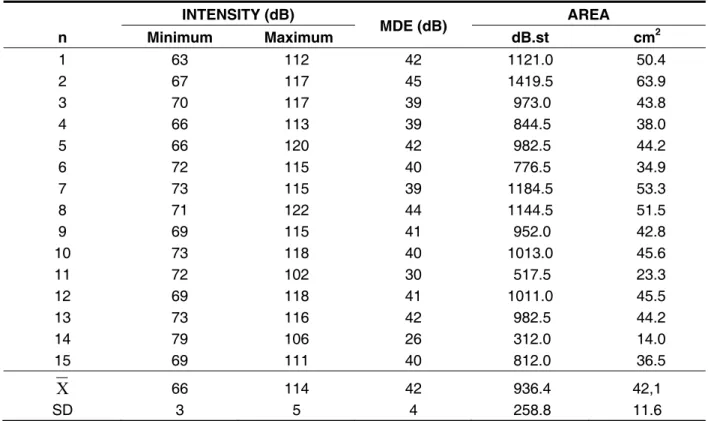
as well as the values of the phonetogram area (936.4dB.st±258.8dB.st or 42.1cm2±12.6cm2),
shown in Table 2.
We obtained the phonetography values related to minimum intensity, maximum intensity, repre -sented by IMIN=66dB±3dB and IMAX=114dB±5dB, respectively, and MDE, corresponding to 42±4dB,
N
FUNDAMENTAL FREQUENCY VOCAL
EXTENSION Minimum Maximum Usual
(Hz) (st) (Hz) (st) (Hz) (st)
1 78 27 622 63 104,48 36
2 78 27 784 67 93,54 40
3 87 29 880 69 97,08 40
4 93 30 784 67 115,86 37
5 117 34 659 64 131,63 30
6 78 27 523 60 107,09 33
7 78 27 698 65 85,92 38
8 98 31 988 71 123,53 40
9 87 29 831 68 120,28 39
10 78 27 698 65 99,03 38
11 117 34 440 57 122,75 23
12 82 28 659 64 113,36 36
13 104 32 698 65 136,63 33
14 93 30 294 50 123,38 20
15 69 25 415 56 94,28 31
89 29 665 63 111,26 34
SD
X
3 14 179 5 15,24 6(FMIN=88,89±13,73Hz and FMAX=760,96±167,17Hz)14,
another which studied voice with training for singing and untrained (FMIN=86,1Hz±14,01Hz and FMAX=785,4Hz±188,38Hz)9, and similar to those of
patients with relux laryngitis and normal subjects
(FMIN=83±10,9Hz and FMAX=696,6±106,2Hz)8.
Although these studies do not address the Brazilian
population, with the exception of a study14 and do
not take into account the facial typology and dento--occlusal harmony, the values were similar.
The average of the vocal extension obtained in this study (VE=34st±6st) is consistent with that
described for the non-professional men singers
without changing voice (VE=37st)11; voices of trained
and untrained individuals (VE=34,1st)6, and two
other studies already mentioned (VE=37±4,70st)14,
(VE=36,6±2,9st)8. However, the results of the
present study was higher than the average obtained
by another work (VE=19,7±2,54st)23 which may be
related to the methodology applied, as in this study, the patients underwent computerized automated phonetographs without the presence of the
evalu- DISCUSSION
The phonetography is a measure capable of recording all laryngeal possibilities regarding the
frequency and vocal intensity, as it covers sounds more acute and severe that the human larynx is
able to produce and the highest and lowest intensi-ties generated during the emission of a vowel2,13,24,25.
Despite the importance of the exam, no studies
were found related to the reference values of the
voice range proile in Brazilian Portuguese speakers
without voice disorders in the young-adult age group, with dentofacial balanced conditions. Thus, in the present study it was performed an acoustic evaluation of the voice in Brazilian Portuguese male speakers, after voice change, no alteration or vocal training, who had the Standard I kind of face and dento-occlusal harmony.
The frequency measures were analyzed in the extremes of the vocal range by computed
phonetography. In regards to the averages of
the minimum frequency (F n
INTENSITY (dB)
MDE (dB) AREA
Minimum Maximum dB.st cm2
1 63 112 42 1121.0 50.4
2 67 117 45 1419.5 63.9
3 70 117 39 973.0 43.8
4 66 113 39 844.5 38.0
5 66 120 42 982.5 44.2
6 72 115 40 776.5 34.9
7 73 115 39 1184.5 53.3
8 71 122 44 1144.5 51.5
9 69 115 41 952.0 42.8
10 73 118 40 1013.0 45.6
11 72 102 30 517.5 23.3
12 69 118 41 1011.0 45.5
13 73 116 42 982.5 44.2
14 79 106 26 312.0 14.0
15 69 111 40 812.0 36.5
X
66 114 42 936.4 42,1SD 3 5 4 258.8 11.6
between all points of the lower and upper curve of the graph, the average obtained in this study was greater than those probably due to the results
related to the frequency6 and intensity23 also being
higher, relecting the graph area.
Although the literature did not appear to consider the condition of dentofacial individuals, the results
were similar to the VE6, 8,11,14 and MDE6,8,14,23,
sugges-ting that the anatomical aspects of the
stomatogna-thic system does not inluence such vocal acoustic parameters. Moreover, according to the indings of this study, the fundamental frequency, minimum and maximum intensity, and the phonetogram area can be inluenced by the position of articulators,
which have intrinsic relationship with the laryngeal speech function.
In the literature, no studies were found that consi-dered the acoustic vocal anatomical conditions of the face and occlusion in men. Although the studies presented did not consider the condition of dentofa-cial individuals, some results were similar.
In Brazil, there are no studies of standardized reference values for men, despite the phoneto-graphy be used as an instrument for voice evalua-tion. It is suggested that the phonetography be used in other studies to continue the investigation of the possible relationship of vocal parameters in various facial typologies and dento-occlusal relationships.
CONCLUSION
This research allowed us to study the proile of the
vocal range of individuals with dentofacial balance after voice change through phonetography. The
averages from the usual, minimum and maximum frequency were Fo=111,26Hz (29st), FMIN=89Hz
(63st) and FMAX 665Hz, respectively, the average vocal range of 34st and average values of minimum
and maximum intensities and maximum dynamic
range of IMÍN=66dB, IMÁX=114dB and EDM=42dB, and an average area of phonetogram of 936.4 dB.st (42.1 cm2).
ACKNOWLEDGEMENTS
We would like to thank the FAPESP – Fundação de Amparo à Pesquisa do Estado de São Paulo
(Foundation of Research Support from the State
of São Paulo), for the inancial support through the scientiic initiation scholarship.
of F0 in Brazilian Portuguese speaking men and without vocal alterations, it was observed that the result was similar to a study (F0=109,05)14. On the
other hand, other studies have found fundamental
frequency higher than those obtained in the present
study, in normal voices (F0=120Hz)26;
standardi-zing the fundamental frequency in a developed
program by the Engineering School of São Carlos (F0=127,61Hz)27, and to analyze the operation and
the type of voice in different microphone positions (F0=130,19Hz)28. The difference suggests that the
dentofacial condition can inluence the position of the larynx, and also in the fundamental frequency.
In a study conducted after orthognathic surgery it
was reported that the change in facial proile of the patient led to changes in the fundamental frequency
of the voice and the positioning of the hyoid bone after surgery29.
Considering the average values obtained for the
minimum and maximum intensity (IMIN=66dB±3dB and IMAX=114dB±5dB), the values were similar to those of two other studies (IMIN=66±3,48dB and IMAX=118±2,62dB)14 and (I
MIN=67,6±2,41dB and
IMAX=115,5±3,84dB)23, but were higher than others
(IMiN=46,6dB±5,74dB and IMaX=100,3dB±5,57dB)9,
(IMiN=46,2±0,4dB and IMAX=95,4±3,7dB)8 and
(IMiN=50,9dB and IMAX=97,3dB)6 indicating that the
presence of dentofacial equilibrium can facili -tate not only the articulation of the headphones, but also the phonation process, allowing to reach
higher maximum and minimum intensities, through
increased air pressure during phonation, as well as better laryngeal control of the passage of air current30, 31. However, such hypotheses should be
tested in future studies, by comparing groups of indi-viduals with dentofacial balanced condition to those with dentofacial deformities.
As for MDE, the result of this study (MDE=42dB±4dB) was also similar to reported rates previously described (MDE=46±3,68dB)14,
(MDE =44,2±5,85dB)23, (MDE =49,2±3,5dB)8 and
(MDE =46,5dB)6, but lower than what was found in
another study (MDE =58dB)11, that held evidence of distinct phonation tasks employed in the present study.
As to the measure of the phonetogram area the average value (area=936,4dB.st±258,8dB.
st or area=42,1cm2±11,6 cm2) was similar to
studies described (area=51,9±8,85cm2)14 and
(area=955,5±100,1dB.st)8, but higher than others
(area=568,3±146,58dB.st)23, (area=27,6cm2)6, and
in dysphonic and normal individuals (area=25,7cm2)7.
10. Chen SH. Voice range proile of Taiwanese
normal young adults: a preliminary study. Zhonghua
Yi Xue Za Zhi (Taipei). 1996;58(6):414-20.
11. Hacki T. Vocal capabilities of nonprofessional
singers evaluated by measurement and superimposition of their speaking, shouting and
singing voice range proiles. HNO. 1999;47:809–15.
12. Leino T, Laukkanen AM, Ilomäki I, Mäki E.
Assessment of vocal capacity of innish university
students. Folia Phoniatr Logop. 2008;60(4):199-209. Epub 2008 May 19.
13. Teles-Magalhaes LC, Pegoraro-Krook MI, Pegoraro R. Study of the elderly females’ voice by
phonetography. J Voice. 2000;14(3):310-21.
14. Oliveira CF. Características biológicas e vocais durante o desenvolvimento vocal masculino nos períodos pré, peri e pós-muda vocal. Tese (Mestrado em Bioengenharia) – Programa de Pós–
Graduação Interunidades em Bioengenharia da
USP. São Carlos, 2007
15. Dimitriev L, Kiselev A. Relationship between the formant structure of different types of supraglottic cavities. Folia Phoniat. 1979;32:238-41.
16. Oliveira VL, Pinho SMR. A qualidade da voz
e o trato vocal nos indivíduos de face curta e face longa. In: PINHO, S.M.R. Tópicos em voz. Rio de Janeiro: Guanabara Koogan, 2001.
17. Garcia RAS, Campiotto AR. Distúrbios vocais
x distúrbios musculares orais: possíveis relaçöes.
Pró-fono. 1995;7(2):33-9.
18. Ringel RL, Chodzko-Zajko WJ. Vocal indices of REFERENCES
1. Damsté PH. The phonetogram. Pract. Otorhinolaryng. 1970;32:185-7.
2. Schutte HK, Seidner W. Recommendation by
the Union of European Phoniatricians (UEP), Folia-Phoniatr-(Basel). 1983;35(6):286-8.
3. Montojo J, Garmendia G, Cobeta I. Comparación entre los resultados del fonetograma manual y el fonetograma automático. Acta Otorrinolaringol Esp. 2006;57:313-8.
4. Holmberg EB, Ihre E, Sodersten M. Phonetograms as a tool in the voice clinic: changes across voice therapy for patients with vocal fatigue. Logoped
Phoniatr Vocol. 2007;32(3):113-27.
5. Ma E, Robertson J, Radford C, Vagne S, El-Halabi R, Yiu E. Reliability of speaking and maximum voice range measures in screening for dysphonia. J Voice.
2007;21(4):397-406. Epub 2006 May 5.
6. Siupsinskiene N. Quantitative analysis of
professionally trained versus untrained voices. Medicina. 2003;39(1): 36-46.
7. Ikeda Y, Masuda T, Manako H, Yamashita
H, Yamamoto T, Komiyama S. Quantitative evaluation of the voice range proile in patients
with voice disorder. Eur Arch Otorhinolaryngol. 1999;256:S51-5.
8. Pribuisiene R, Uloza V, Saferis V. Multidimensional voice analysis of relux laryngitis patients. Eur Arch
Otorhinolaryngol. 2005;262(1):35-40.
RESUMO
Objetivo: caracterizar, por meio de fonetograia, o peril da extensão vocal em indivíduos sem alte
-rações pós-muda vocal e equilíbrio dentofacial. Método: participaram deste estudo 15 homens
com idades entre 14 e 35 anos com pós-muda vocal. Eles responderam a um questionário espe
-cíico, e também foram submetidos a uma avaliação antropométrica da face, a avaliação dento
--oclusal, o exame fonetograia e também a uma análise da frequência fundamental habitual da voz.
Resultados: frequência fundamental mínima: 89Hz ± 3Hz ou 29st ±14st; Frequência fundamental
máxima: 665Hz±179Hz ou 63st±5st; Extensão Vocal: 34st±6st; Intensidade mínima: 66 dB ± 3dB; Intensidade máxima: 114dB ± 5dB; Extensão Dinâmica Máxima: 42dB ± 4dB, Área do Fonetograma:
936,4 dB.st ± 258,8 dB.st ou 42,1 cm2 ± 11,6 cm2; Frequência Fundamental Habitual para a vogal
“a”: 111,26 Hz ± 15,24 Hz. Conclusão: apesar de os estudos nacionais e internacionais
apresen-tados neste trabalho não considerarem a condição dentofacial dos indivíduos, os resulapresen-tados foram
semelhantes.
vozes normais. Rev Bras Otorrinolaringol. 2006;72(5):145-9.
27. Araújo SA, Grellet M, Pereira JC, Rosa MO.
Normatização de medidas acústicas da voz normal.
Rev Bras Otorrinolaringol. 2002;68(4):540-4.
28. Fukuyama E. Análise acústica da voz captada
na faringe próximo à fonte glótica através de microfone acoplado ao ibrolaringoscópio. Rev Bras
Otorrinolaringol. 2001;67(6):776-86.
29. Jorge TM, Brasolotto AG, Gonçales ES, Filho HN, Berretin-Felix G.. Inluence of orthognathic surgery on voice fundamental frequency. J Craniofac
Surg. 2009 Jan;20(1):161-4.
30. Behlau M, Dragone MLS, Nagano L. Voz
saudável e disfonia. In: Behlau M, Dragone MLS,
Nagano L. A voz que ensina: o professor e a comunicação oral em sala de aula. Rio de Janeiro:
Revinter; c2004. p.5-15.
31. Santos CC, Mituuti CT, Berretin-Felix G, Teles LCS. Características da fonetograia em mulheres com equilíbrio dentofacial. Rev Soc Bras
Fonoaudiol. 2010;15(4):584-8. 20. Reis SAB, Abrão J, Filho LC, Claro CAA.
Análise facial numérica do peril de brasileiros
Padrão I. R Dental Press Ortodon Ortop Facial. 2006;11(6):24-34.
21. Angle EH. Classiication of malocclusion. Dent.
Cosmos. 1899;41(3):248-64.
22. Langlade M. Diagnóstico Ortodôntico. São Paulo: Editora Santos; 1995.
23. Titze IR, Wong D, Milder MA, Hensley SR,
Ramig LO. Comparison between clinician-assisted and fully automated procedures for obtaining a voice
range proile. J Speech Hear Res. 1995;38:526-35. 24. Wuyts FL, Heylen L, Mertens F, Du Caju M, Rooman R, Van De Heyning PH, et al. Effects of age, sex, and disorder on voice range proile
characteristics of 230 children. Ann Otol Rhinol Laryngol. 2003;112(6):540-8.
25. Camargo TF, Barbosa DA, Teles LCS.
Características da fonetograia em coristas de diferentes classiicações vocais. Rev Soc Bras
Fonoaudiol. 2007;12(1):10-7.
26. Felippe CAN, Grillo MHMM, Grechi TH.
Normatização de medidas acústicas para
Received on: September 22, 2011 Accepted on: February 16, 2012
Mailing address:
Giédre Beretin-Félix
Departamento de Fonoaudiologia Al. Dr. Octávio Pinheiro Brizolla, 9-75 –
Vila Universitária – Bauru, SP – Brasil
CEP: 17012-901