CROP AREA ESTIMATE FROM ORIGINAL AND
SIMULATED SPATIAL RESOLUTION DATA AND
LANDSCAPE METRICS
Dênis de Moura Soares1; Lênio Soares Galvão2*; Antônio Roberto Formaggio2
1
INPE - Programa de Pós-Graduação em Sensoriamento Remoto. 2
INPE - Divisão de Sensoriamento Remoto, C.P. 515 - 12245-970 - São José dos Campos, SP - Brasil. *Corresponding author <[email protected]>
ABSTRACT: Images acquired at the same day by the ETM+/Landsat-7 (30 m of spatial resolution) and MODIS/Terra (250 m) sensors were used to estimate areas of three major crops (soybean, sugarcane, and corn) with different landscape patterns in Southeastern Brazil. Majority filtering of ETM + classification results was applied to describe the behavior of 15 selected landscape metrics at distinct simulated spatial resolutions (90, 150, 210 and 270 m). By using regression models, the performance of MODIS and derived metrics to predict adequately the crop area, considering ETM+ data as reference, were analyzed. Results showed that the MODIS instrument overestimated the areas of soybean (15%) and sugarcane (1%), and underestimated the area of corn (12%). Multiple regression results indicated that coarse spatial resolution sensors can be used to predict adequately the area viewed by the 30 m spatial resolution instruments only for crops with low fragmentation pattern such as soybean. These sensors cannot be used to predict the area of corn due to aggregation pixel effects of the less fragmented crops (soybean and sugarcane) over the most fragmented one (corn), as demonstrated by the spatial resolution simulation using majority filtering of the ETM+ image. Landscape metrics improved MODIS area estimates only for sugarcane, as indicated by higher values of R2 for multiple than for simple
regression. Only a small set of metrics was select to compose the multiple regression models because most of them were not preserved across different spatial resolutions (30 m and 250 m).
Keywords: MODIS, remote sensing, regression, soybean, sugarcane
ESTIMATIVA DE ÁREA AGRÍCOLA COM DADOS DE RESOLUÇÃO
ESPACIAL ORIGINAL E SIMULADA E MÉTRICAS DE PAISAGEM
RESUMO: Imagens coletadas no mesmo dia pelos sensores ETM+/Landsat-7 (30 m de resolução espacial) e MODIS/Terra (250 m) foram utilizadas para estimar a área de três importantes culturas agrícolas (soja, cana-de-açúcar e milho) com diferentes padrões de paisagem no Sudeste Brasileiro. Filtragem de Maioria dos resultados da classificação da imagem ETM+ foi aplicada para descrever o comportamento de 15 métricas em diferentes simulações de resolução espacial (90, 150, 210 e 270 m). Utilizando modelos de regressão, o desempenho do MODIS e de suas métricas para predizer a área das culturas, considerando os dados ETM+ como referência, foi analisado. Os resultados mostraram que o sensor MODIS superestimou as áreas de soja (15%) e cana-de-açúcar (1%) e subestimou a área de milho (12%). A regressão múltipla indicou que sensores de resolução espacial grosseira podem ser usados para predizer adequadamente a área vista por instrumentos com 30 m de resolução espacial apenas para culturas com baixo padrão de fragmentação como soja. Estes sensores não podem predizer adequadamente a área de milho devido aos efeitos de agregação de pixels das culturas menos fragmentadas (soja e cana-de-açúcar) sobre a mais fragmentada (milho), conforme demonstrado pela simulação da resolução espacial por filtragem de maioria da imagem ETM+. As métricas da paisagem melhoraram as estimativas de área com o MODIS apenas para a cana-de-açúcar, conforme indicado por maiores valores de R2 observados para regressão múltipla do que para regressão simples. Apenas
um número pequeno de métricas foi selecionado para compor os modelos de regressão visto que a maior parte delas não foi preservada entre resoluções espaciais diferentes (30 e 250 m).
Palavras-chave: MODIS, sensoriamento remoto, regressão, soja, cana-de-açúcar
INTRODUCTION
Remote sensing data can be used to obtain
Soares et al.
460
resolution (e.g., Enhanced Thematic Mapper (ETM+)/ Landsat-7) are adequate to estimate croped areas, they usually have a long revisit time of scene (e.g., 16 days) that limits the acquisition of cloud-free images in tropi-cal regions on crititropi-cal dates of crop development. On the other hand, coarse spatial resolution sensors such as MODIS (Moderate Resolution Imaging Spectroradiometer)/Terra with 250 m of resolution (bands 1 and 2) usually have a near daily global cov-erage. However, depending on the spatial pattern of the land cover under analysis, the coarse spatial resolu-tion introduces differences in area estimates from the images in comparison with the 30 m resolution (Nelson & Holben, 1986; Moody, 1998). Errors of area esti-mation with coarse resolution sensors result from ag-gregation effects whose magnitude and scale-depen-dence are related to the proportions of the classes and their landscape pattern (Moody & Woodcock, 1994). The aggregation effects lead to changes in the size and shape of land cover patches and to the disappearance of small objects at critical thresholds of resolution (Mayaux & Lambin, 1995, 1997).
To quantify landscape composition from remote sensing data, a great number of metrics have been pro-posed. The effects of spatial resolution on the perfor-mance of these metrics have been studied by Turner et al. (1989), Saura (2002, 2004), Shen et al. (2004), Wu (2004), Wu et al. (2000, 2002), Frohn & Hao (2006). According to these authors, many landscape metrics are highly correlated and others may not be suitable for di-rect comparison across different spatial resolutions.
Most of the studies that use coarse spatial reso-lution data to estimate land cover areas have analyzed deforested regions (Malingreau & Belward, 1992; Mayaux & Lambin, 1995, 1997; Moody & Woodcock, 1995; Moody, 1998; Ponzoni et al., 2002; Millington et al., 2003; Frohn & Hao, 2006). Only a few investi-gations have addressed the potential use of these data to estimate agricultural areas. Pax-Lenney & Wood-cock (1997) degraded Thematic Mapper (TM)/ Landsat-5 images to simulate different spatial resolu-tions and observed that agricultural lands in Egypt were slightly underestimated at spatial resolutions of 120 m and 240 m when compared to the original 30 m TM/ Landsat-5 area estimates.
The objective of this study was to analyze the sensitivity of coarse spatial resolution data acquired by MODIS (250 m) to estimate areas viewed at the same day by the ETM+/Landsat-7 (30 m) of three major crops (soybean, sugarcane, and corn) with different landscape patterns. Majority filtering of ETM+ classi-fication results was applied to describe the behavior of 15 selected landscape metrics with varying simu-lated spatial resolutions (30 m, 90 m, 150 m, 210 m,
and 270 m). The performance of the 250 m MODIS images and derived metrics to predict adequately the crop area viewed by the 30 m ETM+ data was ana-lyzed using regression models.
MATERIAL AND METHODS
Study Area and Image Classification
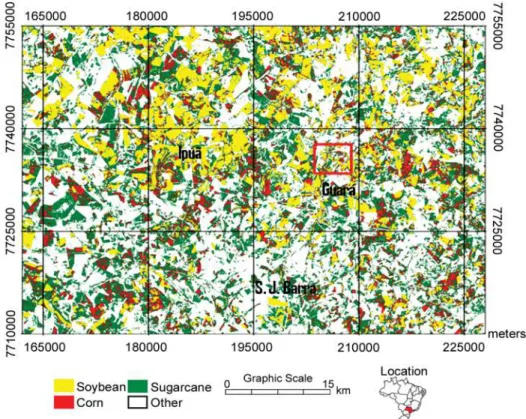
The study area of 46 × 66 km (20º27’ S and 47º56’ W) is located in the north of the São Paulo state (southeastern Brazil) and includes the cities of Ipuã, Guará and São Joaquim da Barra (Figure 1). It was selected due to the occurrence of three important crops with distinct landscape patterns in farm size and agri-cultural activities: soybean (less fragmented), sugar-cane (intermediate), and corn (more fragmented).
ETM+/Landsat-7 and MODIS/Terra (Product MOD09) data were acquired on January 5, 2002. The MODIS Reprojection Tool (MRT) was used to convert the sinusoidal projection into planar coordinates. Landsat data were acquired by Level 1G with geometric cor-rection but Ground Control Points (GCPs) collected by GPS were also used for georeferencing the data.
During the classification phase unsupervised classification was used in order to reduce the effects of subjectivity on data analysis. The k-means technique (Mather, 1999) was applied only over the red and near-infrared bands of both sensors to reduce effects of spectral resolution differences on classification results. The number of classes was set to 15 and the maximum number of iterations to 20, as suggested by Frohn & Hao (2006). At the end, classification results were grouped into four classes: soybean, sugarcane, corn and “other” (not considered in statistical analysis). The ex-istence of previous works in the study area (Epiphanio et al, 2002; Luiz et al., 2002; Sanches, 2004) facilitated also the evaluation of classification results through their comparison with available ground truth information.
Landscape Metrics and Spatial Resolution
c i r t e
M Variable Category Measure
a e r
A Area
e g d E / y t i s n e D / a e r A n o i t i s o p m o C e p a c s d n a L s e h c t a P f o r e b m u
N NP Fragmentation
x e d n I h c t a P t s e g r a
L LPI Dominance
x e d n I e p a h S e p a c s d n a
L LSI Aggregation
I S L d e z i l a m r o
N NLSI Aggregation
a e r A e r o C l a t o
T TCA
a e r A e r o
C Landscape Composition s a e r A e r o C t c n u j s i D f o r e b m u
N NDCA SpatialContiguity
s e i c n e c a j d A e k i L f o e g a t n e c r e
P PLADJ
n o i s r e p s r e t n I / n o i g a t n o C n o i t a g e r g g A x e d n I n o i t i s o p a t x u J & n o i s r e p s r e t n
I IJI Intermixingofclasses
s s e n i p m u l
C CLUMP Adjacency
n o i s i v i D e p a c s d n a
L DIV Diversity
x e d n I g n i t t i l p
S SPLIT Fragmentation
e z i S h s e M e v i t c e f f
E MESH Homogeneity
n o i s n e m i D l a t c a r F a e r A -r e t e m i r e
P PAFRAC Shape Shape Complexity
x e d n I n o i s e h o C h c t a
P COHE Connectivity Connectedness Table 1 - List of the 15 landscape metrics evaluated in this study.
are related to class adjacency or intermixing effects. Finally, the shape metric indicates the relationship be-tween area and perimeter of the class polygons, whereas the connectivity metric expresses the level of cohesion between them. All metrics were calculated using the Fragstats software (McGarigal & Marks, 1995) over unsupervised k-means classification of original and simulated ETM+ and MODIS images. For
the calculation of core area metrics, an edge depth of two pixels was chosen.
A very useful method to analyze the behavior of landscape metrics with change in spatial resolution is to degrade maps by using a majority rule filter. In this study, majority filtering, a common procedure used to scale landscape maps to coarser spatial resolutions (e.g., Saura, 2004; Frohn & Hao, 2006), was applied Figure 1 - Unsupervised k-mean classification of the ETM+/Landsat-7 image for the three major crops under analysis. The red inset area
Soares et al.
462
over unsupervised classification results of the ETM+/ Landsat-7 image using window sizes of 3 × 3, 5 × 5, 7× 7 and 9 × 9 pixels. In practice, this procedure was equivalent to degrade progressively the thematic clas-sification map from 30 m of spatial resolution to 90, 150, 210, and 270 m, respectively. After calculating the 15 metrics with the Fragstats software, results were plotted and analyzed as a function of the four spatial resolution simulation.
Regression Analysis of Original ETM+ and MODIS Data
Regression analysis provides a means for as-sessing the relationships between landscape pattern and errors in the estimates of land cover areas as land cover data are aggregated to coarser scales (Moody & Woodcock, 1995). In this study, to predict the area of crops viewed by the ETM+ 30 m from MODIS 250 m data and to improve area estimates from coarse reso-lution data, multiple regression analysis was used. Area and the other remaining 14 metrics (independent or explanatory variables) calculated from MODIS data were plotted against area values obtained from ETM+ (response or dependent variable). The following cri-teria were used to select the best subset of metrics to compose a multiple regression model: Mallow’s Cp, R2
p
(R-squared) and R2
a (adjusted R-squared) (Neter et al.,
1996). Before the selection of variables, an explana-tory analysis was carried out to test data normality (Shapiro & Wilk, 1965) and to detect outliers (DFFITS) and multicollinearity (Variation Inflation Fac-tor – VIF) between the variables. Based on this ex-planatory analysis, the need of variable transformations (e.g., square root of values) was considered in the re-gression procedure. Analysis of Variance (ANOVA) was performed and the Levene test was used to analyze the variance of the residuals.
For the calculation of the metrics, including area, the MODIS and ETM+ images were divided into a regular grid (15 × 15 pixels for MODIS; 125 × 125 pixels for ETM+) of 648 cells (216 cells per crop), following the procedure described by Mayaux & Lambin (1995). From the total of 648 cells, 528 cells were randomly selected to obtain the general (all crops together) and specific (176 cells per crop) regression models. The remaining 120 cells (40 per crop) were used to validate the models. At the end, a t-test was applied to evaluate the statistical significance of the models (0.95 confidence level).
RESULTS AND DISCUSSION
Unsupervised Classification and Landscape Metrics
Unsupervised k-means classification results of
the ETM+ image for the three crops under analysis are shown in Figure 1. The class “Other” is dominated by pasture, bare soils and natural vegetation cover. Soybean, sugarcane and corn represented 87% of the cultivated lands of the study area in the date of image acquisition. In comparison with sugarcane and soy-bean, corn occurs in very small fields (Figure 1).
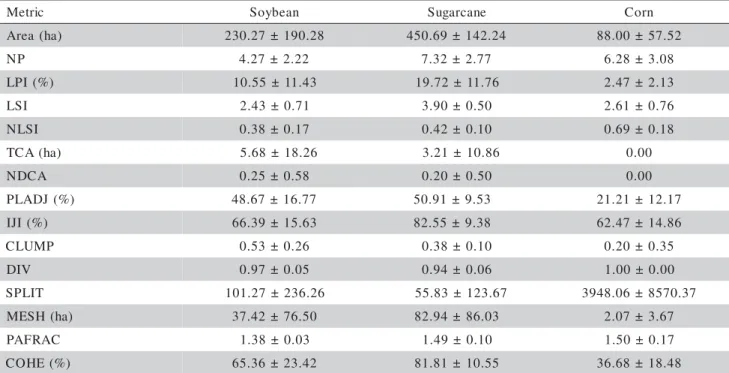
Average measures of landscape composition and dominance (TCA and LPI), aggregation (PLADJ), homogeneity (MESH) and connectedness (COHE) de-creased from soybean/sugarcane to corn since this was the most fragmented class (Table 2). The largest SPLIT values were observed for corn. The less fragmented crop was soybean, whereas corn was the most frag-mented one (Table 2). Sugarcane is the dominant crop in the area, presenting larger average area values in the cells than the other two crops.
Landscape Metrics and Spatial Resolution
To facilitate the graphic representation of pixel aggregation effects with degraded spatial resolution, Figure 2 presents majority filtering results of the ETM+ unsupervised classification map only for the small in-set area (red rectangle) indicated in Figure 1. From 30 m to 270 m, aggregation effects of some large crop polygons that clumped others and became less frag-mented can be observed. In general, small polygons of corn became gradually smaller and disappeared completely at coarser spatial resolutions. Such results are consistent with previous investigations (e.g., Mayeaux & Lambin, 1997; Moody, 1998; Frohn & Hao, 2006), which have shown that the less frag-mented classes (soybean and sugarcane in this study) tend to aggregate the more fragmented ones (corn).
Regression Analysis of ETM+ and MODIS Data
The comparison between crop area estimates from ETM+ and MODIS data is shown in Figure 4. MODIS overestimated the areas of soybean (15%) and sugarcane (1%) viewed by ETM+ and underestimated the area of corn (12%) due to aggregation pixels ef-fects of soybean and sugarcane over corn.
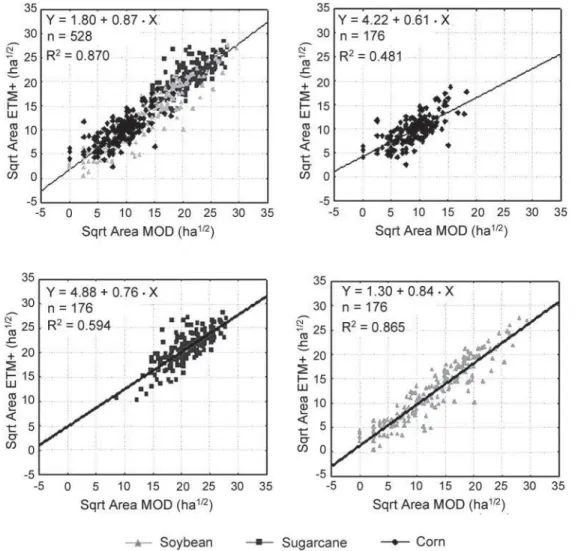
The relationships between area estimates from both sensors are illustrated in Figure 5a for all crops and in Figures 5b, 5c and 5d for corn, sugarcane and soybean, respectively. Results refer to the 528 cells selected to obtain the regression model. Since the Shapiro-Wilk test indicated non-normality of the vari-able area, results were expressed in square root of area, that presented a normal distribution after this transfor-mation. The overall relationship of Figure 5a is in fact a superposition of distinct relationships for each crop (Figures 5b, 5c and 5d). Thus, each crop is differ-ently affected by scaling up, as indicated by the three clusters of symbols in Figure 5a. The coefficients of determination (R2) decreased from the less fragmented
(soybean; Figure 5d) to the most fragmented crop (corn; Figure 5b), which anticipated the difficulties of MODIS (250 m) to estimate adequately corn areas in relation to the ETM+ (30 m) performance.
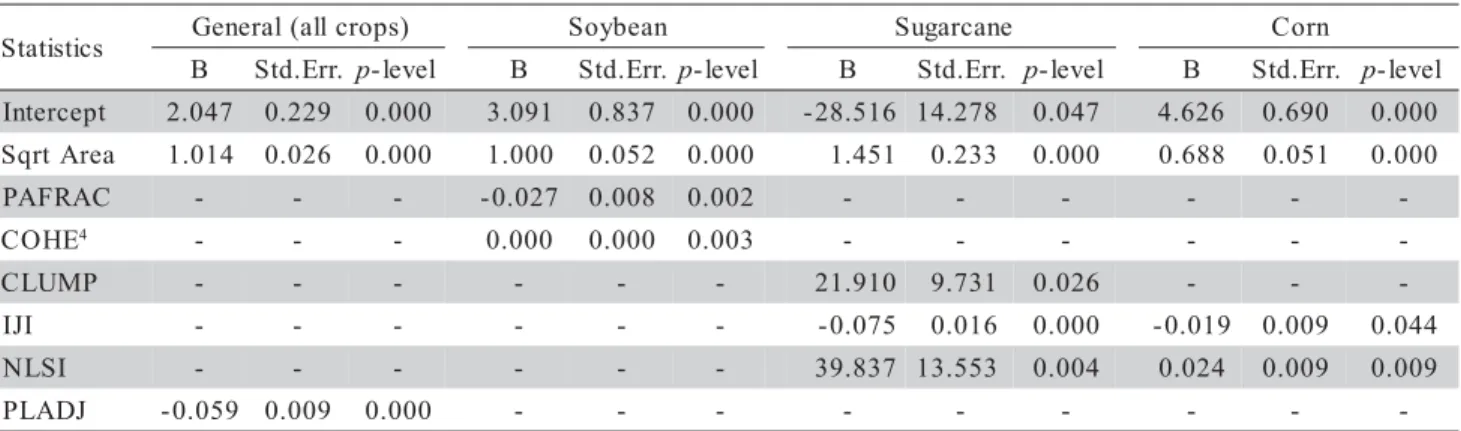
Statistical parameters for the general (all crops) and specific (per crop) multiple regression models are presented in Table 3. Besides the square root of area, (NP = Number of Patches, LPI = Largest Patch Index, LSI = Landscape Shape Index, NLSI = Normalized LSI, TCA = Total Core Area, NDCA = Number of Disjunct Core Areas, PLADJ = Percentage of Like Adjacencies, IJI = Interspersion & Juxtaposition Index, CLUMP = Clumpiness, DIV = Landscape Division, SPLIT = Splitting Index, MESH = Effective Mesh Size, PAFRAC = Perimeter-Area Fractal Dimension, COHE = Patch Cohesion Index)
Table 2 - Average and standard deviation of the 15 metrics calculated from MODIS/Terra data, 216 cells per crop.
c i r t e
M Soybean Sugarcane Corn
) a h ( a e r
A 230.27 ±190.28 450.69±142.24 88.00 ±57.52
P
N 4.27±2.22 7.32±2.77 6.28 ±3.08
) % ( I P
L 10.55±11.43 19.72±11.76 2.47 ±2.13
I S
L 2.43±0.71 3.90±0.50 2.61 ±0.76
I S L
N 0.38 ±0.17 0.42±0.10 0.69 ±0.18
) a h ( A C
T 5.68±18.26 3.21±10.86 0.00
A C D
N 0.25 ±0.58 0.20±0.50 0.00
) % ( J D A L
P 48.67±16.77 50.91±9.53 21.21 ±12.17
) % ( I J
I 66.39 ±15.63 82.55±9.38 62.47 ±14.86
P M U L
C 0.53 ±0.26 0.38±0.10 0.20 ±0.35
V I
D 0.97 ±0.05 0.94±0.06 1.00±0.00
T I L P
S 101.27±236.26 55.83±123.67 3948.06 ±8570.37 )
a h ( H S E
M 37.42 ±76.50 82.94±86.03 2.07 ±3.67
C A R F A
P 1.38±0.03 1.49 ±0.10 1.50±0.17
) % ( E H O
C 65.36 ±23.42 81.81±10.55 36.68 ±18.48
Soares et al.
464
the following MODIS-derived metrics were selected based on the Mallow’s Cp, R2
p(R-squared) and R 2
a
(ad-justed R-squared) criteria: PLADJ (general model); PAFRAC and COHE (soybean); CLUMP, IJI and NLSI (sugarcane); IJI and NLSI (corn). Thus, from the 15 metrics considered in the analysis, besides area, only six were selected to compose the models. An inspec-tion of the correlainspec-tion coefficients between MODIS-and ETM+ derived metrics had correlation values lower than 0.5 for the metrics that did not enter in the mod-els. Thus, in general, they were not preserved across
(PAFRAC = Perimeter-Area Fractal Dimension, COHE = Patch Cohesion Index, CLUMP = Clumpiness, IJI = Interspersion & Juxtaposition Index, NLSI = Normalized LSI, PLADJ = Percentage of Like Adjacencies)
Table 3 - Multiple regression parameters for the general (all crops) and specific multiple regression models.
s c i t s i t a t
S General(allcrops) Soybean Sugarcane Corn
B Std.Err. p-level B Std.Err. p-level B Std.Err. p-level B Std.Err. p-level
t p e c r e t n
I 2.047 0.229 0.000 3.091 0.837 0.000 -28.516 14.278 0.047 4.626 0.690 0.000
a e r A t r q
S 1.014 0.026 0.000 1.000 0.052 0.000 1.451 0.233 0.000 0.688 0.051 0.000
C A R F A
P - - - -0.027 0.008 0.002 - - -
-E H O
C 4 - - - 0.000 0.000 0.003 - - - - -
-P M U L
C - - - 21.910 9.731 0.026 - -
-I J
I - - - -0.075 0.016 0.000 -0.019 0.009 0.044
I S L
N - - - 39.837 13.553 0.004 0.024 0.009 0.009
J D A L
P -0.059 0.009 0.000 - - -
-different spatial resolutions from ETM+ (30 m) to MODIS (250 m). The models presented in Table 3 were statistically significant and neither influential out-liers nor inconstancy in variance were observed. The validation process with 120 cells indicated also the re-liability of the models with most of the points close to the 1:1 line.
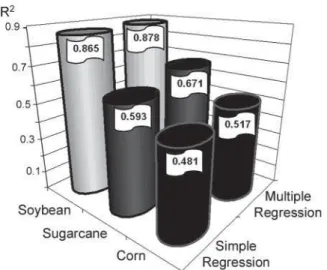
Figure 6 allows a better comparison of the role played by the landscape metrics to improve area-based regression models. For the less fragmented crop (soy-bean), the R2 values slightly improved from simple
(PAFRAC = Perimeter-Area Fractal Dimension, COHE = Patch Cohesion Index, PLADJ = Percentage of Like Adjacencies, TCA = Total Core Area).
(Area_ETM+ and Area_MODIS) to multiple (Area_ETM+ and Area_MODIS plus Metrics) regres-sion models. Among the three crops, soybean presented the largest R2 values (0.865 and 0.878). This result
in-dicated that MODIS (250 m of spatial resolution) can be used to estimate adequately soybean areas when
compared with ETM+ (30 m) without the need of other metrics than area. The best results of the use of metrics (CLUMP, IJI and NLSI) were observed for sugarcane, which presented an improvement of R2
val-ues from 0.593 (simple regression model) to 0.671 (multiple regression model). For the most fragmented crop (corn), R2 values were still low for the simple
and multiple regression models. This indicated the low performance of MODIS and their landscape metrics to improve area estimation of corn when compared with ETM+.
FINAL REMARKS
In relation to the ETM+ area estimates, the MODIS instrument overestimated the areas of soybean and sugarcane, and underestimated that of corn. Coarse spatial resolution sensors (e.g., MODIS/Terra, 250 m) can be used to predict agricultural areas with similar precision to the 30 m spatial resolution instruments (e.g., ETM+/Landsat-7) only for crops with low frag-mentation pattern such as soybean. This crop
pre-Figure 5 - Relationships between square root of the area calculated from ETM+/Landsat-7 and MODIS/Terra images for (a) all crops; (b) corn; (c) sugarcane; and (d) soybean. The relationships are significant for p < 0.001.
Soares et al.
466
sented the largest R2 value in the multiple regression
model (0.878).
The use of landscape metrics improved MO-DIS area estimates using multiple regression only for sugarcane (intermediary fragmentation pattern), as ex-pressed by an increase in R2 values from 0.593
(Area_ETM+ versus Area_MODIS in simple
regres-sion) to 0.671 (Area_ETM+ versus Area_MODIS plus
Metrics in multiple regression). The performance of the metrics was also poor for corn, the most frag-mented crop, whose area cannot adequately be esti-mated by coarse spatial resolution sensors. Less frag-mented crops (soybean and sugarcane) aggregated the most fragmented one (corn), as also indicated by the results of spatial resolution simulation with majority fil-tering of ETM+ images.
From the 15 metrics under analysis, besides area, only six were statistically selected to compose the regression models. Some metrics were highly cor-related and others were not preserved across differ-ent spatial resolutions, as indicated by low correlation values between MODIS and ETM+ derived metrics, the most important factor of variable exclusion in the regression models.
ACKNOWLEDGEMENTS
To José Carlos Neves Epiphanio, Alfredo José Barreto Luiz and Ieda Del´Arco Sanches for provid-ing the data for analysis and to the anonymous review-ers for their useful suggestions. To CNPq for grants 305600/2006-0 and 300698/2005-4.
REFERENCES
COPPEDGE, B.R.; ENGLE, D.M.; FUHLENDORF, S.D.; MASTERS, R.E.; GREGORY, M.S. Landscape cover type and pattern dynamics in fragmented southern Great Plains grasslands, USA.Landscape Ecology, v.16, p.677-690, 2001.
EPIPHANIO, J.C.N.; LUIZ, A.J.B.; FORMAGGIO, A.R. Estimativa de áreas agrícolas municipais, utilizando sistema de amostragem simples sobre imagens de satélite. Bragantia,v.61, p.187-197, 2002.
FROHN, R.C.; HAO, Y. Landscape metric performance in analyzing two decades of deforestation in the Amazon Basin of Rondonia, Brazil. Remote Sensing of Environment, v.100, p.237-251, 2006.
LUIZ, A.J.B.; OLIVEIRA, J.C.; EPIPHANIO, J.C.N.; FORMAGGIO, A.R. Auxílio das imagens de satélite aos levantamentos por amostragem em agricultura. Agricultura em São Paulo, v.49, p.49-54, 2002.
MALINGREAU, J.P.; BELWARD, A.S. Scale considerations in vegetation monitoring using AVHRR data. Inter-national Journal of Remote Sensing, v.13, p.2289-2307, 1992.
MATHER, P.M. Computer processing of remotely-sensed images:an introduction. 2.ed. West Sussex: John Wiley, 1999. 292p.
MAYAUX, P.; LAMBIN, E.F. Estimation of tropical forest area from coarse spatial resolution data: a two-step correction function for proportional errors due to spatial aggregation.Remote Sensing of Environment, v.53, p.1-15, 1995.
MAYAUX, P.; LAMBIN E.F. Tropical forest area measured from global land-cover classifications: inverse calibration models based on spatial textures. Remote Sensing of Environment, v.59, p.29-43, 1997.
McGARIGAL, K.; MARKS, B.J. FRAGSTATS: spatial pattern analysis program for quantifying landscape structure. Portland: USDA Forest Service, 1995. 122p. (Technical Report PNW-GTR-351 - USDA).
MILLINGTON, A.C.; VELEZ-LIENDO, X.M.; BRADLEY, A.V. Scale dependence in multitemporal mapping of forest fragmentation in Bolivia: implications for explaining temporal trends in landscape ecology and applications to biodiversity conservation. ISPRS International Journal of
Photogrammetry and Remote Sensing, v.57, p.289-299,
2003.
MOODY, A. Using landscape spatial relationships to improve estimates of land-cover area from coarse resolution remote sensing. Remote Sensing of Environment, v.64, p.202-220, 1998.
MOODY, A.; WOODCOCK, C.E. Scale-dependent errors in the estimation of land-cover proportions - implications for global land-cover datasets. Photogrammetric Engineering and Remote Sensing, v.60, p.585-594, 1994.
MOODY, A.; WOODCOCK, C.E. The influence of scale and the spatial characteristics of landscapes on land-cover mapping using remote sensing. Landscape Ecology, v.10, p.363-379, 1995. NELSON, R.; HOLBEN, B. Identifying deforestation in Brazil using multiresolution satellite data. International Journal of Remote Sensing, v.7, p.429-448, 1986.
NETER, J.; KUTNER, M.N.; NACHTSSHEIM, C.J.; WASSERMAN, W. Applied linear statistical models. 4.ed. Boston: McGraw-Hill, 1996. 791p.
PAX-LENNEY, M.; WOODCOCK, C.E. The effect of spatial resolution on the ability to monitor the status of agricultural lands.Remote Sensing of Environment, v.61, p.210-220, 1997.
PONZONI, F.J.; GALVÃO, L.S.; EPIPHANIO, J.C.N. Spatial resolution influence on the identification of land cover classes in the Amazon environment. Anais da Academia Brasileira de Ciências, v.74, p.717-725, 2002.
Figure 6 - Variations of coefficient of the determination (R2) for
SANCHES, I.D. Sensoriamento remoto para o levantamento espectro-temporal e estimativa de área de culturas agrícolas. São José dos Campos: INPE, 2004. 172p. Dissertação (Mestrado).
SAURA, S. Effects of minimum mapping unit on land cover data spatial configuration and composition. International Journal of Remote Sensing, v.23, p.4853-4880, 2002.
SAURA, S. Effects of remote sensor spatial resolution and data aggregation on selected fragmentation indices. Landscape Ecology, v.19, p.197-209, 2004.
SHAPIRO, S.S.; WILK, M.B. An analysis of variance test for normality (complete samples). Biometrika, v.52, p.591-611, 1965.
SHEN, W.; JENERETTE, G.D.; WU, J.; GARDNER, R.H. Evaluating empirical scaling relations of pattern metrics with simulated landscapes. Ecography, v.27, p.459-469, 2004. SIMÕES, M.D.; ROCHA, J.V.; LAMPARELLI, R.A.C. Growth
indices and productivity in sugarcane. Scientia Agricola, v.62, p.23-30, 2005.
TURNER, M.G.; O’NEILL, R.V.; GARDNER, R.H.; MILNE, B.T. Effects of changing spatial scale on the analysis of landscape pattern. Landscape Ecology, v.3, p.153-162, 1989.
WU, J.; SHEN, W.; SUN W.; TUELLER, P.T. Empirical patterns of the effects of changing scale on landscape metrics. Landscape Ecology, v.17, p.761-782, 2002.
WU, J. Effects of changing scale on landscape pattern analysis: Scaling relations. Landscape Ecology, v.19, p.125-138, 2004. WU, J.; JELINSKI, D.E.; LUCK, M.; TUELLER, P. Multiscale analysis of landscape heterogeneity. Geographic Information Sciences, v.6, p.6–19, 2000.
XAVIER, A.C.; RUDORF, B.F.T.; MOREIRA, M.A.; ALVARENGA, B.S.; FREITAS, J.G.; SALOMON, M.V. Hyperspectral field reflectance measurements to estimate wheat grain yield and plant. Scientia Agricola, v.63, p.130-138, 2006.