Adv. Sci. Res., 8, 121–127, 2012 www.adv-sci-res.net/8/121/2012/ doi:10.5194/asr-8-121-2012
©Author(s) 2012. CC Attribution 3.0 License.
Advances
in
Science & Research
Open Access Proceedings
EMS
Ann
ual
Meeting
and
10th
European
Conf
erence
on
Applications
of
Meteorology
(ECAM)
2011
Comparative verification of different nowcasting systems
to support optimisation of thunderstorm warnings
K. Wapler1,2, M. Goeber1,3, and S. Trepte1 1
Deutscher Wetterdienst, Offenbach, Germany 2
Hans-Ertel-Centre for Weather Research, Atmospheric Dynamics and Predictability Branch, Germany 3Hans-Ertel-Centre for Weather Research, Optimal Application of Weather Forecasts Branch, Germany
Correspondence to:K. Wapler ([email protected])
Received: 13 January 2012 – Revised: 11 May 2012 – Accepted: 15 May 2012 – Published: 14 June 2012
Abstract. The development and use of nowcasting systems should inevitably be accompanied by the develop-ment and application of suitable verification methods. A thorough verification strategy is needed to adequately assess the quality of the system and consequently to lead to improvements. Different verification methods for thunderstorms and its attributes are discussed along with the importance of observational data sets. They are applied to two radar-based nowcasting algorithms for a convective season using various observation data sets. The results show, that the combination of the two algorithms outperforms a single algorithm.
1 Motivation
Severe weather associated with deep convection poses a sig-nificant threat to life, property and economy. Fatalities, in-juries and damages might be caused by lightning, gusts, hail, heavy precipitation or tornadoes. Therefore the provision of accurate and timely nowcast information, i.e. warnings pro-vided by the national meteorological services, is essential for the general public as well as special users like emergency services and aviation.
Several algorithms exist which detect and nowcast deep convection. Most of them are based on either radar reflectiv-ity measurements, like KONRAD (KONvektionsentwicklung in RADarprodukten, convection evolution in radar products, Lang 2001), CellMOS (Cell Model Output Statistics, Hoff -mann, 2008) or on satellite measurements like RDT (rapid developing thunderstorm, Morel et al., 2000) and Cb-TRAM (Cumulonimbus TRAcking and Monitoring, Zinner et al., 2008). Some algorihtms rely on the combination of various observational input data (e.g. James et al., 2011; Pierce et al., 2000; Steinacker et al., 2000).
The evolution of forecast systems and the demand for more user oriented verifications has led to a reassessment of traditional verification strategies as well as to the devel-opment of new verification methods over the last decades
(e.g. Gilleland et al., 2010 and references therein). However, no standard verification methods exist so far to evaluate the performance of nowcasting systems. The verification of con-vection and severe weather events is especially challenging (e.g. Doswell III, 1996). Due to their small horizontal extent, severe weather phenomena resulting from deep convection are rarely entirely and uniquely captured by current obser-vational systems. However, verification is needed to assess the quality of the algorithms, to determine their strengths and weaknesses and consequently to lead to improvements. Given that several nowcasting systems exist and could be used in the warning process these should not only be ver-ified independently but also comparatively using the same method.
In the study presented here we discuss some challenges and approaches of thunderstorm verification. To illustrate these discussions we show some results of verification of the radar based nowcast systems operated at DWD (Deutscher Wetterdienst, German Meteorological Service) CellMOS and KONRAD.
The remainder of this paper is organised as follows. In Sect. 2 an overview of the used algorithms and data sets is given. Section 3 discusses the verification methods; starting with a general introduction (Sect. 3.1) followed by a discus-sion of the specific verification challenges for thunderstorms (Sect. 3.2), convective gusts (Sect. 3.3) and hail (Sect. 3.4). Some verification results are shown in Sect. 4, and Sect. 5 provides a summary and some concluding remarks.
2 Data
The verification was performed for summer (April to September) 2010. The nowcasting algorithms verified in this study are the radar-based algorithms CellMOS and KON-RAD which are based on 5 min 2-D data only. 3-D radar is currently provided only in 15 min interval within the Ger-man radar network. For the short lifecycle and rapid devel-opment of convection this observation frequency is not suf-ficient. However, 3-D data will be available at 5 min inter-vals in the future. KONRAD uses thresholds of 46 dBZ in a 9 km2area. CellMOS also uses a threshold of 9 km2but a lower dBZ threshold of 37. Additionally CellMOS uses light-ning (at least one stroke had to appear within 10 km of the cell) and GME global model (Majewski et al., 2002) data (several parameters, e.g. wind speed and direction, relative humidity at various heights) applying a model output statis-tics approach (Klein and Glahn, 1974). Both systems provide as output the location of a cell along with some additional cell information, e.g. hail and gusts. KONRAD provides a hail flag (0, 1 or 2) based on the size of the area of more than 55 dBZ within the detected cell. Within KONRAD it is assumed that the expected convective gusts are equal to the movement speed of the cell. CellMOS provides estimates for the hail size and the gust speed as well as probabilities of hail sizes and gust above certain thresholds (defined in accordance with the warning categories) for up to 2 h. Both systems run operationally every 5 min.
The gusts verified in this study are measured at the about 260 German stations measuring gusts. The dataset provides hourly maximum gusts. Hail is observed at about 60 German stations with visual observations. Additional the hail dataset of the European Severe Weather Database (ESWD, Dotzek et al., 2009; Dotzek and Groenemeijer, 2009; Groenemei-jer et al., 2009) was used. It collects events with hailstones having a diameter of 2 cm or more and smaller hailstones that form a layer of 2 cm thickness or more on flat parts of the earth’s surface. The database includes information of the location (latitude/longitude) of the event, the time (with
Table 1.Overview of DWD warning criteria related to thunder-storm.
Combination of attributes in addition to lightning Level
Strong gusts (Bft. 7) moderate
Storm force gusts (Bft. 8–10) strong Heavy rainfall (10–25 mm h−1) strong Storm force gusts, heavy rainfall strong Storm force gusts, heavy rainfall, hail strong Hurricane force gusts (Bft. 11–12) severe Very heavy rainfall (25–50 mm h−1) severe Storm force gusts, very heavy rainfall severe Storm force gusts, very heavy rainfall, hail severe Hurricane force gusts, very heavy rainfall, hail severe
an uncertainty), a quality control flag and for some cases some additional information such as hail size. In the ESWD a three-level quality-control is applied. The QC-levels have the following meaning: QC0: “as received”, QC0+: “plausi-bility checked”, QC1: “report confirmed” by reliable sources and QC2: “event fully verified” i.e. all information about this event is verified, consistent and comes from reliable sources. For this study, we use data with quality flags QC1 and QC2. The lightning measurements used are provided by the Eu-ropean LIghtning detection NETwork LINET (Betz et al., 2009). The lightning network consist of 30 antennas in Ger-many (and Ger-many more in Europe) and is considered to have a very high detection efficiency with a quasi continuous spatial and temporal resolution.
3 Verification methods for thunderstorms and its attributes
3.1 General remarks
One basic option for the verification of a nowcast system is to compare the location (and category) of the nowcast and the analysis. E.g. comparing the location of the cell detected at 12:30 UTC with the location of a cell of the+30 min nowcast based on the 12:00 UTC run. However, these results do not sufficiently indicate whether the system provides adequate support for the warning process since we do not warn cells (defined by dBZ areas) but precipitation, gusts etc. E.g. a nowcasting algorithm could be excellent in tracking a feature however this feature might not be equal to or useful for the event of interest and its warning. Thus, the nowcast system should be verified against and will depend on the warning criteria/categories (see Table 1 for an overview of the DWD thunderstorm warning categories). However, observations of severe convective weather phenomena are rare (see discus-sion in the following subsections).
K1
x4 x3 C
2
x5
x2
x1 C1
K1 C2
x5
x2
x1 C1
x4 x3
(a)
(b)
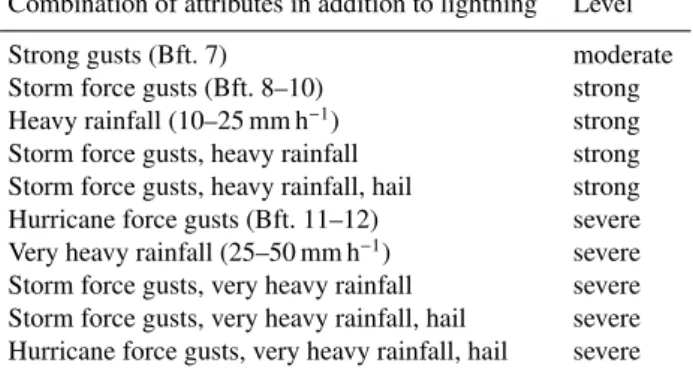
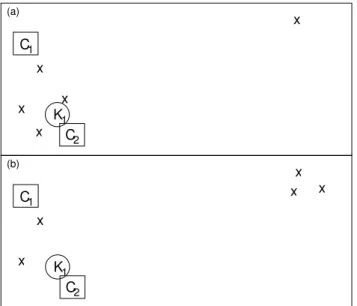
Figure 1.Example of two nowcast situations. Crosses indicate a lightning stroke, squares marked with a C indicate CellMOS cells and circles marked with a K indicate KONRAD cells.
areas affected by observed and nowcasted convective events and asses their overlap. A pointwise approach could consider each individual lightning or cell cluster. The results of these two approaches are shown in Sect. 4.2. Standard categorical verification measures are used (as described in Jolliffe and Stephenson, 2011).
3.2 Lightning
The verification of thunderstorms without considering ac-companying phenomena seems to be much easier due to the high temporal and spatial coverage of lightning data. How-ever, certain aspects have to be addressed when designing a verification methodology.
The most suitable method depends on the definition of a “good forecast”. As an example a simple sketch is shown in Fig. 1. It shows two fictitious nowcast situations with the locations of detected lightning strokes and the locations of cells nowcasted by two algorithms (KONRAD (K) and CellMOS (C)). Looking at these figures, the following ques-tion should be answered to determine a suitable verificaques-tion method. Should the result of the verification of the situation in Fig. 1a be the same as that in Fig. 1b? In both examples one of two storms (one storm on the left side of the figure and one on the right side) is detected. Thus, a verification could give a similar score for both cases. However, one could argue that in Fig. 1a the stronger storm (producing more lightning strokes) is detected and a relative weak storm (producing less lightning strokes) is missed; whereas in Fig. 1b the storms seem to have a comparable strength, thus, the miss and the hit could be weighted the same. Thus, the score should be higher in Fig. 1a compared to Fig. 1b. Furthermore,
thresh-olds have to be defined e.g. the maximum distance in space and time to allow for a hit, to be able to calculate scores. Another aspect is the usability by an operational forecaster (not addressed in this study). Probably, the forecaster might prefer to work with the guidance provided by K because the algorithm nowcasts a single cell on the left side of the fig-ures, whereas C nowcasts two cells, even though the detected lightning strokes on the left could be considered to belong to a single event. These discussions indicate that the decision about which of the interpretations of the situation shown in Fig. 1 applies and thus the definition of a “good forecast” might vary for different users of the warning guidance.
As suggested by the discussion above, the calculated scores as well as the possible maximum score depend on the chosen verification method. The chosen thresholds also in-fluence the score. Another factor which inin-fluences the max-imum possible score of a nowcast is the mean cell lifetime. In current nowcast systems cells usually do not dissolve, but are extrapolated in the future for the duration of the nowcast time frame. As an example of cell lifetimes the KONRAD statistics show that in the summer of 2010 40 % (6802) of all the cells (16 817) were detected just once and 14 % (1972) of the cells lived longer than 30 min. The high number of cells which were detected only once could be due to different rea-sons. E.g. on a convective day several cells develop, however, several cells might reach the threshold defined by KONRAD only shortly before dissolving and only a few cells intensify further. Additionally, the size of cells which have characteris-tics close to the thresholds defined in KONRAD might drop below the size threshold. After a renewed increase of the in-tensity these cells will be detected as new cells.
3.3 Gusts
1.0
0.2 0.4 0.6 0.8
0.0
Figure 2.Pointwise approach. Probability of detection (percentage of hits of all observed events, 772 347) of lightning strokes that oc-curred (summer 2010) within the given radius of cells detected by CellMOS, KONRAD, CellMOS and KONRAD, CellMOS or KON-RAD analysis. The crosses indicate the results using the cell radius given by the algorithm.
3.4 Hail
The problem of low numbers of observations also exists for hail. E.g. during the summer of 2010 at the about 60 German visual observation stations hail was observed just about 20 times. The ESWD provides very useful data. For the summer of 2010 the ESWD contains 82 hail entries with the highest quality flags QC1 or QC2.
However, to derive thorough statistics caution has to be applied when working with this data . It may happen that several data base entries exist for a single event (e.g. a cell in NE Germany had 21 entries (out of 82) in the ESWD, because it was analysed to have hit several villages). Other cells might just have a single entry in the data base which either means that the cell did not leave a long hail path or that the strong extent of the hail event was not observed in its full extent. Most importantly it has to be considered that the hail observations only provide information on “positive events”, no entry in the data base or no observation at a sta-tion does not mean that no hail occurred, i.e. the hits (event observed and forecasted) and misses (event observed but not forecasted) can be determined but not the false alarms (event forecasted but not observed) nor the correct negatives (event neither forecasted nor observed). Thus a strategy has yet to
Table 2.Percentage of lightning strokes that occurred (summer 2010) within 20 km of cells detected and nowcasted by CellMOS, KONRAD, CellMOS and KONRAD (C∧K), CellMOS or KON-RAD (C∨K).
Nowcast CellMOS KONRAD C∧K C∨K
+0 min 82 % 68 % 67 % 84 %
+30 min 72 % 66 % 58 % 79 %
+60 min 51 % 50 % 34 % 67 %
be developed how to work best with this data in a quantitative way. In this study we show some qualitative characteristics.
4 Results and discussions
4.1 Cell tracking
The simple verification of comparing the analysis vs the nowcast of the same algorithm was done for KONRAD. It showed that for all cells during the summer of 2010 which lived at least 30 min, the cell position of the+30 min now-cast was on average 11 km with standard error 11 km away from the location of the analysis. The displacement error of the+60 min nowcast of all cells with a lifetime of at least 120 min was 14 km with standard error 12 km. Such studies could be used for a detailed analysis of the consistency and tracking quality of a system.
4.2 Lightning
As an example of thunderstorm nowcast verification, the results of the verification based on the comparison of all observed lightning strokes to detected cells (pointwise ap-proach) is shown in Fig. 2.
These results show that a considerable part of lightning strokes occurred in cells with less than 9 km2 of dBZ val-ues of at least 46 and thus no KONRAD cells were detected. Furthermore, some lightning strokes occurred in cells with less than 9 km2 of dBZ values of at least 37 or were to far away from the cell centre and thus no corresponding Cell-MOS cells were detected.
This comparison also shows the decrease of the detection rate with a more strict distance thresholds. Furthermore, it is shown that the combination of different algorithms improves the quality of the nowcast. This is due to the different reflec-tivity thresholds applied by the algorithms as well as due to additional data in CellMOS. Table 2 shows the decrease of the detection rate with longer lead times.
Figure 3.Areal approach. Probability of detection (solid, propor-tion of hits of all observed events) and false alarm ratio (dotted, proportion of false alarms of all forecasted events) for the compari-son of areas affected by lightning strokes and areas affected by cells detected by CellMOS, KONRAD, CellMOS and KONRAD, Cell-MOS or KONRAD analysis. The cell radius determines the size of the area affected by a lightning stroke or a cell detected by one of the algorithms.
pointwise verification approach (Fig. 2), this method indi-cates, that the combination of two algorithms outperforms a single algorithm, and that the score improves with larger dis-tance thresholds. However, the comparison of the scores in Figs. 2 and 3 show, that the scores are dependent on the ver-ification method as already discussed in Sect. 3.2. The lower score in the areal approach (Fig. 3) can be explained as fol-lows. The lightning strokes associated with a storm cover a much larger area than a single cell, i.e. area of high reflectiv-ity. This leads to areas near the margin of the storm that are counted as misses which lowers the score.
4.3 Gusts
The comparative verification (not shown) for gusts stronger than 14 m s−1 and gusts stronger than 18 m s−1revealed that nowcasts of CellMOS (which uses a model output statistics approach incorporating NWP model output) are superior to KONRAD (which bases its gust nowcast only on the esti-mated cell movement speed). In general 2-D radar data based algorithms have limited capability in analysing gust speed. Because convective gusts are not (only) determined by the reflectivity in a certain height but parameters such as
down-Figure 4.CellMOS analysis probability for hail larger than 15 mm (thick blue and red triangles) for all QC1 and QC2 hail entries (sum-mer 2010) in the ESWD. Thin triangles show hail reports with no CellMOS cell within 20 km and±5 min.
draft convective available potential energy, maximum hori-zontal momentum and precipitation. The first two could be derived from soundings or models, the latter from vertically integrated liquid (VIL) as derived from 3-D radar measure-ments.
4.4 Hail
Comparison of observations with nowcast show that for most of the summer 2010 ESWD hail reports in Germany a Cell-MOS (Fig. 4) and a KONRAD (Fig. 5) cell has been de-tected (within 20 km and±5 min of the event) which had a hail probability (CellMOS) of more than 75 % or hail warn-ing flag (KONRAD), respectively. As discussed in Sect. 3.4 false alarms and correct negatives cannot be calculated using the existing hail dataset.
For all KONRAD cells detected in summer 2010 64 % had a hail warning flag of 0, 30 % had a hail flag of 1 and only 6 % had a hail flag of 2. Thus, the high number of KON-RAD cells with a hail flag of 2 in Fig. 5 is not by chance. An example which shows the KONRAD hail flags for a line of convective cells which crossed Germany on 14 July 2010 is given in Fig. 6. The figure shows that the algorithm analyses a differentiated hail distribution which further supports that the high number of KONRAD cells with hail flag of 1 or 2 near observed hail events is not by chance.
Figure 5.KONRAD analysis hailflag (thick dark blue, light blue and yellow triangles) for all QC1 and QC2 hail entries (summer 2010) in the ESWD. Thin triangles show hail reports with no KON-RAD cell within 20 km and±5 min.
a convective cell to produce hail is not only determined by a very high reflectivity at a certain height but by high reflec-tivity values throughout the cell and an intense updraft. Thus, additional information from 3-D radar measurements such as the vertically integrated liquid VIL (Greene and Clark, 1972) provide useful information for the detection of hail.
5 Conclusions
In this study the challenges of comparative nowcast verifica-tion are discussed and some verificaverifica-tion results for cell track-ing, thunderstorms, gusts and hail are presented.
It is shown that the combination of different algorithms improves the quality of the nowcast. The low number of ob-servations of rare events, e.g. severe gusts and hail, hampers thorough verification. For one summer season only very few events might be captured by observations. However, now-casting algorithms need to be verified especially if they are new and no long statistics are available.
The results presented here provide an overview of ongo-ing work. It is planned to extend this study by usongo-ing a larger data set, verifying additional phenomena, such as heavy pre-cipitation, and integrating further nowcasting systems in the comparative verification.
(a)
(b)
Figure 6. KONRAD hailflag (dark blue, light blue and yellow circles) and QC0 eswd hail reports (triangles) within ±5 min of 14 July 2010, 16:15 UTC(a)and 18:45 UTC(b).
Acknowledgements. The authors would like to thank Susanne Schroeder for providing the KONRAD cell statistics. We also want to thank the reviewers for their useful comments that helped improve the manuscript. Part of this research was carried out in the Hans Ertel Centre for Weather Research. This research network of Universities, Research Institutes and the Deutscher Wetterdienst is funded by the BMVBS (Federal Ministry of Transport, Building and Urban Development).
Edited by: B. Reichert
Reviewed by: T. K¨uhne and another anonymous referee
The publication of this article is sponsored by the European Meteorological Society.
References
Betz, H. D., Schmidt, K., Laroche, P. Blanchet, P., Oettinger, W. P., Defer, E., Dziewit, Z., and Konarski, J.: LINET – An inter-national lightning detection network in Europe, Atmos. Res., 91, 564–573, 2009.
Davis, C. A., Brown, B. G., and Bullock, R. G.: Object-based verifi-cation of precipitation forecasts. Part I: Methodology and appli-cation to mesoscale rain areas, Mon. Weather Rev., 134, 1772– 1784, 2006.
Dotzek, N. and Groenemeijer, P.: European Severe Weather Database, ESWD – Data format description ESSL Tech. Rep., 2099-01, 20 pp., available at: http://essl.org/media/publications/
essl-tech-rep-2009-01.pdf, 2009.
Dotzek, N., Groenemeijer, P., Feuerstein, B., and Holzer, A. M.: Overview of ESSL’s severe convective storms research using the European Severe Weather Database ESWD, Atmos. Res., 93, 575–586, 2009.
Ebert, E. E., Wilson, L. J., Brown, B. G., Nurmi, P., Brooks, H. E., Bally, J., and Jaeneke, M.: Verification of Nowcasts from the WWRP Sydney 2000 Forecast Demonstration Project, Weather Forecast., 19, 73–96, 2004.
Gilleland, E., Ahijevych, D. A., Brown, B. G., and Ebert, E. E.: Verifying forecasts spatially, B. Am. Meteorol. Soc., 91, 1365– 1373, 2010.
Greene, D. R. and Clark, R. A.: Vertically integrated liquid water – a new analysis tool, Mon. Weather Rev., 100, 548–552, 1972. Groenemeijer, P., Kuehne, T. Liang, Z., and Dotzek, N.: New
capabilities of the European Severe Weather Database, 5th European Conference on Severe Storms, Landshut, Ger-many, 311–312, available at: http://www.essl.org/ECSS/2009/
preprints/chapter10.pdf, 2009.
Hoffmann, J. M.: Entwicklung und Anwendung von statistis-chen Vorhersage-Interpretationsverfahren fuer Gewitternowcast-ing und Unwetterwarnungen unter Einbeziehung von Fernerkun-dungsdaten, Dissertation, FU-Berlin, 205 pp., 2008.
James, P., Trepte, S., Heizenreder, D., and Reichert, B. K.: Now-CastMIX – A fuzzy logic based tool for providing automatic in-tegrated short-term warnings from continuously monitored now-casting systems, 10th Europ. Conf. Appl. Met., Berlin, 2011. Jolliffe, I. T. and Stephenson, D. B.: Forecast Verification: A
Prac-tioner’s Guide in Atmospheric Sciences, Wiley, 292 pp., 2011. Klein, W. H. and Glahn, H. R.: Forecasting local weather by means
of model output statistics. B. Am. Meteorol. Soc., 55, 1217– 1227, 1974.
Lang, P.: Cell tracking and warning indicators derived from opera-tional radar products, 30th Int. Conf. Radar Met., Munich, 245– 247, 2001.
Majewski, D., Liermann, D., Prohl, P., Ritter, B., Buchhold, M., Hanisch, T., Paul, G., Wergen, W., and Baumgardner, J.: The op-erational global icosahedral-hexagonal grid point model GME: Description and high resolution tests, Mon. Weather Rev., 130, 319–338, 2002.
May, P. T., Keenan, T. D., Potts, R., Wilson, J. W., Webb, R., Treloar, A., Spark, E., Lawrence, S., Ebert, E. E., Bally, J., and Joe, P.: The Sydney 2000 Olympic Games Forecast Demonstra-tion Project: Forecasting, Observing Network Infrastructure, and Data Processing Issues, Weather Forecast., 19, 115–130, 2004. Morel, C., S´en´esi, S., Autones, F., and Labatut, L.: The Rapid
Developing Thunderstorms (RDT) product of the nowcasting SAF: Prototyping activities and quality assessment using GOES images. Proceedings, The 2000 Meteorological Satellite Data Users’ Conference, Eumetsat and CNR, Bologna, Italy, 698–705, 2000.
Pierce, C. E., Collier, C. G., Hardaker, P. J., and Haggett, C. M.: GANDOLF: A system for generating automated nowcasts of convective precipitation, Meteor. Appl., 7, 341–360, 2000. Steinacker, R., Dorninger, M., Woelfelmaier, F., and Krennert, T.:
Automatic Tracking of Convective Cells and Cell Complexes from Lightning and Radar Data, Meteorol. Atmos. Phys., 72, 101–110, 2000.
Wilson, J. W., Feng, Y., Chen, M., and Roberts, R. D.: Nowcast-ing Challenges durNowcast-ing the BeijNowcast-ing Olympics: Successes, Failures, and Implications for Future Nowcasting Systems, Weather Fore-cast., 25, 1691–1714, 2010.