www.biogeosciences.net/9/1351/2012/ doi:10.5194/bg-9-1351-2012
© Author(s) 2012. CC Attribution 3.0 License.
Biogeosciences
Multifactor controls on terrestrial N
2
O flux over
North America from 1979 through 2010
X. F. Xu1,2, H. Q. Tian1,2, G. S. Chen1,2, M. L. Liu1,2, W. Ren1,2, C. Q. Lu1,2, and C. Zhang1
1Ecosystem Dynamics and Global Ecology (EDGE) Laboratory, School of Forestry and Wildlife Sciences, Auburn University, Auburn, AL, 36849, USA
2International Center for Climate and Global Change Research, Auburn University, Auburn, AL, 36849, USA
Correspondence to:H. Q. Tian ([email protected])
Received: 1 July 2011 – Published in Biogeosciences Discuss.: 9 November 2011 Revised: 7 February 2012 – Accepted: 27 February 2012 – Published: 12 April 2012
Abstract. Nitrous oxide (N2O) is a potent greenhouse gas which also contributes to the depletion of stratospheric ozone (O3). However, the magnitude and underlying mechanisms for the spatiotemporal variations in the terrestrial sources of N2O are still far from certain. Using a process-based ecosystem model (DLEM – the Dynamic Land Ecosystem Model) driven by multiple global change factors, includ-ing climate variability, nitrogen (N) deposition, risinclud-ing at-mospheric carbon dioxide (CO2), tropospheric O3 pollu-tion, N fertilizer applicapollu-tion, and land conversion, this study examined the spatial and temporal variations in terrestrial N2O flux over North America and further attributed these variations to various driving factors. From 1979 to 2010, the North America cumulatively emitted 53.9±0.9 Tg N2 O-N (1 Tg=1012g), of which global change factors con-tributed 2.4±0.9 Tg N2O-N, and baseline emission
con-tributed 51.5±0.6 Tg N2O-N. Climate variability, N
deposi-tion, O3pollution, N fertilizer application, and land conver-sion increased N2O emission while the elevated atmospheric CO2posed opposite effect at continental level; the interactive effect among multiple factors enhanced N2O emission over the past 32 yr. N input, including N fertilizer application in cropland and N deposition, and multi-factor interaction dom-inated the increases in N2O emission at continental level. At country level, N fertilizer application and multi-factor inter-action made large contribution to N2O emission increase in the United States of America (USA). The climate variabil-ity dominated the increase in N2O emission from Canada. N inputs and multiple factors interaction made large contribu-tion to the increases in N2O emission from Mexico. Cen-tral and southeastern parts of the North America – including
central Canada, central USA, southeastern USA, and all of Mexico – experienced increases in N2O emission from 1979 to 2010. The fact that climate variability and multi-factor in-teraction largely controlled the inannual variations in ter-restrial N2O emission at both continental and country levels indicate that projected changes in the global climate system may substantially alter the regime of N2O emission from ter-restrial ecosystems during the 21st century. Our study also showed that the interactive effect among global change fac-tors may significantly affect N2O flux, and more field exper-iments involving multiple factors are urgently needed.
1 Introduction
continuous increase in atmospheric N2O concentration (Tian et al., 2010b; Denman et al., 2007).
N2O flux has been recognized as a result of a suite of mi-crobial processes influenced by a variety of environmental factors (Conrad, 1996; Williams et al., 1992; Pilegaard et al., 2006). Global change will alter these environmental factors and substrates, and further change the N2O flux (Bouwman et al., 1993; Conrad, 1996; Goldberg and Gebauer, 2009; Kanerva et al., 2007; Kettunen et al., 2005; Williams et al., 1992; Ambus and Robertson, 1999). For example, nitro-gen (N) input may stimulate N2O production by increasing substrate availability (Kettunen et al., 2005; Mcswiney and Robertson, 2005); elevated atmospheric CO2 may reduce N availability in soil owing to progressive N accumulation in plant biomass (Luo et al., 2004; McGuire et al., 1995), which inhibit the N2O emission (Phillips et al., 2001); al-ternatively, elevated atmospheric CO2might increase photo-synthetic products and stimulate microbial process, and thus increase N2O emission (Kettunen et al., 2005; Ineson et al., 1998). If these two effects are counterbalanced, it may ap-pear as neutral response of N2O flux to elevated atmospheric CO2 (Kanerva et al., 2007; Ambus and Robertson, 1999). Tropospheric O3 pollution may alter microbial community (Kanerva et al., 2008) and cause an increase or decrease in N2O emission, depending on time and location (Kanerva et al., 2007). By comparison, the effects of climate vari-ability and land conversion on the N2O emission are more complicated, largely replying upon the specific site condi-tion (Jiang et al., 2009; Goldberg and Gebauer, 2009; Zhang et al., 2007b).
In the past decades, considerable emphasis has been put on the accurate estimation of terrestrial N2O flux (Potter et al., 1996; Xu et al., 2008; Liu, 1996; Denman et al., 2007; Mat-son and Vitousek, 1990; Bouwman et al., 1993). A number of estimates for N2O flux have been achieved by extrapo-lating average fluxes from chamber-based measurements to the areal extent of vegetation or soil classes from which the measurements were taken (Keller et al., 1986; Huang et al., 2003; Matson et al., 1989), or by using a simple empirical model (Xu et al., 2008). In these approaches, uncertainties were introduced because the spatial heterogeneity within the classes, as well as the seasonal and inter-annual variabili-ties in climatic and biotic controls on emission rates, were, at least partially neglected (Potter et al., 1996; Matson et al., 1989). Meanwhile, the empirical methods in estimat-ing regional N2O flux could not be used to attribute the spa-tiotemporal variations in terrestrial N2O flux to environmen-tal drivers. Therefore, a large-scale estimation of terrestrial N2O flux with consideration of spatial heterogeneity of soil, vegetation, and climate variations that could be used for fac-torial attribution is highly needed.
The process-based modeling approach is gaining popular-ity in estimating regional N2O flux (Del Grosso et al., 2006; Li et al., 2001; Potter et al., 1996). Although process-based models have the potential to explore the relative contributions
of each driving force to the spatiotemporal variations in ter-restrial N2O, as they have been used for terrestrial CO2flux (McGuire et al., 2001; Tian et al., 2003; Mu et al., 2008) and CH4flux (Xu et al., 2010), none of them have been utilized to attribute the spatial and temporal variations in terrestrial N2O flux to its driving factors.
North America, one of the extensively investigated con-tinents, still lacks accurate estimates due to limitations in methodology and observations (Kort et al., 2008). A num-ber of studies estimated the N2O emission by solely focusing on one ecosystem type or considering one global change fac-tor (Del Grosso et al., 2006; Xu et al., 2008; Potter et al., 1996). For example, Li et al. (1996) estimated N2O emis-sion from cropland in the United State of America (USA) by using a process-based model DNDC (DeNitrification De-Composition: Li et al., 1996). Del Grosso et al. (2006) esti-mated the N2O flux from cropland in the USA by using the DAYCENT model (Daily Century Model: Del Grosso et al., 2006). One of our previous studies simulated the regional flux of N2O over North America during 1979–2008 by using a process-based ecosystem model DLEM, driven by multiple global change factors including climate variability, elevated atmospheric CO2, N deposition, O3 pollution, N fertilizer application, and land use change (Tian et al., 2010b). In this study, we will extend our previous work and attribute the spa-tial and temporal variations in terrestrial N2O flux to various driving factors.
Specifically, the objectives of this study are: (1) to ex-amine the factorial contributions to the spatial variation of terrestrial N2O flux over North America during 1979–2010; (2) to quantify the factorial contributions to the temporal variations in terrestrial N2O flux over North America dur-ing 1979–2010; and (3) to quantify the factorial contributions to the 32-yr cumulative flux of N2O over North America at both continental and country levels. The global change fac-tors evaluated in this study include climate variability, ris-ing atmospheric CO2, N deposition, O3 pollution, changes in land use and land cover type, and N fertilizer application in cropland. The interactive effects among these six factors were calculated as the difference between simulated changes in N2O flux driven by all factors together and changes in N2O flux caused by six individual factors (see Experiment design section for the detail information).
2 Materials and methods
2.1 Brief description of the model used in this study
including agricultural ecosystems, plantation forests, and pastures. The spatial data set of land management practices, such as irrigation, fertilization, rotation, and harvest, can be used as input information for simulating influences of land management on the structure and functioning of ecosystems. This model has been calibrated against various field data from the Chinese Ecological Research Network (CERN), US Long-Term Ecological Research (LTER) network, and AmeriFlux network, which cover various ecosystems, in-cluding forest, grassland, shrubland, tundra, desert, natural wetlands, and cropland. The simulated results have been compared with independent field data and satellite products. The DLEM operates at a daily time step and at varied spa-tial resolutions, from meters to kilometers, from regional to global. The detailed information for DLEM has been de-scribed in our previous publications (Liu et al., 2008; Ren et al., 2007, 2011a, b; Zhang et al., 2007a; Tian et al., 2010a, b, 2011a, b; Xu et al., 2010; Lu et al., 2012), and the N2O mod-ule has been described in detail in Tian et al. (2010b).
In the DLEM, the N2O module is incorporated into nitro-gen cycling; it simulates the nitrification and denitrification processes. Both denitrification and nitrification processes are simulated as one-step process as we do not consider the mid-products in each process. Nitrification, a process con-verting ammonium into nitrate, is simulated as a function of soil temperature, moisture, and the NH+4 concentration (Lin et al., 2000; Tian et al., 2010b). It should be noted that a small portion of N2O is from nitrification processes. Den-itrification, through which the nitrate is converted into N-containing gases, is simulated in the DLEM as a function of soil temperature, moisture, and the NO−3 concentration (Lin et al., 2000). The empirical equation reported by Davidson et al. (2000) is used to separate N2O from other gases (mainly NO and N2).
In summary, multiple global change factors directly and/or indirectly affect N2O processes in the DLEM (Fig. 1). The elevated atmospheric CO2and O3pollution yield indirect im-pacts on N2O fluxes through their effects on carbon processes and carbon-nitrogen interaction; the climate variability yield direct and/or indirect impacts on N2O flux; N deposition and N fertilizer application directly affect N2O flux since they will change available N in soil for N2O production, and indi-rectly impact carbon process and C-N interaction; the effect of land conversion is complicated since it might change all the ecosystem properties and hence N2O flux. It should be noted that there are other environmental factors, for example, soil pH, and soil porosity, etc., that might influence N2O flux.
2.2 Study area and input data
This study mainly focused on North America, which includes the USA, Canada, and Mexico, covering a total area of ap-proximately 24.71 million km2, approximately 4.8 % of the planet’s surface or 16.5 % of its land area. Excluding water bodies, North America consists of 21 237 grids at a spatial
Fig. 1.Conceptual diagram showing major processes for N2O flux in response to multiple global change factors in the DLEM model (Only nitrification and denitrifiction processes are shown in the fig-ure; other nitrogen processes including nitrogen fixation, mineral-ization, immobilization etc. are not shown in this figure since they are not the focus of this study; see Tian et al. (2010b) for detailed information).
resolution of 32 km by 32 km, which is consistent with the North American Regional Reanalysis (NARR) dataset.
We developed gridded (32×32 km), geo-referenced,
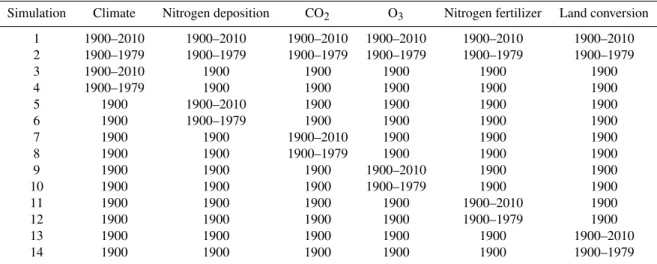
Table 1.Experimental design for this study.
Simulation Climate Nitrogen deposition CO2 O3 Nitrogen fertilizer Land conversion
1 1900–2010 1900–2010 1900–2010 1900–2010 1900–2010 1900–2010 2 1900–1979 1900–1979 1900–1979 1900–1979 1900–1979 1900–1979 3 1900–2010 1900 1900 1900 1900 1900 4 1900–1979 1900 1900 1900 1900 1900 5 1900 1900–2010 1900 1900 1900 1900 6 1900 1900–1979 1900 1900 1900 1900 7 1900 1900 1900–2010 1900 1900 1900 8 1900 1900 1900–1979 1900 1900 1900 9 1900 1900 1900 1900–2010 1900 1900 10 1900 1900 1900 1900–1979 1900 1900 11 1900 1900 1900 1900 1900–2010 1900 12 1900 1900 1900 1900 1900–1979 1900 13 1900 1900 1900 1900 1900 1900–2010 14 1900 1900 1900 1900 1900 1900–1979
Note: 1900–2010 indicates that the data for the time period of 1900–2010 was used in the simulation; while 1900–1979 indicates that the data for the time period of 1900–1979 was used in the simulations and the simulations after 1979 was fed by the data of 1979.
data include: (1) daily climate data from 1901 to 2010, in-cluding maximum, minimum and average temperatures, rel-ative humidity, solar radiation, and precipitation; the data from 1901 to 1978 were randomly assigned as one year dur-ing 1979–2010; (2) annual N deposition from 1901 to 2010; (3) annual O3pollution data from 1901 to 2010; (4) atmo-spheric CO2concentration from 1901 to 2010; (5) cropland and urban distribution from 1901 to 2005 – the land use since 2005 was assumed unchanged due to shortage of data; and (6) N fertilizer application data for cropland over the time period of 1901–2010.
2.3 Experimental design
In this study, we performed fourteen simulation experiments to determine the relative effects of N deposition, O3 pollu-tion, climate variability, elevated atmospheric CO2, land-use change, and N fertilizer application on terrestrial N2O flux over North America. One overall simulation was set up to simulate the terrestrial N2O flux over North America by con-sidering the temporal and spatial dynamics of all six global change factors. Six additional simulations were set up to sim-ulate the effects of each individual factor on N2O flux. For example, to determine the effects of climate variability alone, we ran DLEM using the gridded historical daily data for air temperature, including maximum, minimum, and average air temperatures, relative humidity, solar radiation, and precip-itation; but kept all other five global change factors at the levels of 1900: the atmospheric CO2 concentration, N de-position, O3pollution, N fertilizer application for cropland, and the land cover type (potential vegetation map with crop-land and urban crop-land in 1900). To determine the effects of CO2fertilization alone, we ran DLEM using the historical at-mospheric CO2concentrations, but kept all other five global change factors constant: a 30-yr averaged daily climate data
was used to represent the mean climate condition, the poten-tial vegetation map with crop and urban land in 1900 was used to represent the constant land cover type, and the N de-position, O3pollution, and N fertilizer application data were kept constant in the year of 1900. For each of the above seven simulations, we set up one corresponding simulation except the input data in 1979 was used to drive the post-1979 sim-ulations. This simulation design was used to capture the in-ternal dynamics of the system, which served as baseline; the difference between each pair of simulation is defined as the factor-induced N2O flux. For example, the time-series dif-ference between simulation #1 and simulation #2 for 1979– 2010 is caused by all global change factors and their interac-tion because the internal system dynamic defined as results from simulation #2 was excluded (Table 1).
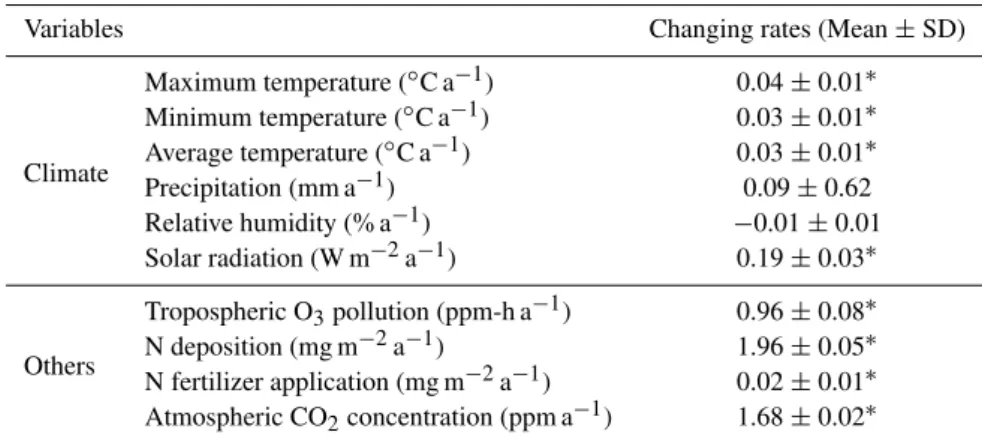
Table 2.Changing rates of driving factors from 1979 to 2010 for DLEM simulations.
Variables Changing rates (Mean±SD)
Climate
Maximum temperature (◦C a−1) 0.04±0.01∗ Minimum temperature (◦C a−1) 0.03±0.01∗ Average temperature (◦C a−1) 0.03±0.01∗ Precipitation (mm a−1) 0.09±0.62 Relative humidity (% a−1) −0.01±0.01 Solar radiation (W m−2a−1) 0.19±0.03∗
Others
Tropospheric O3pollution (ppm-h a−1) 0.96±0.08∗ N deposition (mg m−2a−1) 1.96±0.05∗ N fertilizer application (mg m−2a−1) 0.02±0.01∗ Atmospheric CO2concentration (ppm a−1) 1.68±0.02∗
∗indicates the changing rate is significantly different from zero; positive values represent increase through the study period, and negative values represent decrease through the
study period.
Table 3.Land area of the major biomes in North America.
Plant functional type Tundra Forest Shrub Grassland Wetland Desert and others Cropland
Area (million km2) 4.05 6.93∼6.99 3.57∼3.59 2.61∼2.64 2.06∼2.07 0.53∼0.60 2.51∼2.59 Percentage 18.09 31.10 15.98 11.72 9.23 2.49 11.39
Biome-level areas may not sum to totals because of the effects of rounding in reporting those values.
simulated by the DLEM driven by the input data of 1979. The changes thereafter compared to baseline flux were as-sumed solely caused by global change factors, individually or in combination.
2.4 Model parameterization
The model parameterization and validation at both site and regional levels were documented in our previous publication (Tian et al., 2010b). We will not describe them in detail in this paper.
2.5 Statistic method
The regression analysis was used in this study to quantify the long-term changing trend of input data and terrestrial N2O fluxes estimated by various simulations. All the statistical analyses were conducted using the R program 12.0 for Win-dows XP.
3 Results
3.1 Environmental changes over North America during 1979–2010
For the climate variables, maximum, minimum, and average temperatures, and solar radiation showed sig-nificantly increasing trends at the rates of 0.04±0.01
◦
C a−1, 0.03±0.01◦C a−1, 0.03±0.01◦C a−1, and 0.19±
0.03 W m−2a−1, respectively; yet precipitation and rel-ative humidity did not show any significantly chang-ing trends over the study period. All the other driv-ing factors significantly increased since 1979; the long-term increasing rates were 0.96±0.08 ppm-h a−1for
tropo-spheric O3pollution, 1.96±0.05 mg m−2a−1for N deposi-tion, 0.02±0.01 g m−2a−1 for N fertilizer application, and
1.68±0.02 ppm a−1for atmospheric CO2concentration,
re-spectively (Table 2). The areas of different land cover types changed slightly throughout the study period; the cropland area increased from 2.51 million km2 to 2.59 million km2; the area of forest, shrubland, grassland and wetland changed in a very small magnitude (Table 3).
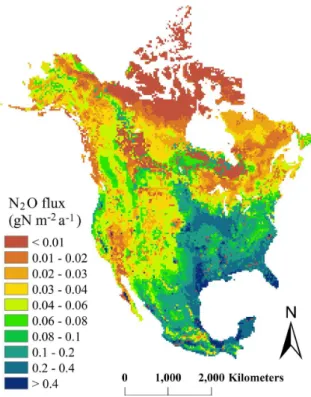
Fig. 2.Spatial variations of terrestrial N2O fluxes caused by global change factors over North America from 1979 to 2010.
Canada was featured by quite low N deposition (lower than 0.01 g N m−2a−1).
3.2 Spatial distribution of N2O flux over North America
during 1979–2010
The terrestrial N2O flux over North America showed a sig-nificant spatial variation, with a strong source in southeastern continental North America, including southeastern USA and the majority of Mexico, and a weak source in the northern part of North America (Fig. 2). At the country level, central and southeastern USA featured high N2O emission, up to nearly 1 g N m−2a−1, while western USA had relatively low N2O emission rates. There was a north-to-south increasing gradient of N2O emission across Canada: the N2O emission rate was as low as 0.0001 g N m−2a−1in northern Canada, and as high as nearly 0.4 g N m−2a−1 in southern Canada; the entire Mexico acted as a strong source for N2O, with the national N2O emission being>0.1 g N m−2a−1over the past 32 yr.
3.3 Factorial contribution to the spatial variations in terrestrial N2O flux during 1979–2010
Nitrogen release as N2O is one of major pathways for nitro-gen loss from terrestrial ecosystem. Throughout the study period, the cumulative N2O emission over North America was composed of two components: one is the background emission, defined as the N2O flux during 1979–2010
sim-ulated by the DLEM driven by the input data of 1979; the other is the flux contributed by changes in various individual and interactive effects of several global change factors. After removing the baseline flux of N2O, the remaining changes in N2O fluxes over the study period are resulted from six global change factors and their interaction.
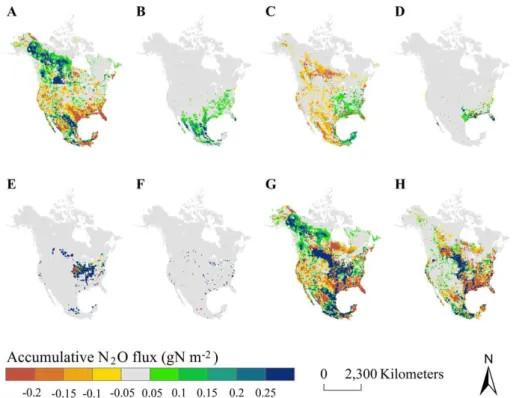
Over the 32-yr study period, climate variability enhanced N2O emission over the majority of central Canada, while de-creased N2O emissions over portions of western Alaska, ma-jority of the USA, and a portion of Mexico (Fig. 3a). N de-position enhanced N2O emission over the entire continental North America, with prominent increases over southeastern USA and Mexico (Fig. 3b). The elevated atmospheric CO2 enhanced N2O emissions in southeastern USA and a por-tion of Mexico, while decreased N2O emissions in western USA, central Canada, and the majority of Mexico (Fig. 3c). The O3 pollution increased N2O emissions in portions of southeastern USA, while no significant impacts on N2O flux were found in other areas (Fig. 3d). The N fertilizer ap-plication enhanced N2O emission in central USA, which is agricultural land (Fig. 3e). Land conversion only affected a small amount of area that experienced land use conver-sion between natural vegetation and cropland or urban in the past few years (Fig. 3f). The interactive effect among global change factors enhanced N2O emissions in central USA, while decreased N2O emissions in southeastern USA and central Canada (Fig. 3h). Combining all the effects from various global change factors, the N2O emissions were en-hanced across central Canada and central USA and portions of Mexico, yet were decreased in western and southeastern USA and eastern Canada (Fig. 3g).
3.4 Temporal patterns of N2O flux over North America
during 1979–2010
The continental-level terrestrial flux of N2O over North America showed a significant inter-annual fluctuation during 1979–2010 (Fig. 4). The mean annual N2O flux over North America’s terrestrial ecosystems was 1.68±0.15 Tg N2O-N a−1, with an overall increasing rate
of 5.47±2.74 Gg N2O-N a−1(1 Gg=109g) over 32 yr (P =
0.055). The long-term increasing trend and inter-annual fluctuation in terrestrial N2O flux resulted from multi-ple global change factors (Fig. 4). Climate variability exerted a significant inter-annual variation in N2O flux, with a slightly increasing rate of 2.72±2.07 Gg N2 O-N a−1 (P =0.199). N deposition contributed to an in-creasing rate of 1.67±0.03 Gg N2O-N a−1(P <0.001), and N fertilizer application contributed to an increasing rate at 2.39±0.13 Gg N2O-N a−1for continental N2O emission
Fig. 3.Factorial contributions to the spatial variations in cumulated N2O flux over North America from 1979 to 2010 (A: climatic variability;
B: N deposition;C: CO2;D: tropospheric O3pollution;E: N fertilizer application;F: land conversion;G: all combined;H: interaction).
Fig. 4.Temporal variations of terrestrial N2O flux caused by global change factors over North America from 1979 to 2010 (A: all com-bined simulation;B: climate only simulation;C: N deposition only simulation;D: CO2only simulation;E: tropospheric O3pollution only simulation;F: N fertilizer application only simulation;G: land conversion only).
period, while land conversion did not yield significant chang-ing trends of N2O emission over the study period.
3.5 Factorial contributions to the cumulated N2O flux
over North America during 1979–2010 at continen-tal and country levels
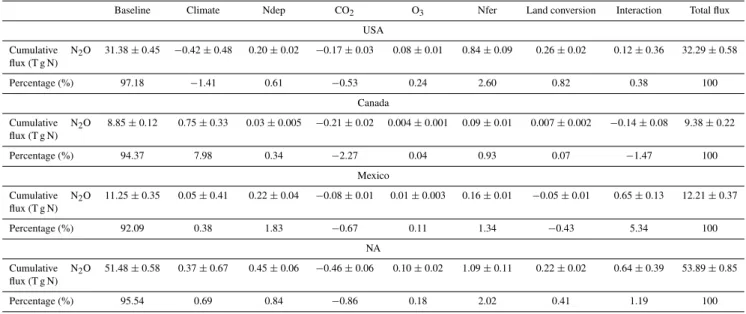
To examine the factorial contributions to cumulated terrestrial N2O flux for the three countries, we further partitioned continental level N2O flux into country-level fluxes (Fig. 6). The 32-yr cumulative N2O emission was 32.29±0.58 Tg N2O-N for USA, 9.38±0.22 Tg N2O-N for
Canada, and 12.21±0.37 Tg N2O-N for Mexico,
respec-tively (Table 4). For the USA, climate variability and ele-vated atmospheric CO2 decreased N2O emission, while N deposition, O3pollution, N fertilizer application, land con-version, and multi-factor interaction increased the country-level N2O emission (Table 4). After removing the baseline emission, the global change factors increased N2O emis-sion from USA’s terrestrial ecosystems from 1979 to 2010. For Canada, climate variability, N deposition, O3pollution, N fertilizer application, and land conversion increased N2O emission during 1979–2010; while elevated atmospheric CO2 and multi-factor interaction decreased N2O emission (Table 4). After removing the baseline emission, the global change factors increased N2O emission from Canada’s ter-restrial ecosystems over the 32-yr period. For Mexico, cli-mate variability, N deposition, O3pollution, N fertilizer ap-plication, and multi-factor interaction enhanced N2O emis-sion during the time period of 1979–2010; while elevated atmospheric CO2and land conversion decreased N2O emis-sion (Table 4). After removing the baseline flux, the global change factors stimulated N2O emission from Mexico’s ter-restrial ecosystems from 1979 to 2010.
For the country-level cumulative terrestrial N2O fluxes, the baseline emission made the biggest contribution: it ac-counted for 95.54 % of the continental N2O emission, and 97.18 %, 94.37 %, and 92.09 % of the N2O flux in the USA, Canada, and Mexico, respectively (Table 4).
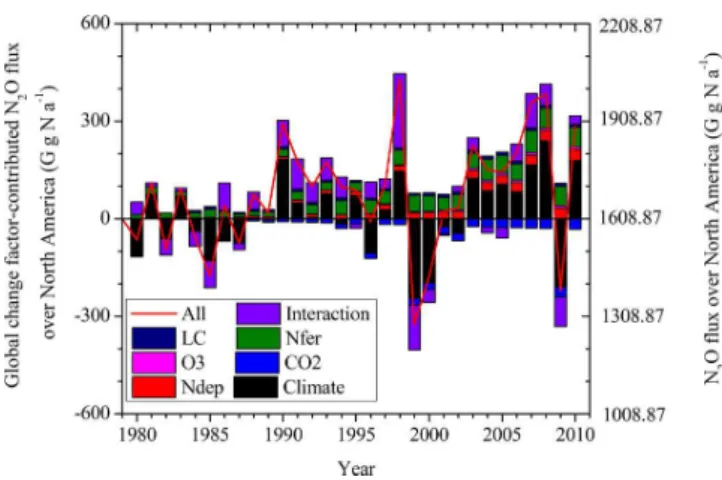
3.6 Factorial contributions to the inter-annual variations in N2O flux over North America
during 1979–2010 at continental and country levels
Inter-annual variation is one of major attributes of ecosystem processes; it may be caused by internal mechanisms or ex-ternal environmental controls. Inannual variation in ter-restrial N2O flux was shown over North America from 1979 to 2010 (Fig. 7). To examine the controlling factors for this inter-annual variation, we further attributed the changes in terrestrial N2O flux for each year to the six global change fac-tors and their interaction (results shown in Fig. 7). Over the entire North America, rising atmospheric CO2continuously decreased, while N deposition and N fertilizer application continuously increased terrestrial N2O emission. O3 pollu-tion yielded very small positive effects on terrestrial N2O emission, while land conversion yielded small yet fluctuat-ing effects on terrestrial N2O emission (Fig. 7). The climate variability primarily dominated the inter-annual fluctuation in terrestrial N2O flux from 1979 to 2010. Climate variabil-ity and multi-factor interaction co-dominated the increases in N2O emission in three specific time periods: 1979–1987,
Fig. 5. Factorial contributions to cumulated N2O flux over North America during 1979–2010 (The right y-axis shows the cumula-tive N2O flux with baseline;Allmeans N2O flux derived from all combined simulation; Interactionmeans contribution from multi-factor interaction; LC means contribution from land conversion;
Nfermeans contribution from N fertilizer application; O3 means contribution from tropospheric O3pollution; CO2means contribu-tion from elevated atmospheric CO2;Ndepmeans contribution from N deposition;Climatemeans contribution from climate variability).
1990–1998, and 2001–2008. For the specific years, such as 1988, 1989, and 1999 when the climatic contribution to the N2O flux was neutral, the interactive effect among multiple factors dominated the changes of terrestrial N2O flux com-pared to the baseline flux (Fig. 7).
After partitioning continental flux into country-level fluxes of N2O, we further analyzed and identified the major fac-tors controlling the inter-annual fluctuation in terrestrial N2O over each country. It was found that the major factors lead-ing to inter-annual fluctuation in terrestrial N2O flux varied among countries. Climate variability and multi-factor inter-action co-dominated the inter-annual fluctuations in terres-trial N2O flux over the USA. During the periods of 1979– 1986, 1990–1998, and 2009, the climatic effects dominated the terrestrial N2O emission over the USA. Meanwhile, in-teractive effects among the factors contributed to the flux of terrestrial N2O over the entire study period except the years of 2002–2003 (Fig. 8a).
Table 4. Factorial contributions to the cumulated N2O from 1979 to 2010 (Climaterepresents the impacts of climate variability only; Ndeprepresents the impacts of N deposition; CO2represents the impacts of CO2variation; O3 represents the impacts of Tropospheric O3pollution; Nferrepresents the impacts of N fertilizer application;Land conversionrepresents the impacts of land cover change only; Interactionrepresents the interactive effects of the six environmental factors).
Baseline Climate Ndep CO2 O3 Nfer Land conversion Interaction Total flux
USA
Cumulative N2O
flux (T g N)
31.38±0.45 −0.42±0.48 0.20±0.02 −0.17±0.03 0.08±0.01 0.84±0.09 0.26±0.02 0.12±0.36 32.29±0.58
Percentage (%) 97.18 −1.41 0.61 −0.53 0.24 2.60 0.82 0.38 100
Canada
Cumulative N2O
flux (T g N)
8.85±0.12 0.75±0.33 0.03±0.005 −0.21±0.02 0.004±0.001 0.09±0.01 0.007±0.002 −0.14±0.08 9.38±0.22
Percentage (%) 94.37 7.98 0.34 −2.27 0.04 0.93 0.07 −1.47 100
Mexico
Cumulative N2O
flux (T g N)
11.25±0.35 0.05±0.41 0.22±0.04 −0.08±0.01 0.01±0.003 0.16±0.01 −0.05±0.01 0.65±0.13 12.21±0.37
Percentage (%) 92.09 0.38 1.83 −0.67 0.11 1.34 −0.43 5.34 100
NA
Cumulative N2O
flux (T g N)
51.48±0.58 0.37±0.67 0.45±0.06 −0.46±0.06 0.10±0.02 1.09±0.11 0.22±0.02 0.64±0.39 53.89±0.85
Percentage (%) 95.54 0.69 0.84 −0.86 0.18 2.02 0.41 1.19 100
Country- or individual factor-based estimates may not sum to totals because of the effects of rounding in reporting those estimates; positive values represent stimulating effects of global change factors on N2O flux; negative values represent inhibiting effects of global change factors on N2O flux.
small or large. For Mexico, although climate variability yielded significant effects on inannual variations in ter-restrial N2O flux, the contributions from multi-factor inter-action were predominated in several time periods. For exam-ple, in 2005, the multi-factor interaction outweighed other factors and played an important role in controlling terres-trial N2O flux; for the time period of 1983–1993, the con-tributions from multi-factor interaction also prevailed. The contributions from all other factors were in small magnitude (Fig. 8c).
4 Discussion
4.1 Comparisons with other studies
We compared our modeled results against previous studies to evaluate the factorial effects on N2O flux for major biomes (Table 5). Our estimated continental-scale average response to double CO2 was−36.33 % for forest ecosystems, which is consistent with Phillips et al.’s report that the N2O emis-sion will be suppressed by elevated CO2 (Phillips et al., 2001). DLEM simulated a 17.54 % decrease of N2O emis-sion from grassland, which is consistent with a previous es-timate (Baggs et al., 2003). All field observations reported that the effects of elevated CO2on N2O emission depend on N availability; this could be explained by N limitation the-ory (Luo et al., 2004). Several studies have concluded that majorities of forest and grassland on the planet are N lim-ited (Aber et al., 1998; Aber and Melillo, 2001; Vitousek
and Farrington, 1997; Vitousek et al., 1997), so the ele-vated CO2might suppress N2O emission from these ecosys-tems. Our study found that the elevated CO2 suppressed N2O emission over North America’s forest and grassland. This study also found that N deposition could stimulate N2O emission in all major biomes, which is consistent with field observations (Liu and Greaver, 2009; Ambus and Robert-son, 2006; Kettunen et al., 2005). DLEM simulations in-dicate that N deposition could stimulate N2O emission at rates of 28.55±0.24 mg N m−2a−1/(g N m−2a−1) for for-est, 49.15±0.19 mg N m−2a−1/(g N m−2a−1)for grassland, 47.77±0.88 mg N m−2a−1/(g N m−2a−1)for wetland, and 13.94±0.10 mg N m−2a−1/(g N m−2a−1)for cropland, re-spectively. These responses are larger than the summarized values by Liu and Greaver (2009). This might be related to the fact that our simulation study covered more hetero-geneous space than Liu and Greaver (2009) did. There is only one reported field study for the effect of O3pollution on N2O emission from grassland (Kanerva et al., 2007). Both DLEM-estimation and field observation showed very small, or nearly neutral effect of O3pollution. O3has been found to be an inhibitor of plant growth (Ashmore, 2005; Kanerva et al., 2007; Wang et al., 2007); worse plant growth means lower N uptake, which will, in turn, increase N availability in soil and thus stimulate N2O emission.
Table 5.Comparison of factorial effects on N2O fluxes against other studies (positive values mean increase; negative values mean decrease in N2O emission).
Biome Experiment design
This study Other studies Literature
Elevated CO2 Forest Double CO2 −36.33 % Negative, neutral or pos-itive effects, depending on seasons and nitrogen availability
Ambus and Robertson (1999); Phillips et al. (2001)
Grassland 600 ppm vs. 360 ppm CO2
−17.54 % −5.65 % ∼ −26.01 % for low nitrogen input; 1.43 % ∼62.27 % for high nitrogen input
Baggs et al. (2003); Ineson et al. (1998); Kanerva et al. (2007); Ambus and Robert-son (2006)
Nitrogen deposition Forest 28.55±0.24 (mg N m2a−1/ g N m2a−1)
6±1 (mg N m2a−1/ g N m2a−1)
Liu and Greaver (2009)
Grassland 49.15±0.19 (mg N m2a−1/ g N m2a−1)
6±1 (mg N m2a−1/ g N m2a−1)
Liu and Greaver (2009)
Wetland 47.77±0.88 (mg N m2a−1/ g N m2a−1)
36±13 (mg N m2a−1/ g N m2a−1)
Liu and Greaver (2009)
Cropland 13.94±0.10 (mg N m2a−1/ g N m2a−1) for nitrogen deposition; 18.23±0.05 (mg N m2a−1/ g N m2a−1)for nitrogeN fertilizer application
9±1 (mg N m2a−1/ g N m2a−1)
Liu and Greaver (2009)
Tropospheric O3 pollution
Grassland 40–50 ppb in Open-top chambers
1.5 % Decrease yet not significantly
Kanerva et al. (2007)
and this study are comparable yet different in magnitude due to different methods or datasets; for example, the UNFCCC estimates that N2O emission from agricultural soils in US is for 0.79∼0.88 Tg N a−1 from 1990 to 2009, while it is
0.35∼0.44 Tg N a−1estimated by DLEM; this might be due
to the fact that UNFCCC considers all agricultural land while DLEM only considers cropland.
4.2 Factorial controls on N2O flux at temporal and
spatial scales
Spatial variations in terrestrial N2O flux over North Amer-ica simulated in this study were consistent with other studies (Xu et al., 2008; Potter et al., 1996). The major source for atmospheric N2O locates in southeastern continental North America, including the south part of central Canada, south-eastern USA, and all of Mexico, which is associated with large cropland distributions and relatively high temperatures
(Fig. 3). The weak source in northern Canada is probably due to its low temperature and rainfall, as N2O emission is significantly controlled by temperature and soil moisture (Chapuis-Lardy et al., 2007; Conrad, 1996; Goldberg and Gebauer, 2009).
Fig. 6.Factorial contributions to cumulated N2O flux at country-level during 1979–2010 (A: United States of America;B: Canada;C: Mex-ico) (The right y-axis shows the cumulative N2O flux with baseline;Allmeans N2O flux derived from all combined simulation;Interaction means contribution from multi-factor interaction;LCmeans contribution from land conversion;Nfermeans contribution from N fertilizer application; O3means contribution from tropospheric O3pollution; CO2means contribution from elevated atmospheric CO2;Ndepmeans contribution from N deposition;Climatemeans contribution from climate variability).
et al., 2007), and thus suppress carbon source for microbial processes responsible for N2O production, and finally cause decreases in N2O emission. However, it is also reasonable to infer that the O3pollution inhibits productivity (Wang et al., 2007); and less N uptake might increase N availability in soil and in turn increase N2O emission. This study showed that the O3 pollution enhanced N2O emission from terres-trial ecosystems in southeastern USA due to slightly higher N availability.
The elevated atmospheric CO2 decreased N2O emission at continental scale; while the effects varied across North America. The stimulation effects of elevated atmospheric CO2 on N2O emission were also observed over southeast-ern USA and portions of Mexico (Fig. 3c). In field experi-ments, both positive and negative effects of elevated atmo-spheric CO2on N2O emission were observed (Kammann et al., 2008; Phillips et al., 2001). The positive or negative ef-fects might be determined by soil N availability; a field ex-periment concluded that a small amount of N fertilizer will relieve N limitation under elevated CO2concentration (Ket-tunen et al., 2007). If no progressive N limitation occurs un-der elevated CO2, enhanced N2O emission will be observed. As the theory of progressive N limitation predicts (Luo et al.,
2004), rising atmospheric CO2could lead to low N availabil-ity in soil and thus lead to low N2O emission (Kettunen et al., 2005; Barnard et al., 2004). In this study, the elevated atmospheric CO2substantially decreased the N2O emission from terrestrial ecosystem over North America, which is due to the N limitation for major biomes throughout the entire North America (Vitousek and Farrington, 1997; Aber and Melillo, 2001).
4.3 Inter-annual variability in N2O flux
The increasing long-term trend and substantial inter-annual fluctuation in terrestrial N2O flux over North America during 1979–2010 resulted from complicated impacts from multiple factors (Chapuis-Lardy et al., 2007; Conrad, 1996; Ambus and Robertson, 1999). The highly varied climatic variability dominated the inter-annual flux of N2O over North Amer-ica, and solely dominated the N2O flux over Canada. N de-position, O3pollution, and atmospheric CO2concentrations increased at relatively stable rates through the studied 32 yr, which resulted in the long-term trend of N2O flux (Fig. 8).
Fig. 7.Factorial contribution to the inter-annual variations in N2O flux over North America (The right y-axis shows the N2O flux with baseline;Allmeans N2O flux derived from all combined simula-tion;Interactionmeans contribution from multi-factor interaction;
LCmeans contribution from land conversion; Nfermeans contri-bution from N fertilizer application; O3means contribution from tropospheric O3pollution; CO2means contribution from elevated atmospheric CO2;Ndepmeans contribution from N deposition; Cli-matemeans contribution from climate variability).
inter-annual variations in terrestrial N2O flux at both con-tinental and country levels. Following climate variability, multi-factor interaction played an essential role in contribut-ing temporal variations in terrestrial N2O flux. This is con-sistent with our previous analysis showing that climate vari-ability, followed by multi-factor interaction, co-dominated inter-annual variations in terrestrial N2O flux at both con-tinental and country levels (Sect. 3.6). The importance of climate variability in controlling inter-annual N2O emission indicates the important role of climate variability in control-ling variations in atmospheric N2O concentration (Fluckiger et al., 1999).
4.4 Interactions among multiple factors
The interaction among global change factors has been long recognized as an important factor (Dermody, 2006). A large amount of field experiments still treat it as negligible, al-though a few experiments have introduced this in their exper-iment design (Xia et al., 2009; Reich et al., 2006). Through this study, the multi-factor interaction was recognized play-ing an important role in contributplay-ing to terrestrial N2O flux (Sect. 3.6). Since the various climate variables are associ-ated in reality, the separation of each climate variable might be biased. Because the field experiments are usually labor in-tensive, multi-factor experiment might be hard to carry out; the interactive effects among more than three factors are still short of investigation (Heimann and Reichstein, 2008; Norby and Luo, 2004). This study shows that the modeling ap-proach may serve as one complementary tool for field
exper-iments in addressing interactive effect in a multi-factor world (Norby and Luo, 2004).
4.5 Uncertainties and future research needs
Considering the limitations in existing manipulative field ex-periments on N2O fluxes, and the complexities in the re-lated nonlinear processes and multiple controlling factors, numerical experiments with models like DLEM that repre-sent the fundamental mechanisms in N and N gas processes and the coupled biogeochemical cycles become an important approach to gain insights into the dynamics of N-containing gas emission in the context of global changes. This is the reason why process-based models are widely used in climate change studies, and why our study places so much emphasis on the relative contribution and interactions of multiple en-vironmental controls. Through this study, rather than try to draw any conclusions on this issue, we hope to provide some insight on the patterns and dynamics of the N gas emission and to raise some questions about the effects of multiple en-vironmental factors on the process.
This study was able to attribute the spatial and tempo-ral variations in N2O flux over North America’s terrestrial ecosystems during 1979–2010, but there are several issues that still need to be improved. First, this study only consid-ered the land conversion between cropland and natural veg-etation, and would generate more accurate results if other land use changes such as afforestation were included. Sec-ond, the pre-1979 legacy effect may cause some biases in this study, which solely analyzed N2O flux over the time period of 1979–2010. Third, the soil may act as a sink of atmo-spheric N2O (Chapuis-Lardy et al., 2007); however, owing to incomplete understanding of this phenomenon, we did not incorporate this mechanism in this study, so the model may have overestimated the terrestrial N2O flux at both continen-tal and county levels. More field studies are needed to un-derstand the mechanisms for N2O sink in soil, which will improve the regional estimation of N2O flux.
Fig. 8.Factorial contribution to the inter-annual variations in N2O flux at country level (A: United States of America;B: Canada;C: Mexico) (The right y-axis shows the N2O flux with baseline;Allmeans N2O flux derived from all combined simulation;Interactionmeans contri-bution from multi-factor interaction;LCmeans contribution from land conversion;Nfermeans contribution from N fertilizer application; O3means contribution from tropospheric O3pollution; CO2means contribution from elevated atmospheric CO2;Ndepmeans contribution from N deposition;Climatemeans contribution from climate variability).
model associated with more field observations might pro-vide more accurate nitrogen deposition data. Seventh, fur-ther work on N2O flux in cropland is needed to reduce the uncertainty because of the dominance of fertilized cropland as N2O source and the shortage of extensive validation of DLEM-simulated N2O flux. Last but not least, it will be an improvement when additional environmental factors such as wild and prescribed fires, harvests, insect outbreaks, etc. are considered. Meanwhile, we acknowledged that the precision is different from accuracy; although many simulations were performed and uncertainty analysis was conducted, more ef-forts are needed to increase the accuracy of estimated N2O fluxes.
5 Conclusions
This study examined the factorial contributions to the terres-trial N2O flux over North America at both continental and country levels by using a highly-integrated process-based ecosystem model driven by multiple global change factors, including changing climate, N deposition, rising atmospheric CO2, O3pollution, N fertilizer application, and land
conver-sion. The improvements in input data and model mechanisms are needed for more accurate estimates. Nevertheless, this study is helpful in advancing our understanding of the dy-namics of atmospheric N2O concentration as well as benefi-cial for the policy-makers to curb the increase in atmospheric N2O concentration. The complicated effects of multi-factor interaction on N2O flux suggest that the current field experi-ments, which usually ignore the interactive effects from mul-tiple factors, may lead to biases in the estimation of N2O flux. This study also pointed out that the models driven by only a few global change factors may bring bias in estimating N2O flux.
Station (AAES) Hatch/Multistate Funding Program. We are appreciated for two anonymous reviewers for their comments on early version of this manuscript.
Edited by: A. Neftel
References
Aber, J. D. and Melillo, J. M.: Terrestrial Ecosystems, Academic Press, New York, 2001.
Aber, J. D., McDowell, W., Nadelhoffer, K., Magill, A., Berntson, G., Kamakea, M., McNulty, S., Currie, W., Rustad, L., and Fer-nandez, I.: Nitrogen saturation in temperate forest ecosystems, BioScience, 48, 921–934, 1998.
Ambus, P. and Robertson, G. P.: Fluxes of CH4and N2O in aspen stands grown under ambient and twice-ambient CO2, Plant Soil, 209, 1–8, 1999.
Ambus, P. and Robertson, G. P.: The effect of increased N de-position on nitrous oxide, methane and carbon dioxide fluxes from unmanaged forest and grassland communities in Michigan, Biogeochemistry, 79, 315–337, doi:10.1007/s10533-005-5313-x, 2006.
Ashmore, M. R.: Assessing the future global impacts of ozone on vegetation, Plant Cell Environ., 28, 949–964, 2005.
Baggs, E. M., Richter, M., Hartwig, U. A., and Cadisch, G.: Nitrous oxide emissions from grass swards during the eighth year of ele-vated atmosphericpCO2(Swiss FACE), Glob. Change Biol., 9, 1214–1222, 2003.
Barnard, R., Barthes, L., Roux, X. L., and Leadley, P. W.: Dynam-ics of nitrifying activities, denitrifying activities and nitrogen in grassland mesocosms as altered by elevated CO2, New Phytol., 162, 365–376, 2004.
Bouwman, A., Fung, I., Matthews, E., and John, J.: Global anal-ysis of the potential for N2O production in natural soils, Global Biogeochem. Cy., 7, 557–597, 1993.
Brumme, R., Borken, W., and Finke, S.: Hierarchical control on ni-trous oxide emission in forest ecosystems, Global Biogeochem. Cy., 13, 1137–1148, 1999.
Chapuis-Lardy, L., Wrage, N., Metay, A., Chotte, J. L., and Bernoux, M.: Soils, a sink for N2O? A review, Glob. Change Biol., 13, 1–17, doi:10.1111/j.1365-2486.2006.01280.x, 2007. Christensen, S. and Tiedje, J. M.: Brief and vigorous N2O
produc-tion by soil at spring thaw, Eur. J. Soil Sci., 41, 1–4, 1990. Cicerone, R. J.: Changes in stratospheric ozone, Science, 237, 35–
42, 1987.
Conrad, R.: Soil microorganisms as controllers of atmospheric trace gases(H2, CO, CH4, OCS, N2O, and NO), Microbiol. Rev., 60, 609–640, 1996.
Davidson, E. A., Keller, M., Erickson, H. E., Verchot, L. V., and Veldkamp, E.: Testing a conceptual model of soil emissions of nitrous and nitric oxides, BioScience, 50, 667–680, 2000. de Bruijin, A. M. G., Butterbach-Bahl, K., Blagodatsky, S., and
Grote, R.: Model evaluation of different mechanisms driving freeze-thaw N2O emissions, Agr. Ecosyst. Environ., 133, 196– 207, 2009.
Del Grosso, S. J., Parton, W. J., Mosier, A. R., Walsh, M. K., Ojima, D. S., and Thornton, P. E.: DAYCENT national-scale simula-tions of nitrous oxide emissions from cropped soils in the United States, J. Environ. Qual., 35, 1451–1460, 2006.
Denman, K. L., Brasseur, G., Chidthaisong, A., Ciais, P., Cox, P. M., Dickinson, R. E., Hauglustaine, D., Heinze, C., Holland, E., Jacob, D., Lohmann, U., Ramachandran, S., da Silva Dias, P. L., Wofsy, S. C., and Zhang, X.: Couplings between changes in the climate system and biogeochemistry, in: Climate change 2007: The physical science basis. Contribution of working group I to the fouth assessment report of the intergovernmanetal panel on climate change, edited by: Solomon, S., Qin, D., Manning, M., and Chen, Z., Cambridge Univeristy Press, Cambridge, United Kingdom and New York, USA, 2007.
Dentener, F.: Global maps of atmospheric nitrogen deposition, 1860, 1993, and 2050, Dataset, available at: http://daac.ornl.gov/ from Oak Ridge National Laboratory Distributed Active Archive Center, Oak Ridge, Tennessee, USA, 2006.
Dermody, O.: Mucking through multifactor experiments; design and analysis of multifactor studies in global change research, New Phytol., 172, 598–600, 2006.
Dong, Y., Qi, Y., and Luo, J.: Experimental study on N2O and CH4fluxes from the dark coniferous forest zone soil of Gongga Mountain, China, Sci. China Ser. D, 48, 285–295, 2003. Fluckiger, J., Dallenbach, A., Blunier, T., Stauffer, B., Stocker, T.
F., Raynaud, D., and Barnola, J. M.: Variations in atmospheric N2O concentration during abrupt climatic changes, Science, 285, 227–230, doi:10.1126/science.285.5425.227, 1999.
Forster, P., Ramaswamy, V., Artaxo, P., Berntsen, T., Betts, R., Fahey, D. W., Haywood, J., Lean, J., Lowe, D. C., Myhre, G., Nganga, J., Prinn, N. R., Raga, G., Schulz, M., and Dorland, R. V.: Changes in atmospheric constituents and in radiative forcing, in: Climate change 2007: The physical science basis. Contribu-tion of working group I to the fouth assessment report of the in-tergovernmanetal panel on climate change, edited by: Solomon, S., Qin, D., Manning, M., and Chen, Z., Cambridge Univeristy Press, Cambridge, United Kingdom and New York, USA, 2007. Goldberg, S. D. and Gebauer, G.: Drought turns a Central Euro-pean Norway spruce forest soil from an N2O source to a transient N2O sink, Glob. Change Biol., 15, 850–860, doi:10.1111/j.1365-2486.2008.01752.x, 2009.
Heimann, M. and Reichstein, M.: Terrestrial ecosystem car-bon dynamics and climate feedbacks, Nature, 451, 289–292, doi:10.1038/nature06591, 2008.
Huang, B., Chen, G., Huang, G., and Hauro, T.: Nitrous oxide emis-sion from temperate meadow grassland and emisemis-sion estimation for temperate grassland of China, Nutr. Cycl. Agroecosys., 67, 31–36, 2003.
Ineson, P., Coward, P., and Hartwig, U.: Soil gas fluxes of N2O, CH4and CO2beneath Lolium perenne under elevated CO2: the Swiss free air carbon dioxide enrichment experiment, Plant Soil, 198, 89–95, 1998.
Jiang, C., Wang, Y., Hao, Q., and Song, C.: Effect of land-use change on CH4 and N2O emissions from freshwater marsh in Northeast China, Atmos. Environ., 43, 3305–3309, 2009. Kammann, C., Muller, C., Grunhage, L., and Jager, H.-J.:
Ele-vated CO2 stimulates N2O emissions in permanent grassland, Soil Biol. Biochem., 40, 2194–2205, 2008.
Kanerva, T., Paloj¨arvi, A., R¨am¨o, K., and Manninen, S.: Changes in soil microbial community structure under elevated tropospheric O3and CO2, Soil Biol. Biochem., 40, 2502–2510, 2008. Keller, M., Kaplan, W., and Wofsy, S.: Emissions of N2O, CH4
and CO2from tropical forest soils, J. Geophys. Res., 91, 11791– 11802, 1986.
Kettunen, R., Saarnio, S., Martikainen, P. J., and Silvola, J.: El-evated CO2 concentration and nitrogen fertilisation effects on N2O and CH4fluxes and biomass production of Phleum pratense on farmed peat soil, Soil Biol. Biochem., 37, 739–750, 2005. Kettunen, R. H., Saarnio, S., Martikainen, P. J., and Silvola, J.:
Can a mixed stand of N2-fixing and non-fixing plants restrict N2O emissions with increasing CO2concentration?, Soil Biol. Biochem., 39, 2538–2546, 2007.
Kort, E. A., Eluszkiewica, J., Stephens, B. B., Miller, J. B., Gerbig, C., Nehrkorn, T., Daube, B. C., Kaplan, J. O., Houweling, S., and Wofsy, S. C.: Emissions of CH4and N2O over the United States and Canada based on a receptor-oriented modeling framework and COBRA-NA atmospheric observations, Geophys. Res. Lett., 35, L18808, doi:10.1029/2008GL034031, 2008.
Li, C. S., Narayanan, V., and Harriss, R. C.: Model estimates of nitrous oxide emissions from agricultural lands in the United States, Global Biogeochem. Cy., 10, 297–306, 1996.
Li, C. S., Zhuang, Y. H., Cao, M. Q., Crill, P., Dai, Z. H., Frolk-ing, S., Moore III., B., Salas, W., Song, W. Z., and Wang, X. K.: Comparing a process-based agro-ecosystem model to the IPCC methodology for developing a national inventory of N2O emis-sions from arable lands in China, Nutr. Cycl. Agroecosys., 60, 159–175, 2001.
Lin, B., Sakoda, A., Shibasaki, R., Goto, N., and Suzuki, M.: Modeling a global biogeochemical nitrogen cycle in terrestrial ecosystems, Ecol. Modell., 135, 89–110, 2000.
Liu, L. and Greaver, T.: A review of nitrogen enrichment effects on three biogenic GHGs: the CO2sink may be largely offset by stimulated N2O and CH4emission, Ecol. Lett., 12, 1103–1117, 2009.
Liu, M., Tian, H., Chen, G., Ren, W., Zhang, C., and Liu, J.: Effects of land-use and land-cover change on evapotranspiration and wa-ter yield in China during 1900–2000, J. Am. Wawa-ter Resour. As., 44, 1193–1207, 2008.
Liu, Y.: Modeling the emissions of nitrous oxide (N2O) and methane (CH4)from the terrestrial biosphere to the atmosphere, Doctor of Philisophy in Global Change Science, Department of Earth, Atmospheric and Planetary Sciences, Massachusetts Insti-tute of Technology, Boston, 1996.
Lu, C., Tian, H., Liu, M., Ren, W., Xu, X., Chen, G., and Zhang, C.: Effect of nitrogen deposition on China’s terrestrial carbon up-take in the context of multi-factor environmental changes, Ecol. Appl., 22, 53–75, doi:10.1890/10-1685.1, 2012.
Luo, Y., Su, B., Currie, W., Dukes, J., Finzi, A., Hartwig, U., Hun-gate, B., Mc MURTRIE, R., Oren, R., and Parton, W.: Progres-sive nitrogen limitation of ecosystem responses to rising atmo-spheric carbon dioxide, BioScience, 54, 731–739, 2004. Matson, P. and Vitousek, P.: Ecosystem approach to a global nitrous
oxide budget, BioScience, 40, 667–672, 1990.
Matson, P., Vitousek, P., and Schimel, D.: Regional extrapolation of trace gas flux based on soils and ecosystems, in: Exchange of trace gases between terrestrial ecosystems and the atmosphere, edited by: Andreae, M. O. and Schimel, D. S., John Wiley and
Sons, New York, 97–108, 1989.
McGuire, A., Melillo, J., and Joyce, L.: The role of nitrogen in the response of forest net primary production to elevated atmo-spheric carbon dioxide, Annu. Rev. Ecol. Syst., 26, 473–503, 1995.
McGuire, A. D., Sitch, S., Clein, J. S., Dargaville, R., Esser, G., Foley, J., Heimann, M., Joos, F., Kaplan, J., Kicklighter, D. W., Meler, R. A., Melillo, J. M., Moore III., B., Prentice, I. C., Ramankutty, N., Reichenau, T., Schloss, A., Tian, H. Q., Williams, L. J., and Wittenberg, U.: Carbon balance of the ter-restrial biosphere in the twentieth century: Analyses of CO2, climate and land use effects with four process-based ecosystem models, Global Biogeochem. Cy., 15, 183–206, 2001.
Mcswiney, C. P. and Robertson, G. P.: Nonlinear response of N2O flux to incremental fertilizer addition in a continuous maize (Zea mays L.) cropping system, Glob. Change Biol., 11, 1712–1719, 2005.
Mesinger, F., DiMego, G., Kalnay, E., Mitchell, K., Shafran, P. C., Ebisuzaki, W., Jovic, D., Woollen, J., Rogers, E., Berbery, E. H., Ek, M. B., Fan, Y., Grumbine, R., Higgins, W., Li, H., Lin, Y., Manikin, G., Parrish, D., and Shi, W.: North American regional reanalysis, B. Am. Meteorol. Soc., 87, 343–360, 2006.
Mosier, A., Schimel, D., Valentine, D., Bronson, K., and Parton, W.: Methane and nitrous oxide fluxes in native, fertilized and cultivated grasslands, Nature, 350, 330–332, 1991.
Mu, Q. Z., Zhao, M. S., Running, S. W., Liu, M. L., and Tian, H. Q.: Contribution of increasing CO2and climate change to the carbon cycle in China’s ecosystems, J. Geophys. Res.-Biogeo., 113, G01018, doi:10.1029/2006JG000316, 2008.
Norby, R. J. and Luo, Y.: Evaluating ecosystem responses to rising atmospheric CO2 and global warming in a multi-factor world, New Phytol., 162, 281–293, 2004.
Phillips, R., Whalen, S., and Schlesinger, W.: Influence of atmo-spheric CO2enrichment on nitrous oxide flux in a temperate for-est ecosystem, Global Biogeochem. Cy., 15, 741–752, 2001. Pilegaard, K., Skiba, U., Ambus, P., Beier, C., Br¨uggemann, N.,
Butterbach-Bahl, K., Dick, J., Dorsey, J., Duyzer, J., Gallagher, M., Gasche, R., Horvath, L., Kitzler, B., Leip, A., Pihlatie, M. K., Rosenkranz, P., Seufert, G., Vesala, T., Westrate, H., and Zechmeister-Boltenstern, S.: Factors controlling regional differ-ences in forest soil emission of nitrogen oxides (NO and N2O), Biogeosciences, 3, 651–661, doi:10.5194/bg-3-651-2006, 2006. Potter, C. S., Matson, P. A., Vitousek, P. M., and Davidson, E. A.: Process modeling of controls on nitrogen trace gas emissions from soils worldwide, J. Geophys. Res., 101, 1361–1377, 1996. Reich, P. B., Hobbie, S. E., Lee, T., Ellsworth, D. S., West, J. B.,
Tilman, D., Knops, J. M. H., Naeem, S., and Trost, J.: Nitro-gen limitation constrains sustainability of ecosystem response to CO2, Nature, 440, 922–925, doi:10.1038/nature04486, 2006. Ren, W., Tian, H., Liu, M., Zhang, C., Chen, G., Pan, S.,
Felzer, B., and Xu, X.: Effects of tropospheric ozone pollu-tion on net primary productivity and carbon storage in terrestrial ecosystems of China, J. Geophys. Res.-Atmos., 112, D22S09, doi:10.1029/2007JD008521, 2007.
doi:10.1111/j.1466-8283.2010.00606.x, 2011a.
Ren, W., Tian, H., Xu, X., Liu, M., Lu, C., Chen, G., Melillo, J. M., Reilly, J., and Liu, J.: Spatial and temporal patterns of CO2and CH4fluxes in China’s croplands in response to multifactor envi-ronmental changes, Tellus B, 63B, 222–240, doi:10.1111/j.1600-0889.2010.00522.x, 2011b.
Repo, M. E., Susiluoto, S., Link, S. E. L., Jokinen, S., Elsakov, V., Biasi, C., Virtanen, T., and Martikainen, P. J.: Large N2O emissions from cryoturbated peat soil in tundra, Nat. Geosci., 2, 189–192, 2009.
Rodhe, H.: A comparison of the contribution of various gases to the greenhouse effect, Science, 248, 1217–1219, 1990.
Song, C., Xu, X., Tian, H., and Wang, Y.: Ecosystem-atmosphere exchange of CH4and N2O and ecosystem respiration in wetlands in the Sanjiang Plain, Northeastern China, Glob. Change Biol., 15, 692–705, 2009.
Tian, H., Melillo, J. M., Kicklighter, D. W., Pan, S., Liu, J., McGuire, A. D., and Moore III., B.: Regional carbon dynam-ics in monsoon Asia and its implications for the global carbon cycle, Global Planet. Change, 37, 201–217, 2003.
Tian, H., Chen, G., Liu, M., Zhang, C., Sun, G., Lu, C., Xu, X., Ren, W., Pan, S., and Chappelka, A.: Model estimates of net primary productivity, evapotranspiration, and water use efficiency in the terrestrial ecosystems of the southern United States during 1895– 2007, Forest Ecol. Manag., 259, 1311–1327, 2010a.
Tian, H., Xu, X., Liu, M., Ren, W., Zhang, C., Chen, G., and Lu, C.: Spatial and temporal patterns of CH4 and N2O fluxes in terrestrial ecosystems of North America during 1979–2008: ap-plication of a global biogeochemistry model, Biogeosciences, 7, 2673–2694, doi:10.5194/bg-7-2673-2010, 2010b.
Tian, H., Lu, C., Chen, G., Xu, X., Liu, M., Ren, W., Tao, B., Sun, G., Pan, S., and Liu, J.: Climate and land use controls over terrestrial water use efficiency in Monsoon Asia, Ecohydrology, 4, 322–340, 2011a.
Tian, H., Xu, X., Lu, C., Liu, M., Ren, W., Chen, G., Melillo, J. M., and Liu, J.: Net exchanges of CO2, CH4, and N2O between China’s terrestrial ecosystems and the atmosphere and their con-tributions to global climate warming, J. Geophys. Res., 116, G02011, doi:10.1029/2010JG001393, 2011b.
Vitousek, P. and Farrington, H.: Nutrient limitation and soil devel-opment: experimental test of a biogeochemical theory, Biogeo-chemistry, 37, 63–75, 1997.
Vitousek, P. M., Mooney, H. A., Lubchenco, J., and Melillo, J. M.: Human domination of Earth’s ecosystems, Science, 277, 494– 499, 1997.
Wang, X., Manning, W., Feng, Z., and Zhu, Y.: Ground-level ozone in China: distribution and effects on crop yields, Environ. Pollut., 147, 394–400, 2007.
Williams, E., Hutchinson, G., and Fehsenfeld, F.: NOxand N2O emissions from soil, Global Biogeochem. Cy., 6, 351–388, 1992. Xia, J., Han, Y., Zhang, Z., Zhang, Z., and Wan, S.: Effects of di-urnal warming on soil respiration are not equal to the summed effects of day and night warming in a temperate steppe, Biogeo-sciences, 6, 1361–1370, doi:10.5194/bg-6-1361-2009, 2009. Xu, X., Tian, H., and Hui, D.: Convergence in the
relation-ship of CO2and N2O exchanges between soil and atmosphere within terrestrial ecosystems, Glob. Change Biol., 14, 1651– 1660, doi:10.1111/j.1365-2486.2008.01595.x, 2008.