AUTOMATIC TEXTURE AND ORTHOPHOTO GENERATION
FROM REGISTERED PANORAMIC VIEWS
U. Krispela,d, H. L. Eversb, M. Tamkeb, R. Viehauserc, D. W. Fellnerd,e
a
Fraunhofer Austria, Graz, Austria - [email protected]
b Centre for Information Technology and Architecture (CITA), Copenhagen, Denmark - (heve, martin.tamke)@kadk.dk c
Institute for Computer Graphics and Vision (ICG), TU Graz, Austria d Institute of ComputerGraphics and KnowledgeVisualization (CGV), TU Graz, Austria
e GRIS, TU Darmstadt & Fraunhofer IGD, Darmstadt, Germany
Commission V, WG V/4
KEY WORDS:spherical panorama, image registration, texturing, point clouds, machine learning, automated generation of semantic information
ABSTRACT:
Recent trends in 3D scanning are aimed at the fusion of range data and color information from images. The combination of these two outputs allows to extract novel semantic information. The workflow presented in this paper allows to detect objects, such as light switches, that are hard to identify from range data only. In order to detect these elements, we developed a method that utilizes range data and color information from high-resolution panoramic images of indoor scenes, taken at the scanners position. A proxy geometry is derived from the point clouds; orthographic views of the scene are automatically identified from the geometry and an image per view is created via projection. We combine methods of computer vision to train a classifier to detect the objects of interest from these orthographic views. Furthermore, these views can be used for automatic texturing of the proxy geometry.
(a) (b)
Figure 1: The data acquisition equipment: For range data acqui-sition, a Faro Focus 3D Scanner was used (a); additional color information was obtained using a customized adapter connecting the base tripod of the 3D scanner with a HDRI camera (b).
1. INTRODUCTION
Many 3D scanners provide more information than range data, as for instance color information. The scanners are equipped with a camera that takes photographs during the scanning ses-sion. These photographs are subsequently stitched in order to create a panoramic photo sphere at the scanners position. Such panoramic views can then be used to apply color information to pure range data.
Sole point clouds are unstructured and have no semantic infor-mation. This challenges their integration into existing work flows of stakeholders, such as engineers and architects (Tamke et al., 2014). The interplay of geometric and color information carries meaningful aspects that provide so far unused semantic informa-tion to 3d scan data. Objects that are hard to detect on a geomet-rical level, might be revealed in a visual inspection of the dataset and provide the information needed for semantic processing.
In case of scanned building data this information can be stored alongside the data e.g. to make future renovations and recon-structions more efficient. Within the DURAARK project1, the presented tool is already used to enrich the initially unstructured point cloud data with this semantic information on electrical in-stallations.
The problem with wall mounted power sockets is that they usu-ally stick only 3-4 mm out of the surrounding surface. This makes them hard to detect in pure range data, as they disappear in the geometric noise of a 3D scan. A recognition using a purely im-age based (2D) approach, with the photographs obtained during the scanning, will not succeed in all cases, as the perceived ob-jects might be severely distorted. Therefore, it is necessary to combine the geometric information of the point cloud scans with the images of the session in order to create orthographic views of planar elements in the scene (e.g. walls) that contain the desired perceived objects (e.g. sockets). Computer vision methods can be applied using these views to train and perform object detection.
In this paper, we present such a work flow that identifies and cre-ates orthographic views. These views are created from registered panoramic images and a proxy geometry that was derived from the point clouds.
2. RELATED WORK
Spherical panoramic imaging is a widely used technique to ac-quire photographs of a scene using a complete field of view, i.e. capture all surroundings of a specific viewpoint. These spherical panoramic images are typically created by the fusion of a num-ber of photographs, taken from different directions at the same position. Alternatively, special hardware exists that acquires a panoramic view directly.
1
The work of D’Annibale et al. (D’Annibale and Fangi, 2009) has been concerned with spherical photogrammetry, i.e. using spher-ical panoramic images for surveying and reconstruction. Photo-texturing of 3D models from surveyed data has been in the fo-cus of the work of Grammatikopoulos et al. (Grammatikopoulos et al., 2007) by combining 3D models from laser scanning and multi-image texture projection.
The automatic creation of texture maps from geometry has also been a relevant research topic, as this will aid in in many appli-cations that involve the creation of textures for 3D models, for example in the entertainment industry. The work of Levy et al. (L´evy et al., 2002) for example creates an automatic texture atlas (or an atlas of charts) for an given object. A similar approach that obtains an atlas based on surface features was presented by Zhang et al. (Zhang et al., 2005).
Furthermore, the same set of problems has to be addressed when doing purely image-based reconstruction, as was the case in the work of Furukawa et al. (Furukawa et al., 2009) for indoor scenes, or the work of Pitzer et al. (Pitzer et al., 2010) which used a robot for a fully automated approach for indoor scene reconstruc-tion. The work of Waechter et al. (Waechter et al., 2014) was concerned with the problem of large scale texturing for achiev-ing photoconsistency over multiple images in image-based recon-struction.
3. METHOD OVERVIEW
Our method is designed for the acquisition of indoor scenes, there-fore, we assume that most of the surfaces will be planar (floor, walls etc). The method identifies planar, rectangular regions in the scene and produces an orthographic view (image) of desired resolution. An overview of the work flow is shown in Figure2.
In the data acquisition phase, the scene is scanned using a laser scanning device, which yields a point cloud and a low resolution panoramic image. Furthermore, a high resolution panoramic im-age is acquired using a camera.
The preprocessing phase consists of creating a 3D surface model of the scene using a semiautomatic approach, and the alignment of the high resolution panoramic image to the point cloud scan.
In the last step, the rectangular planar regions (patches) are iden-tified from the surface model, and an orthographic view is created per patch, by projecting the color information from the high res-olution panoramic image onto the patch at a desired resres-olution.
4. DATA ACQUISITION AND PREPROCESSING
After the physical data acquisition, the data needs to be prepro-cessed for the ortho view generation. The developed workflow consists of publicly available software components, which are partially interfaced with custom scripts. Used tools are: Faro Scene2point cloud software, CloudCompare3point cloud soft-ware, ptGUI Pro4panoramic image software and Rhinoceros 55 / Grasshopper63D modeling software. The point cloud is con-verted into E57 Format (Huber, 2011).
4.1 Measuring Equipment
The data acquisition has been done using a terrestrial laser scan-ner (Faro Focus 3D), as shown in Figure1a. The acquired data
2
http://www.faro.com/
3
http://cloudcompare.org/
4
http://www.ptgui.com/
5
http://www.rhino3d.com/
6
http://www.grasshopper3d.com/
Figure 3: The stitching of Canon DSLR Images to panoramic HDRI was carried out in ptGUI Pro (a).
(1)
(2)
(3)
(4)
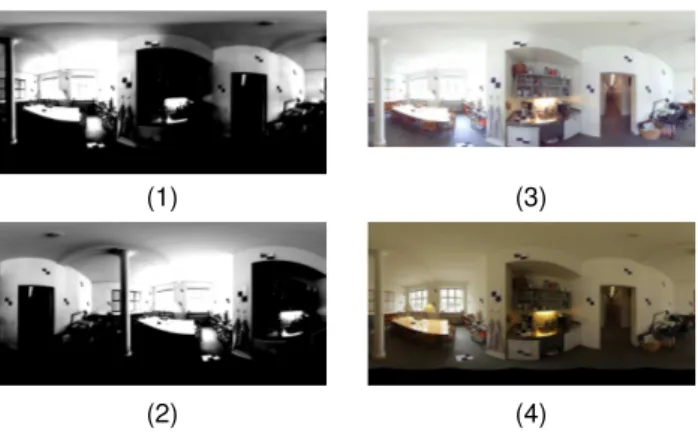
Figure 4: Image-based registration: the normalized panoramic image taken with the DSLR (2) has to be aligned to the normal-ized panoramic image which was exported from the laser scan-ning unit (1). The automatic alignment described in Section4.2 produces an aligned high-resolution panoramic image (4) which is aligned to the panoramic image from the laser scanning unit (3).
is a 3D point cloud (Figure5a) and a set of images, which can be stitched into a single spherical panoramic image. First exper-iments showed that the images acquired from the inbuilt camera in the Faro Focus 3D often exhibit overexposed or underexposed areas. Hence, a series of 6 sets of 9 bracketing photos was ad-ditionally acquired. These constitute a spherical high dynamic range (HDR) panoramic image. In order to obtain the panoramic image at the same position as the 3D scanner, an adapter for the base tripod of the 3D scanner has been developed, see Figure1b. This allows a professional Canon 500D digital single-lens reflex (DSLR) camera to be mounted and take panoramic images with the help of a Nodal Ninja 3.
4.2 Panoramic Image Registration
A special focus in the development of the work flow was to de-liver panoramic images that are precisely registered to the point cloud. At first, the images from the Canon DSLR are stitched together to a spherical HDRI panoramic image within the ptGUI Pro panoramic image software, see Figure3.
Although the panoramic image was taken at the scanner location, the image returned from the stitching software will not be aligned azimuth-wise (a rotation about the up direction) in general. We resolve this degree of freedom by image based method; the high-resolution panoramic image is aligned to the panoramic image of the Faro Focus 3D, which registered to the point cloud, as shown in Figure4.
data acquisition laser scanner
data acquisition DSLR
pointcloud
registered panoramic image
unregistered high-res panoramic image
geometry generation
panoramic image registration
3D surface model (OBJ)
registered high-res panoramic image
patch detection & ortho view projection
3D model with texture coords
orthographic views (textures)
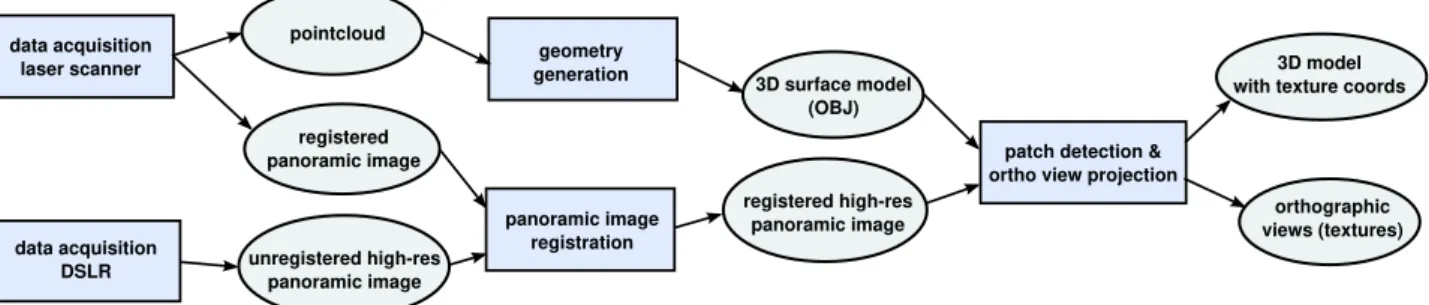
Figure 2: Overview of the whole work flow: boxes depict methods and ellipses reflect (intermediate) results. First, the acquired input data is registered and preprocessed (geometry generation and panoramic image registration). Afterwards, the patch detection and ortho view projection step identifies rectangular patches in the input geometry and generates an orthographic image for each patch, as well as texture coordinates for the 3D surface model.
the azimuth axis for each pixel position, and finding the minimal SAD (sum of absolute differences). In the rare cases where the lighting conditions between the laser scan and the DSLR photo acquisition were substantially different, it was necessary to ex-amine several local minimums of this error function, as the global minimum might not correlate to the optimal position.
4.3 Geometry generation
Several approaches to model the base 3D model for the creation of the orthographic images exist and have been discussed and used within the project:
The base 3d model can bemanually modeledwith an underlying 3d point cloud as reference. The need for consistency in the test data prohibited this approach.
A desirableautomated process of geometry generationcan be achieved through a point cloud reconstruction software similar to the Poisson Surface Reconstruction algorithm by (Kazhdan et al., 2006). This, for example, is integrated in the open source CloudCompare. These approaches results often in high amounts of faces and topological complexity, as preliminary tests showed. This is generally not wanted and conflicted with the projects ini-tial limitation for quad-based geometries.
An alternative automatic generationof a simplified 3D base model can be achieved by extracting the architectural spaces within a point cloud like described in (Tamke et al., 2014). While this method would work very well, it is based on the extraction of several spaces in point clouds with multiple scans. The approach described in this paper uses at the moment only single scans.
Asemi-automated approachensures the consistency and over-come both human in-accuracies and topological complexity. The employed approach uses a random sample consensus (RANSAC) algorithm (Schnabel et al., 2007), which detects planes within the point cloud Figure5b. The resulting clusters are imported into Rhinoceros 5 through a custom IronPython7 script in the visual programming plug-in Grasshopper. This reads the clusters and separates them into walls, ceiling and floor by orientation and area thresholds, and organizes them in a polar coordinate space. From this, a simple quad based mesh model of the room is cre-ated (Figure5c). This is delivered as OBJ geometry to the next step in the work flow.
5. ORTHO VIEW GENERATION
From the acquired and processed data (geometry and registered panoramic images) we obtain orthographic images using the fol-lowing approach: First, the method processes the input geometry
7
http://ironpython.net/
(a) point cloud
(b) point cloud with detected planes
(c) point cloud with final geometry
to identify elements (triangles, quads) lying in the same plane. For a group of such elements an oriented bounding box with min-imal area is fitted, which we call apatch. For each patch, an ortho view is created via projection of the panoramic image.
5.1 Patch detection
In order to generate a meaningful number of patches, the input geometry has to be analyzed and grouped. We begin by first clus-tering the surface elements by their normal vector, this is done using a mean shift (Comaniciu and Meer, 2002) clustering in the space of normalized normal directions. We use a flat kernel with size 0.3.
This yields a group ofkclusters that correspond to similar di-rections. We denote these clustersd0· · ·dkand their normal
di-rections~n0· · ·~nk. However, this clustering step will not group
elements that lie in a similar plane, but have opposite normal di-rections.
In order to group the elements with opposite normal directions, we perform a second clustering step on the rows of thek×k -matrixAn
, whose row and column indicesicorrespond to a clus-terdi. The elementsaijofAncorrespond to a 1 if
|h~ni, ~nji| ≥0.95
and 0 otherwise. The equivalent rows ofAncorrespond to
clus-ters of principal normal directions.
After grouping the elements into the main directions, we need to perform another clustering step to group elements that lie in the same plane. We use normal projection to project the midpoint of each element on the line corresponding to the principal direction, and perform a third clustering step on the length of the projected vector. Again, we use meanshift, this time with a flat kernel of size 0.1m. The resulting clusters correspond to the elements with similar main direction, lying in the same plane.
When these final clusters have been found, an arbitrary orthonor-mal basis is identified using the approach of Frisvad (Frisvad, 2012), where the Z direction corresponds to the cluster plane nor-mal. Finally, a bounding rectangle of the elements in the plane with minimal area is obtained, by evaluating an exhaustive search over 90 orientations in 1-degree steps, which yields a final local coordinate system for each patch.
5.2 Image data projection
As the pose of the panoramic sphere corresponds to the pose of the scanner, we obtain this information directly from the exported point cloud in E57 format. The pose consists of an Euclidean transformation, which is expressed by a position vector and a ro-tation quaternion.
The system now proceeds to create an orthographic view of each patch, given a desired resolution in mm/pixel, using a simple pro-jection approach which is shown in Figure6: For each pixelpof the patch, the system creates a ray from the corresponding 3D po-sition to the center of the panoramic sphere. The intersectionp′
of the ray and the sphere is then transformed into the local spher-ical coordinate system of the panoramic sphere, which yields the azimuth angleφand the elevation angleθ. These angles are used to acquire the color value of this pixel from the panoramic photo-graph.
Finally, the system also creates texture coordinates for the input geometry. The texture coordinates are obtained by projecting the vertices of each surface element into the local patch coordinate system, and normalizing the result to texture coordinate range. The textured model is written as .OBJ file to disk.
X Y Z X' Y' Z' p' p φ θ
Figure 6: A rectangular patch in 3D space is sampled at a specific resolution, e.g. 1 pixel/mm. Each pixelpis transformed into the local coordinate frame(X′, Y′, Z′)of the panoramic sphere in
spherical coordinate angles azimuthφand elevationθ to deter-mine the color value in the panoramic image.
6. APPLICATION AND RESULTS
We evaluated the method on scans of several indoor scenes. The resulting orthographic views were used in an computer vision pipeline to detect electrical appliances, i.e. sockets and switches.
6.1 Reconstructions
We applied the described pipeline to 6 scans of indoor scenes. Two examples can be seen in Figure7. A third example, also showing the generated ortho views, is shown in Figure8. A room with slightly more complex geometry can be seen in Figure9.
The clustering was able to group suitable elements in all datasets. For example, the input geometry of the scene depicted in Figure7 (left column) consists of 218 triangles and 76 quadrilateral faces, which have been grouped into 3 main directions and 15 ortho patches.
6.2 Electrical Appliance Detection
The extracted ortho views are well suited for image processing methods in order to detect different wall-mounted objects. Ex-ploiting the known relation from pixel to the actual wall geome-try, the scale of the searched objects in the image is fixed to 1mm per pixel. Thus, object detection can be performed by a simple sliding window approach: For each pixelP(i)of an ortho view, the detection probability of a object class is determined by ana-lyzing a small image patch centered aroundP(i).
Detecting power sockets and light switches in arbitrary indoor scenes form a reasonable application example. However, these objects can be very challenging to classify: they are usually un-textured and designed to be unobtrusive, but on the other hand they exist in many variations regarding shape and colors. In gen-eral, sockets and switches are mostly defined by their silhouettes and mostly homogenous coloration of varying colors (e.g. differ-ent brands).
It is therefore practical to make use of both gradient and color information in the search window. Thus, we form the following feature descriptor pool:
Figure 7: Two indoor scenes in different stages of reconstruction. The acquired high-resolution input panoramas (top row) were aligned to the geometry that was created from the laser range scan. The middle row shows the input geometry, and the aligned panoramic spheres. In the bottom row we see the same geome-try using the generated orthographic views as textures, the ceiling has been omitted for a better visualization.
• A self developed descriptor that models the distribution of image gradients differently than the HoG descriptor. For each window pixel where the local gradient magnitude is larger than a threshold, we calculate the unit vector~v(P(i)) pointing in the gradient directionϕi:~v(P(i)) = (1,∠ϕi).
Projecting~v(P(i))onto a set of 4 fixed unit vectors, each 45oapart of its neighbors. yield a 4 dimensional value that
uniquely and continuously describe the vectors direction. By considering only the absolute values of the projections, the descriptor becomes invariant to contrary object- and wall-intensity values. The final descriptor entries are build by comparing the mean orientation values of randomly sized and located sub-regions, similar to Haar-like features from (Viola and Jones, 2001).
• In order to model the color distribution, the color channels (RGB) of the image patch are separated. Again, differences in mean intensity values of randomly sized and located sub-region pairs over all 3 channels form the descriptor entries.
All these descriptors are combined by concatenating their entries to one feature vector.
According to its values, a pre-trained random forest classifier (Breiman, 2001) retrieves the probability of each class. In or-der to train the classifier, we created a large training set of la-beled image patches representing 3 object classes: power socket, light switch and background. After classification, a subsequently applied non- maxima suppression on the class probability maps yield the final detection results.
(a) panoramic input image
(b) generated orthographic views (patches)
(c) textured geometry
(a) (b)
Figure 9: Our workflow is able to handle rooms with non-orthogonal geometry, as long as all important aspects can be scanned from one position.
(a)
(b)
(c)
Figure 10: We use computer vision methods to train a classifica-tion system and detect electrical appliances, in this case switches. The two trained classes correspond to switches (violet rectangles) and sockets (orange rectangles).
7. CONCLUSION AND FUTURE WORK
In this paper, we presented a work flow for the semiautomatic ex-traction of orthographic views for indoor scenes from laser range scans and high resolution panoramic images. The resulting im-ages have been used within a computer vision pipeline to detect electrical appliances in a room.
While the images are sufficient for our application purpose of object detection, the ortho views might contain projection errors where the supplied geometry, which is often an approximation, differs from the real scene which is shown in the panoramic im-age. As an example, the room shown in Figure7on the left has a column inside which is not reflected in the input geometry, there-fore the column is projected on the wall. One future research di-rection is therefore to find ways to either create less approximated input geometry, or make use of the point cloud information e.g. to filter out pixels in an ortho view whose projected depth lies outside the ortho view plane.
However, it might not be possible to scan all important contents of a room using only a single scan, as not all parts of the room might be visible from one location. Furthermore, using only a single scan might yield a poor resolution of the parts that are far from the scanning position, as can be seen on the left of Fig-ure9. Another important aspect of future work is therefore to research methods to integrate the information of multiple scans and panoramic images into a single model.
8. ACKNOWLEDGEMENTS
REFERENCES
Breiman, L., 2001. Random forests. Machine learning 45(1), pp. 5–32.
Comaniciu, D. and Meer, P., 2002. Mean shift: A robust approach toward feature space analysis. IEEE Trans. Pattern Anal. Mach. Intell. 24(5), pp. 603–619.
Dalal, N. and Triggs, B., 2005. Histograms of oriented gradients for human detection. In: Computer Vision and Pattern Recogni-tion, 2005. CVPR 2005. IEEE Computer Society Conference on, Vol. 1, IEEE, pp. 886–893.
D’Annibale, E. and Fangi, G., 2009. Interactive modeling by pro-jection of oriented spherical panoramas. the case of ad deir-petra. In: Proceedings of 3D-ARCH 2009: 3D Virtual Reconstruc-tion and VisualizaReconstruc-tion of Complex Architectures, Vol. XXXVIII-5/W1.
Frisvad, J. R., 2012. Building an orthonormal basis from a 3d unit vector without normalization. Journal of Graphics Tools 16(3), pp. 151–159.
Furukawa, Y., Curless, B., Seitz, S. M. and Szeliski, R., 2009. Reconstructing building interiors from images. In: International Conference on Computer Vision, pp. 80–87.
Grammatikopoulos, L., Kalisperakis, I., Karras, G. and Petsa, E., 2007. Automatic multi-view texture mapping of 3d surface projections. In: Proceedings of 3D-ARCH 2007: Virtual Re-construction and Visualization of Complex Architectures, Vol. XXXVI-5/W47.
Huber, D., 2011. The astm e57 file format for 3d imaging data exchange. In: Proceedings of the SPIE Vol. 7864A, Electronics Imaging Science and Technology Conference (IS&T), 3D Imag-ing Metrology, Vol. 7864A.
Kazhdan, M., Bolitho, M. and Hopper, H., 2006. Poisson surface reconstruction. In: K. Polthier and A. Sheffer (eds), Eurographics Symposium on Geometry Processing (2006).
L´evy, B., Petitjean, S., Ray, N. and Maillot, J., 2002. Least squares conformal maps for automatic texture atlas generation. ACM Trans. Graph. 21(3), pp. 362–371.
Pitzer, B., Kammel, S., DuHadway, C. and Becker, J., 2010. Au-tomatic reconstruction of textured 3d models. In: IEEE Inter-national Conference on Robotics and Automation, ICRA 2010, Anchorage, Alaska, USA, 3-7 May 2010, pp. 3486–3493.
Schnabel, R., Wahl, R. and Klein, R., 2007. Efficient ransac for point-cloud shape detection. Computer Graphics Forum 26(2), pp. 214–226.
Szeliski, R., 2004. Image alignment and stitching: A tutorial. Technical Report MSR-TR-2004-92, Microsoft Research.
Tamke, M., Bl¨umel, I., Ochmann, S., Vock, R. and Wessel, R., 2014. From point clouds to definitions of architectural space -potentials of automated extraction of semantic information from point clouds for the building profession. In: E. M. Thomp-son (ed.), Proceedings of the 32nd eCAADe Conference, Vol. 2, pp. 557–566.
Viola, P. and Jones, M., 2001. Rapid object detection using a boosted cascade of simple features. In: Computer Vision and Pattern Recognition, 2001. CVPR 2001. Proceedings of the 2001 IEEE Computer Society Conference on, Vol. 1, IEEE, pp. I–511.
Waechter, M., Moehrle, N. and Goesele, M., 2014. Let there be color! — Large-scale texturing of 3D reconstructions. In: Proceedings of the European Conference on Computer Vision, Springer.