Assessing the predictability of ANB, 1-NB, P-NB and
1-NA measurements on Steiner cephalometric analysis
Ana Cláudia Laureano Navarro1, Luiz Sérgio Carreiro2, Claudenir Rossato3, Ricardo Takahashi2, Carlos Eduardo de Oliveira Lima2
Objective:To evaluate, in the initial and inal stages of corrective orthodontic treatment, the predictability of the ANB, 1-NB, PNB and 1-NA during case individualization, which considers the characteristics of the patient, pro-fessional experience and the mechanics to be used. Methods: Ninety patients were selected at the State University of Londrina (UEL, Brazil), presenting Angle Class I and II malocclusions, treated with and without extraction of four premolars and divided into three groups: Horizontal, balanced and vertical. The cephalometric variables were evaluated in the initial, prognosis and inal stages of treatment in order to observe the behavior of the estimates, or how they were higher or lower than the values obtained. Results: It was noticed the inluence of the facial pattern on the behavior of the measures examined, the values proposed for the ANB were statistically diferent from values obtained at the end of the treatment; in the vertical group the inal value was the one that most approached the proposed value; regarding 1-NB the values proposed with the Steiner analysis for the balanced and vertical groups were not achieved. For P-NB, there was no diference between genders. For 1-NA it was observed that the values obtained at the end of treatment difer from estimates in the three groups. Conclusions: The limitations of the estimates of the measures do not invali-date its clinical or teaching use, if aware of its deiciencies, the analysis can be used with restrictions.
Keywords:Growth and development. Radiography. Tooth movement.
How to cite this article: Navarro ACL, Carreiro LS, Rossato C, Takahashi R, Lima CEO. Assessing the predictability of ANB, 1-NB, P-NB and 1-NA mea-surements on Steiner cephalometric analysis. Dental Press J Orthod. 2013 Mar-Apr;18(2):125-32.
Submitted: August 18, 2009 - Revised and accepted: October 11, 2011
Contact address: Ana Cláudia Laureano Navarro Rua Jorge Velho, 784 Vila Ipiranga - Londrina-PR, Brazil CEP 86010-600 – E-mail: [email protected]
1 Specialist in Orthodontics, Londrina State University. 2 Associate Professor, Londrina State University 3 Assistant Professor, Londrina State University
» The author reports no commercial, proprietary or financial interest in the products or companies described in this article.
Objetivo:avaliar, nas fases inicial e inal de tratamento ortodôntico corretivo, a previsibilidade das medidas ANB, 1-NB, P-NB, e 1-NA durante a individualização dos casos, onde se consideram as características inerentes do pacien-te, bem como a experiência do proissional e a mecânica a ser utilizada. Métodos: foram selecionados 90 pacientes, tratados na UEL, apresentando Classes I e II de Angle, tratados com e sem extrações de quatro pré-molares e divididos em três grupos: horizontal, equilibrado e vertical. As grandezas cefalométricas foram avaliadas nas fases inicial, pro-posta e inal de tratamento, com o intuito de observar o comportamento das estimativas, ou seja, o quanto elas foram maiores ou menores que os valores obtidos. Resultados: constatou-se inluência do padrão facial no comportamento das medidas analisadas; os valores propostos para o ANB foram estatisticamente diferentes dos valores obtidos ao inal do tratamento; no grupo vertical, o valor inal foi o que mais se aproximou do valor proposto; em relação à medida 1-NB, os valores propostos durante a elaboração da análise de Steiner para os grupos equilibrado e vertical não foram alcançados. Para medida PNB, não se observou diferença entre os sexos. Na medida 1-NA, foi observado que os va-lores obtidos ao inal do tratamento diferem das estimativas nos três grupos analisados. Conclusão: as limitações das estimativas das medidas não invalidam seu emprego clínico ou didático, desde que, conscientes de suas deiciências, sejam utilizadas com restrições.
INTRODUCTION
With the development of the cephalostat and the con-sequent standardization of the radiographs, in 1931, it be-came possible to carry out several cephalometric analyses based on average angular and linear values, obtained from individuals with normal occlusion and a satisfactory
fa-cial proile.4,12 These values allow for comparisons with
those from the patient, verifying the skeletal and dental pattern and the structures that show discrepancies from the norms, thus making diagnosis and the development
of individualized treatment plans possible.27
In the mid 40’s, Tweed included the movement of the lower incisors in the planning of clinical cases, with the purpose of obtaining an ideal occlusion ater an orthodontic treatment. He described that these teeth should present a 90° angle to the mandibular plane, with a tolerable variation of around +5°.
In 1948, Downs6 determined nine angular and one
linear measurement, which described the skeletal and dental patterns of Caucasian North Americans, with an excellent clinical occlusion, thus carrying out the irst systematic cephalometric analysis. For the author, de-spite the considerable variation in type and facial pat-tern, in order for individuals to present a good func-tional and esthetic balance, they should possess certain common characteristics of the proile.
Realizing that most orthodontists did not call upon cephalometry as a clinical diagnosis resource, since they saw it as a purely scientiic instrument used for research
purposes, Steiner,25-28 in the following decade, proposed
an analysis based, empirically, on the dentoalveolar compensatory mechanism, which helped profession-als to determine the nature of the bad occlusion, mak-ing the development of treatment plans more objec-tive. Using the analyses of Downs, Margolis, Riedel, Thompson, and Wylie, combined with some of his own cephalometric values, he established his own analysis for young leucoderms of Anglo-Saxon origin from the United States.
When arguing the value of Steiner’s analysis, one must bear in mind the references and the choices available at that time. Jaw functional orthopedics was incipient and not very propagated amongst American orthodontists, therefore, it did not emphasize orthopedic problems such as the lower facial height, the relative length of the jaw and mandible, the facial convexity angle or the
measure-ments of the posterior cranial base.25-28
Steiner’s analysis was well accepted by many re-searchers who, mindful of the occurrence of variations
related to the diferent ethnic and racial groups,27,28 set
out to verify if the values proposed by Steiner could be applied to diferent population groups. Several studies, mainly in relation to the dental patterns pro-posed by Steiner (1-NA = 4 mm and 1-NB = 4 mm), have demonstrated diferent values from the proposed
norm.1,9,16,21,23,29 Some authors, concerned with better
analyzing and planning their cases, established the ideal cephalometric norms and the acceptable compromises
of this analysis to diferent racial and ethnic groups.29
To develop a treatment plan, along with anamne-sis and clinical analyanamne-sis, some diagnostic elements are fundamental, as study models, intraoral x-rays, extra-oral X-rays (panoramic and cephalometric) and intra-oral and extraintra-oral photographs. Each diagnostic ele-ment presents different ways of evaluation. For that purpose, we have used Steiner’s analysis to estimate the qualitative and quantitative growth, with a view to establish treatment goals, thus becoming an im-portant tool for the elaboration of treatment plans. Despite being an important tool for the clinician, it presents a certain degree of subjectivity, when it comes to estimating each patient’s growth.
The result of an orthodontic treatment can some-times be distorted by the stubbornness of some re-searchers who insist on the fact that the statistical aver-ages should match the inal objective of the treatment. This has determined the elaboration of this study with the purpose of analyzing, in the inal phase of corrective orthodontic treatment, the predictability of the mea-surements ANB, 1-NB, P-NB, and 1-NA, estimated on the individualization of Steiner’s analysis, consider-ing horizontal, balanced and vertical growth patterns.
MATERIAL AND METHODS
Material
Sample collection
ANB, 1-NB, P-NB and 1-NA cephalometric mea-surements were collected from the patients’ iles and the individualizations were done by Professors from the Course of Orthodontics, Londrina State University. Af-ter the analysis, the research was approved by the Ethics Committee under CEP opinion nº 042/08. The following inclusion factors were considered for sample selection.
Inclusion factors
» Patients with Angle Class I and Class II
malocclu-sion, treated with or without extractions.
» Patients with no deleterious oral habits.
» Cases that were well inished, both esthetically and
functionally, with complete initial and inal records.
» Patients treated at the Orthodontics
Specializa-tion Course of the Londrina State University.
» Lateral cephalometric radiographs taken with a
Polomex-Siemens cephalometric device, mod-el Orthopantomagraph 10E-0P10-EE60-Umod-el 73180, serial number 62249, Yoshida-Cephlo. expure, manufacturing/inclusion year 1992; Since one of the criteria to estimate values dur-ing the individualization of each case consists of the evaluation of the growth pattern and that this pat-tern (dolichocephalic, mesocephalic and brachyce-phalic) exerts a greater influence on growth than the anterior-posterior relation (Class I and Class II), the sample was divided, according to the craniofacial growth in three groups:
» Horizontal group (H): 11 female and 3 male.
» Balanced group (E): 11 female and 14 male.
» Vertical group (V): 32 female and 19 male.
Figure 1 - Average behavior for ANB at the beginning (b) and at the end (e) of treatment, mediated by the proposed value (p).
Figure 3 - Average behavior of PNB at the beginning (b), at the end (e) of treatment, mediated by the proposal (p).
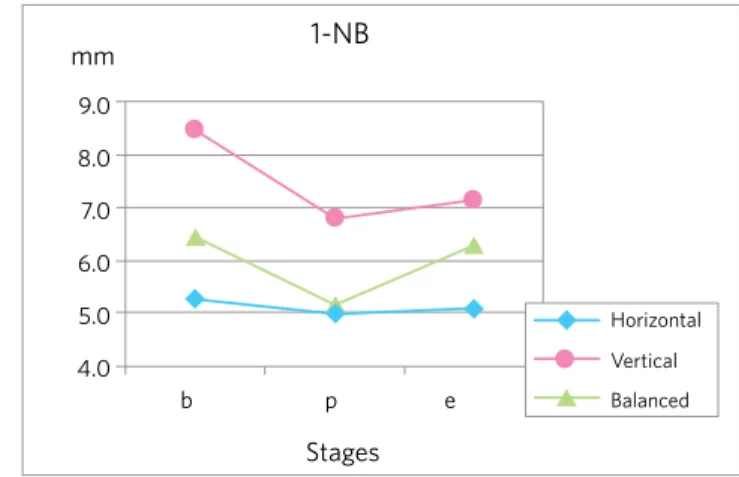
Figure 2 - Average behavior for 1-NB at the beginning (b) the end (e) treat-ment, mediated by the proposed value (p).
Figure 4 - Average behavior 1-NA at the beginning (b) and at the end (e) of treatment, mediated by the proposal (p).
mm
mm mm
mm
ANB
PNB 1-NA
1-NB
5.0
4.0 8.0
9.0 8.0 7.0
6.0 5.0 4.0 4.0
3.0
3.0 2.0
2.0
4.0 5.0 6.0 7.0 1.0
1.0 3.0
b p e
Stages
b p e
Stages
Horizontal
Vertical
Balanced
Horizontal
Vertical
Balanced
Horizontal
Vertical
Balanced
Horizontal
Vertical
Balanced
b p e
Stages
b p e
greater variation only in the horizontal group, diferent
from the results found by Ortiz et al18 whose inal values
were similar to the proposed estimates.
The horizontal group had the proposed value for the ANB angle higher than the inal value from all the groups. This probably occurred due to the greater po-tential for mandibular growth, contributing to the re-duction of this angle.
Results obtained by this research for the ANB angle
corroborates with the indings of Farret7 and Ortiz et
al,18 who utilized a similar methodology and obtained
values that were very close to the proposed at the end of the treatment.
When comparing the three groups studied in rela-tion to gender interference in the resulting values, re-sults from the analysis of variance (ANOVA) showed no diferences between them. This shows that the main efect, observed only in the horizontal group, is distrib-uted equally between the male and female genders.
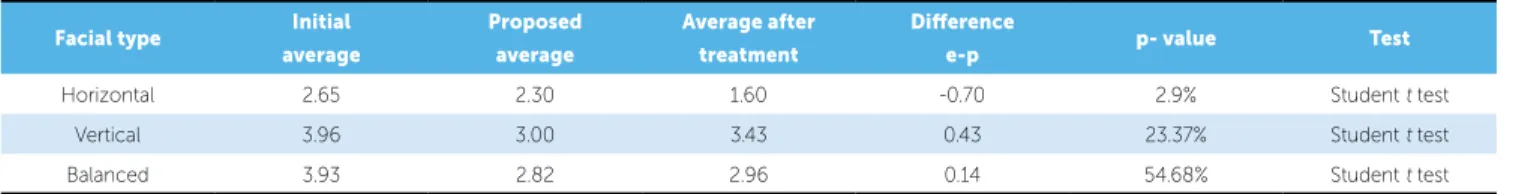
By comparing ANB angle averages at the initial and final phases with the proposed phase, we verify, through the paired t test, that there was a significant statistical difference between the proposed and the final stages of treatment (Table 1).
Rate of accuracy was reduced in the three groups, showing greater tendency to underestimate the re-duction of the ANB angle, mainly in the horizontal group, which has greater growth potential (Table 2). Meanwhile, in the differences averages between the final and the proposed phases, the numeric values were clinically low.
From these results, it is possible to ind the deicien-cy in the individualization of the estimates, mainly for the horizontal group, which leads to the need to avoid the underestimation of the mandibular growth potential with this age group and with both sexes. Based on these results, one can state that the ANB estimates have limi-tations and should not be taken as rigid parameters for the inishing of orthodontic treatment.
Predictability of the 1-NB measurement
The Holdaway principle, where the distances P-NB and 1-NB must be equal or vary within a 2 mm limit,
was introduced by Steiner26 in his analysis in 1959. This
proportion was analyzed with young Brazilians, with normal occlusion and its use during diagnosis and
treat-ment plan developtreat-ments is indicated in literature.7
The craniofacial growth pattern was established us-ing SN.GoGn cephalometric measurements. Despite the existing controversy in the literature related to the reliability of the Sela-Nasio line, we opted for this mea-surement, mainly because it was advocated by
Stein-er25,26,27,28 in his cephalometric analysis proposition.
The Craniofacial Growth Atlas, published by
Mar-tins et al15 was used to divide the groups, since it ofers
the average values and their respective standard deviations from the selected measurement, and it was elaborated on a sample of Brazilians of Mediterranean descent. Since the corrective orthodontic treatment begins at around 12 years of age, the values for SN.GoGn were checked at that age, obtaining the measurements of 33.20 for the female genre and 34.30 for the male genre, and the limits for the balanced group of 28.20 to 38.20 for females and 30.30 to 38.60 for males. The horizontal group was clas-siied from values below the inferior limits, and the verti-cal, above the superior limits.
Cephalometric growths were evaluated in the ini-tial, proposed and inal phases of the treatment. We also veriied the diferences between the inal and the pro-posed phases to observe the behavior of the estimates, checking how higher or lower they were compared to the obtained values.
RESULTS AND DISCUSSION
Since Steiner’s analysis is used all over the world and is considered an important tool for teaching and for the systemization of diagnosis and the elaboration of treat-ment plans, we tried, with this research, to establish a critical view of the way in which the analysis is being employed, as well as possible adjustments that the results of the research might suggest.
Predictability of the ANB angle
By observing the behavior of the initial and inal ANB angle, we realized that it became smaller with age, more signiicantly in the horizontal group, and not in the vertical and balanced groups, whose inal value was higher than the proposed value, which corroborates
with the indings of Bishara,3 Coura et al,5 Silva et al24
and the Craniofacial Growth Atlas.15
Facial type Initial average
Proposed average
Average after treatment
Diference
e-p p- value Test
Horizontal 2.65 2.30 1.60 -0.70 2.9% Student t test
Vertical 3.96 3.00 3.43 0.43 23.37% Student t test
Balanced 3.93 2.82 2.96 0.14 54.68% Student t test
Table 1 - Test result for the comparison between proposed values (p) and the values at the end of treatment (e) for the ANB angle.
Table 2 - Number and rate of accuracy (=) of the proposed value, of a larger inal value (>), or smaller (<) than the estimates of the ANB measurement (e-p).
Groups Accuracy Larger Smaller Total
= > <
Horizontal 6 (24%) 7 (28%) 12 (48%) 25
Balanced 9 (17%) 22 (43%) 20 (39%) 51
Vertical 3 (22%) 7 (50%) 4 (28%) 14
Table 3 - Comparison between proposed values (p) and the values at the end of treatment (e) for 1-NB.
Facial type Initial
average
Proposed average
Average after treatment
Diference
e-p p-value Test
Horizontal 5.26 4.96 5.10 0.14 68.22% Student t test
Vertical 8.46 6.79 7.11 0.32 85.55% Wilcoxon
Balanced 6.41 5.14 6.27 1.13 0.01% Wilcoxon
Table 4 - Number and rate of accuracy (=) for the proposed value, for a larger inal value (>), or smaller (<) than the estimates of the 1-NB measurement (e-p).
Groups Accuracy Larger Smaller Total
= > <
Balanced 6 (24%) 9 (36%) 10 (40%) 25
Balanced 9 (17%) 34 (66%) 8 (15%) 51
Vertical 3 (22%) 7 (50%) 4 (28%) 14
Silva and Martins24 conducted a study with
young Caucasian Brazilians with normal occlusion, demonstrating that the 1-NB measurement for this population is larger than the ideal values advocated by Steiner.25,26,27,28
In relation to the 1-NB measurement (Fig 2), re-sults from this study shows that in the balanced and mainly in the horizontal group, a retrusion of the low-er incisors is proposed, while in the horizontal group it was estimated that the lower incisors practically did not suffer any changes in relation to their angles of protrusion. At the end of the treatment, we observed retrusion in all groups, however, the proposed values during the elaboration of Steiner’s analysis for the bal-anced and vertical groups were not reached. A similar
behavior was observed by Farret,7 who also verified
a tendency to underestimate the values of the 1-NB measurement (averages obtained for 1-NB proposed 3.62 mm and final 4.98 mm), concluding that the use
of Steiner’s analysis must be carried out with great caution and criteria for Brazilians with Class I occlu-sions, since the acceptable compromises underesti-mate the average position of the incisors.
Ramos et al,22 and Hasund11 emphasize the
im-portance of taking into consideration the fact that the 1-NB measurement is larger in the cases where the growth pattern is divergent and smaller than a con-vergent growth pattern, during the elaboration of Steiner’s analysis.
In the current evaluation, we verify a signiicant statis-tical diference between the proposed values and the ones obtained at the end of the treatment for the vertical and balanced groups (Table 3). We observed that these values
were underestimated, just as in the studies of Farret7 and
Pinzan et al,20 since the estimated P-NB for both groups
did not present a signiicant diference in relation to the obtained value, and the value of 1-NB appeared higher
By evaluating the behavior of the 1-NB estimates considering the growth pattern and/or gender, we veri-ied, in the balanced group, the same behavior for both genders. For the horizontal and vertical groups, we veri-ied that, at the end of the orthodontic treatment, hori-zontal individuals of the female gender presented 1-NB larger than the proposed, horizontal individuals of the male gender presented 1-NB smaller than the proposed, vertical individuals of the female gender presented 1-NB smaller than proposed, and, inally, vertical indi-viduals of the male gender presented 1-NB larger than the proposed. Thus, we have an inverted behavior be-tween men and women, according to their facial type.
Gender inluence was also found by Pinzan,20 but only
in the vertical group.
The rate of accuracy was low for all facial types, where the margin of error for high values was higher in the balanced group, lower for the horizontal group and also higher for the vertical group (Table 4).
Since Steiner’s acceptable compromise table under-estimates the positioning of the lower incisors for young Caucasian Brazilians, we emphasize the need to indi-vidualize the values for this population.
Predictability of the P-NB measurement
The P-NB measurement was considered indispensable
by Steiner26 in his analysis, however, he did not speciied
the factors that subsidized his calculations, emphasizing the role represented by the clinical experience, pattern, growth potential and gender of the patient.
Holdaway’s 1:1 proportion, with a tolerance limit of 3 mm, was veriied in young Brazilians with normal oc-clusion, and, therefore, its use during the diagnostic and
treatment plan elaborations is indicated in literature.7,17
By analyzing the P-NB measurement in all its stages, we veriied, through Figure 3, that there was no dif-ference between the proposed and the end values in all
studied groups, which was also veriied by Ramos et al.2
However, they emphasize that the occurrence of indi-vidual variations in this region might have masked the P-NB’s tendency to be smaller in the vertical group.
Bishara et al2,3 described higher values for the P-NB
in horizontal patients and lower in vertical ones, which
is explained by Bishara,2 and inluenced by jaw rotation.
Pinzan et al19 found diferences in their study for the
proposed values in relation to the end-of-treatment val-ues in the horizontal and balanced groups, whilst in the vertical group this diference was not noted. By com-paring the averages of the P-NB in the initial and inal stages with the proposed stage, we veriied, through the paired “t” test, that there was no statistically signii-cant diference between the proposed and inal stages of treatment, determining a correct growth estimate in the
anterior region of the chin8 (Table 5). We observed no
Table 5 - Comparison between the proposed values (p) and the values at the end of treatment (e) for P-NB.
Facial type Initial
average
Proposed average
Average after treatment
Diference
e-p p-value Test
Horizontal 2.3 3.44 3.48 0.04 85.33% Student t test
Vertical 1.10 2.11 2.18 0.07 82.10% Student t test
Balanced 1.85 2.97 3.07 0.10 56.22% Signs of posts
Table 6 - Number and accuracy rate (=) of the proposed value, of a larger inal value (>) or smaller (<) than the estimates of the P-NB measurement e-p).
Groups
Accuracy Larger Smaller
Total
= > <
Horizontal 3 (12%) 10 (40%) 12 (48%) 25
Balanced 8 (15%) 19 (37%) 24 (47%) 51
diference between gender, since both presented mea-surements statistically similar to those proposed by the
analyses of Steiner25,26,27 and Pinzan.20 The equivalence
observed in this study is due, possibly, to the underes-timation in the horizontals and the overesunderes-timation in the verticals, i.e., they have not sufered the inluence of
Steiner’s25,26,27 maxim “the more it has, the more it will
have and vice versa” (Table 6)
Predictability of the 1-NA measurement
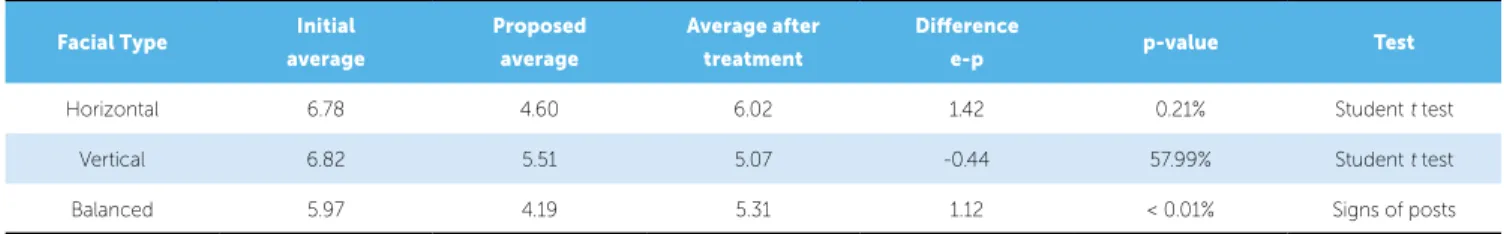
The value of the 1-NA measurement was under-estimated at the time of the Steiner’s individualization analysis on all three groups. As one can see in Table 7, the accuracy rate of the estimates was reduced. Values tend to overestimate the protrusion of the upper incisor in the horizontal and vertical groups, a result that agrees
with those obtained by Silva24 and the Craniofacial
Growth Atlas,15 conirming what would be a
character-istic and/or preference of Brazilians for more protruding incisors. These results are also found in the limits of the
average values found by Harris et al.10
The values obtained at the end of the treatment dif-fer from the estimates in the horizontal and balanced groups, diferently from the vertical group, where the
values are closer to those projected by Steiner.25 This
re-sult was also found in the work conducted by Farret7 in
his Class I sample, where values were very similar for all
Table 7 - Number and accuracy rate (=) of the proposed value, of a inal larger value (>) or smaller (<) than the estimates of the 1-NA measurement (e-p).
Groups Accuracy Larger Smaller Total
= > <
Horizontal 1 (4%) 17 (68%) 7 (28%) 25
Balanced 10 (19%) 10 (19%) 31 (60%) 51
Vertical 2 (14%) 6 (42%) 6 (42%) 14
Table 8 - Test result for the comparison between the proposed values (p) and the values at the end of the treatment (e) for 1-NA angle.
Facial Type Initial
average
Proposed average
Average after treatment
Diference
e-p p-value Test
Horizontal 6.78 4.60 6.02 1.42 0.21% Student t test
Vertical 6.82 5.51 5.07 -0.44 57.99% Student t test
Balanced 5.97 4.19 5.31 1.12 < 0.01% Signs of posts
groups (Fig 4). The average values for 1-NA, at the end of the treatment difer from the “ideal” value advocated
by Steiner25 in all facial types, difering also from the
cor-responding acceptable compromise for the ANB angle of 40, which would correspond to the 1-NA measurement equal to 2 mm since, in the present study, this measure-ment has the approximate value of 5 to 6 mm. In the
study carried out by Kowalski,13,14 they presented 1-NA
equal to the value advocated by Steiner25 (Table 8), even
1. Anderson AA, Anderson AC, Hornbuckle AC, Hornbuckle K. Biological derivation or a range of cephalometric norms for children of African American descent (after Steiner). Am J Orthod Dentofacial Orthop. 2000;118(1):90-100.
2. Bishara SE. Facial and dental changes in adolescents and their clinical implications. Angle Orthod. 2000;70(6):471-83.
3. Bishara SE, Fahl JA, Peterson LC. Longitudinal changes in the ANB angle and Wits appraisal: clinical implications. Am J Orthod. 1983;84(2):133-9.
4. Broadbent BH. A new X-ray technique and its application to orthodontia.
Angle Orthod. 1931;1(2):45-66.
5. Coura LC, Pinzan A, Freitas RM. Estudos cefalométrico longitudinal do
complexo mandibular em pacientes adultos do sexo masculino tratados ortodonticamente com extração de quatro pré-molares. Ortodontia. 1997;30(1):19-30.
6. Downs WB. Variations in facial relationships: their signiicance in treatment and prognosis. Am J Orthod. 1948;34(10):812-40.
7. Farret MMB, Araújo MCM. Comportamento da análise de Steiner em
casos tratados ortodonticamente. Ortodontia. 1981;14(3):164-72.
8. Fêo PS. Aumento da distância Pog-NB na adolescência. Estomatol Cult.
1970;4(1):5-14.
9. Gleis R, Brezniak N, Lieberman M. Israeli cephalometric standards
compared to Downs and Steiner analyses. Angle Orthod. 1990; 60(1):35-40.
10. Harris JE, Kowalski CJ, Walker GF. Discrimination between normal and class II individual using Steiner’s analysis. Angle Orthod. 1972;42(3):212-20. 11. Hasund A, Ulstein G. The position of the incisors in relation to the lines NA
and NB in diferent facial types. Am J Orthod. 1970;57(1):1-14.
12. Hofrath H. Problems of standard and methods. In: Krogman WM, Sassouni V. A syllabus in roentgenographic cephalometry. 2nd ed. Philadelphia: College Ofsets; 1957. cap. 1, p. 9-25.
13. Kowalski CJ, Walker GF. The use of incisal angles in the Steiner cephalometric analysis. Angle Orthod. 1972;42(2):87-95.
14. Kowalski CJ, Nasjleti CE, Walker GF. Diferential diagnosis of adult male black and white populations. Angle Orthod. 1974;44(4):346-50. 15. Martins DR. Atlas de crescimento craniofacial. São Paulo: Ed. Santos; 1998. 16. Miura F, Inove N, Suzuki K. Cephalometric standards for Japanese
according to the Steiner analysis. Am J Orthod. 1965;51:288-95.
REFERENCES
17. Oliveira JN, Martins DR. Estudo longitudinal e comparativo da variação do pogônio com os incisivos inferiores, em relação à linha NB, em adolescentes brasileiros, leucodermas, de 12 aos 18 anos de idade, com “oclusão normal”. Ortodontia. 1978;11(2):99-107.
18. Ortiz MF, Pinzan A, Pinzan C, Martins DR. Previsibilidade das medidas ANB e 1-Na da análise cefalométrica de Steiner. Rev Dental Press Ortod Ortop Facial. 2005;10(1):79-87.
19. Pinzan A. Estudo comparativo da medida P-NB, em adolescentes leucodermas, brasileiras, de origem mediterrânea,com normal e más oclusões (Classe I e Classe II, divisão 1), tratadas ortodonticamente. Ortodontia. 1987;20(1-2):47-51.
20. Pinzan CRM, Pinzan A, Freitas MR, Henriques JFC, Almeida MR. Estudo da previsibilidade das medidas P-NB e 1-NB na elaboração da análise cefalométrica de Steiner. Rev Dental Press Ortod Ortop Facial. 2004;9(2):23-34.
21. Platou C, Zachrisson B. Incisor position in Scandinavian children with ideal occlusion: a comparison with the Ricketts and Steiner standards. Am J Orthod. 1983;83(4):341-51.
22. Ramos AL, Almeida RR, Pinzan A, Freitas MR. Inluência da divergência facial no posicionamento dentário e das bases apicais, em jovens brasileiros com oclusão normal. Ortodontia. 1996;29(3):44-54.
23. Servoss JM. The acceptability of Steiner’s acceptable compromises. Am J Orthod. 1960;46(11):834-47.
24. Silva LG, Martins DR. Determinação dos valores cefalométricos 1.NA, 1.NB, 1-NA, 1-NB para adolescentes brasileiros, leucodermas, com “oclusão normal” (estudo longitudinal e comparativo). Ortodontia. 1978;11:108-16.
25. Steiner CC. Cephalometrics for you and me. Am J Orthod. 1953;39(10):729-55.
26. Steiner CC. Cephalometrics clinical practice. Angle Orthod. 1959;29(1):8-29. 27. Steiner CC. The use os cephalometrics as an aid to planning and
assessing orthodontic treatment. Am J Orthod. 1960;46(10):721-35. 28. Steiner CC. Cephalometrics as a clinical tool. In: Kraus BS, Riedel RA.
Vistas in Orthodontics. Philadelphia: Lea & Fegiber; 1962. p. 131-61. 29. Uesato G, Kinoshita Z, Kawamoto T, Koyama I, Nakanishi Y. Steiner cephalometric norms for Japanese and Japanese-Americans. Am J Orthod. 1978;73(3):321-7.
CONCLUSION
Based on the results obtained and discussed, we were able to conclude that:
» There was no influence of gender on the behav-ior of measurements ANB, 1-NB, P-NB and 1-NA.
» The propositions made after Steiner’s analysis elaboration differed significantly from the re-sults obtained with the orthodontic treatment, with the exception of the variable P-NB. » The proposed values for ANB were statistically
diferent from the values obtained at the end of the treatment, with the exception of the balanced group, considering that the proposed value for
the horizontal group was underestimated in rela-tion to the other groups.
» In relation to the 1-NB measurement, the pro-posed values during Steiner’s analysis elabora-tion for the balanced and vertical groups were not reached.
» For the 1-NA measurement, the obtained val-ues at the end of treatment differ from the esti-mates on all three analyzed groups. In the verti-cal group the final value was the one that came closer to the proposed one.