The association between nutritional
status and cognitive impairment in
Brazilian community-dwelling older adults
assessed using a range of anthropometric
measures – the Bambui Study
Érico Castro-Costa1, Sérgio V. Peixoto1,2, Josélia O.A. Firmo1, Elizabeth Uchoa1, Maria Fernanda F. Lima-Costa1
ABSTRACT. In most studies, body mass index (BMI) has been used as the main measurement of nutritional status. However, BMI does not differentiate between body fat and muscle mass. Objective: To investigate the association between nutritional status and cognitive impairment in a population of Brazilian elderly. Methods: Participants (n=1,496) from the Bambuí Cohort Study of Aging were selected based on the results for the two variables nutritional status and cognitive impairment (MMSE score). Gender, age, education, lifestyle, ApoE, chronic diseases, depressive symptoms, current use of hypnotic or sedative medication and functional disability were used as confounding factors for adjusting the logistic regression.
Results: Cognitive impairment was associated with lower BMI (OR: 0.91; CI: 0.86-0.95), waist circumference (OR: 0.97; CI: 0.95-0.99), triceps skinfold thickness (OR: 0.92; CI: 0.89-0.96) among the younger participants (60-69 years), while lower arm muscle circumference (OR: 0.88; CI: 0.80-0.98) and corrected arm muscle area (OR: 0.96; CI: 0.93-0.99) were associated with cognitive impairment among the older participants (70 years and over). Conclusion: There was a difference of association between anthropometric measures and cognitive impairment after stratifying by age group. In the group aged between 60 and 69, cognitive impairment was associated with measures related to fat mass, while in the group aged over 70, cognitive impairment was associated with measures related to muscle mass. This finding suggests that investigation of nutritional status in the elderly using anthropometric measures should not be restricted only to the use of BMI, and should also, differ according to age.
Key words: nutritional status, cognitive impairment, anthropometric measures, elderly, population-based.
ASSOCIAÇÃO ENTRE O ESTADO NUTRICIONAL AVALIADO POR VÁRIAS MEDIDAS ANTROPOMÉTRICAS E O COMPROMETIMENTO COGNITIVO EM IDOSOS BRASILEIROS VIVENDO EM COMUNIDADE – PROJETO BAMBUÍ
RESUMO. Na maioria dos estudos o índice de massa corporal (IMC) é usado como a principal medida de avaliação do estudo nutricional. Entretanto, o IMC não apresenta capacidade de diferenciar a gordura corporal da massa muscular.
Objetivo: Investigar a associação do estado nutricional e o comprometimento cognitivo na população idosa de Bambuí.
Métodos: Participaram do estudo 1496 idosos que responderam simultaneamente as variáveis do estado nutricional e o comprometimento cognitivo (avaliado através do escore do MMSE). As seguintes variáveis: sexo, idade, educação, estilo de vida, ApoE, doenças crônicas, sintomas depressivos, uso de medicamentos hipnóticos e sedativos e incapacidade funcional foram utilizadas como fatores de confusão na regressão logística multivariada. Resultados: O comprometimento cognitivo foi associado com os baixos valores de: IMC (OR: 0.91; CI: 0.86-0.95), circunferência da cintura (OR: 0.97; CI: 0.95-0.99), dobra cutânea triciptal (OR: 0.92; CI: 0.89-0.96) entre os idosos mais jovens (60-69 anos). Enquanto que baixos valores da circunferência (OR: 0.88; CI: 0.80-0.98) e da area muscular do braço corrigida (OR: 0.96; CI: 0.93-0.99) foram associados com o comprometimento cognitivo entre os idosos mais velhos (70 anos ou mais). Conclusão: Existe uma diferença entre a
1Núcleo de Estudos em Saúde Publica e Envelhecimento, Fundação Oswaldo Cruz/Universidade Federal de Minas Gerais, Belo Horizonte MG, Brazil. 2Escola de
Enfermagem, Universidade Federal de Minas Gerais, Belo Horizonte MG, Brazil.
Érico Castro-Costa. Núcleo de Estudos em Saúde Pública e Envelhecimento / Fundação Oswaldo Cruz / Universidade Federal de Minas Gerais – Av. Augusto de Lima, 1715 / 6o andar – 30130-002 Belo Horizonte MG – Brazil. E-mail: [email protected]
Disclosure: The authors report no conflicts of interest.
associação das medidas antropométricas e o comprometimento cognitivo após a estratificação por idade. Nos participantes entre 60 a 69 anos, o comprometimento cognitivo foi associado a medidas relacionadas com o tecido adiposo enquanto que no grupo com 70 anos ou mais, o comprometimento cognitivo foi associado a medidas relacionadas com a massa muscular. Esses achados sugerem que a investigação do estado nutricional dos idosos não se deve restringir somente ao IMC, sendo necessário variações devido a idade.
Palavras-chave: estado nutricional, comprometimento cognitivo, medidas antropométricas, idosos, base-populacional.
ment and reduced muscle mass in women without de-mentia.15 hese indings suggested that lean mass may
be a more sensitive measure to relate body composition to cognitive outcomes and to dementia than measures of adiposity.
Although there are other anthropometric measures that may be more reliable and easier to perform, they have only been used in a few studies.16,17 Taking into
ac-count the changes in body composition during aging and the limitations of BMI for assessing levels of nutritional status in the elderly, the aim of this study was to inves-tigate the association between nutritional status and cognitive impairment, supplementing data on BMI with other anthropometric measures in a well-deined popu-lation of Brazilian elderly with low-educational levels.
METHODS
The Bambuí Health and Ageing Study (BHAS). he BHAS is an ongoing population-based prospective cohort study of older adults carried out in Bambuí (15,000 inhabitants), a city in the State of Minas Gerais, Southeast Brazil. he data presented in this paper were collected at the baseline examination. A detailed description of the design and methods of the study has been published previously.18,19
Study population. All residents aged 60 years and over were eligible to take part in the BHAS baseline and were iden-tiied through a complete census of the city, carried out by the research team between November and December 1996. Of 1,742 residents identiied who were aged 60 years and over, 1,606 (92.2%) were interviewed and received comprehensive health status examinations. hose interviewed and examined were similar to the to-tal population in Bambuí aged 60 years and over with respect to all sociodemographic characteristics consid-ered, including age, gender, number of residents in the household, marital status and educational level.18,19
Measures. Cognition assessment – he BCSA includes a
standard Brazilian version of the MMSE,20 which was
completed annually. In the Brazilian validation study, some questions were modiied according to their rel-evance to the target population. In the orientation
INTRODUCTION
M
alnutrition is a common problem among olderadults,1 leading to severe complications such as
weakening of the immune system, muscle loss, loss of independence and increased mortality.2 In addition,
malnutrition in the elderly is associated with several geriatric syndromes including cognitive deicit,3,4 which
represents one of the most disabling health conditions in the elderly.5
Recent studies have conirmed a higher prevalence of malnutrition in older adults with diferent types of cognitive impairment (dementia, mild cognitive impair-ment).5-7 However, in most of these studies body mass
index (BMI) was used as the main measurement of nu-tritional status. It is well known that BMI can be mis-leading in terms of a person’s body fat percentage as the index solely takes account of net weight and height of an individual and does not consider the distribution of muscle and bone mass. It also fails to diferentiate be-tween body fat and muscle mass.8
In older people, there tends to be an increase in body weight and fat tissue and a decrease in muscle mass. herefore, the use of BMI as a nutritional measurement may underestimate the body fat percentage in those with less lean body mass, such as elderly individuals. In order to overcome this limitation, the Nutrition Screen-ing Initiative (NSI)9 and Lipschitz10 proposed a diferent
BMI cut-of as suggested by the World Health Organi-zation.11 However, there is no universal agreement on
which BMI cut-of point should be used and how to de-ine malnutrition using BMI values.12 Also, Guo et al.,
199913 hold that BMI is not appropriate for assessing
levels of nutritional status in the elderly because it does not provide information about distribution of fat in dif-ferent parts of the body.
In addition, recent evidence has indicated that alter-ations in body composition are apparent in the earliest clinical stage of Alzheimer’s disease and have furthered these indings in suggesting that Alzheimer’s disease-re-lated alterations in body composition may be predomi-nantly due to loss of lean mass (i.e. sarcopenia).14 his is
impair-section by Folstein et al.,21 questions about the season
of the year, building and loor were replaced by pe-riod of the day, room and address in the Brazilian ver-sion. In the registration and recall section, the words used were “cat”, “tree” and “guitar”. In the attention and calculation section, serial ives replaced serial sev-ens and “Maria,” which is more commonly used in the Brazilian culture, replaced spelling “world” backwards. Despite potential questions that could be raised con-cerning the cross-cultural equivalence of the MMSE, a previous study in this population provided some sup-port for this equivalence, suggesting that most of the items and underlying constructs remain meaningful, even after modiication and translation, in a low-edu-cation population with a lower overall distribution of scores.22 In the absence of comparable cut-of points,
percentile distribution of MMSE scores is more appro-priate for population-based studies of the elderly with low schooling level. In this study, cognitive impairment was deined using the cut-of point of 21/22, which corresponded to the lower quartile of the MMSE score distribution.23
Nutritional assessment – Various methods were used for assessing nutrition. In the BHAS, traditional an-thropometric measures were used to assess nutritional status because they were easy to perform and frequent-ly applied in epidemiological studies.4,16 For the
pres-ent study, anthropometric measures were divided into principal measures (weight, height, waist circumference – WC, triceps skinfold thickness -TST, mid-arm circum-ference - MAC) and derived measures (body mass index – BMI, arm muscle circumference – AMC and corrected arm muscle area – CAMA).
All principal anthropometric measurements were taken three times by a trained team; the mean was con-sidered for the purposes of analysis. Waist circumference (WC) was measured with a tape measure placed midway between the lower rib margin (costal margin) and the superior anterior iliac spine (iliac crest) to the nearest 0.5 cm, in a standing position. Triceps skinfold thick-ness (TST) was taken with the person standing upright with their arms hanging down loosely. he skin fold was pulled away from the muscle and measured with cali-pers, taking a reading 4 seconds after the calipers had been released. he point of measurement was half way between the olecranon process of the ulna and the ac-romion process of the scapula. Mid-arm circumference was the circumference of the left upper arm, measured at the mid-point between the tip of the shoulder and the tip of the elbow (olecranon process and the acromion).
Regarding derived measures, weight and height measurements were used to calculate BMI (weight/ height2). he arm muscle circumference (AMC) is
de-rived from the mid-arm circumference (MAC) and the triceps skinfold thickness (TSF) calculated by account-ing for the thickness of the subcutaneous fat that sur-rounds the muscle, using the following formula, with the mid-arm circumference (MAC) and triceps skinfold thickness (TSF) values.24
AMC (cm)=[MAC (cm)- (p x TSF (cm))]
he corrected arm muscle area (CAMA) is derived from the arm muscle circumference (AMC) using the following two formulae, with the MAC and TSF values in the equation developed by Heymsield et al., 1982.25
For men
CAMA (cm2)= [MAC (cm) – (p x TSF (cm))]2 – 10
4p
For women
CAMA (cm2)= [MAC (cm) – (p x TSF (cm))]2 – 6.5
4p
Covariates. Information on gender, age and schooling lev-el (number of complete years of schooling) was obtained in the baseline BHAS interview. Participants were asked about the following lifestyle characteristics: current smoking and alcohol consumption. Current smokers were deined as those who had smoked at least 100 ciga-rettes during their lifetime and were still smoking. Al-cohol consumption was deined as any consumption of alcohol in the last 12 months. Genomic DNA for ApoE genotyping was extracted from blood samples using the Wizard® Genomic DNA Puriication System (Promega, Madison, WI, USA). Consistent with the seventh Joint National Committee criteria, hypertension was deined as systolic blood pressure greater than or equal to 140 mmHg, and/or diastolic blood pressure greater than or equal to 90 mmHg and/or the use of antihyperten-sive drugs.26 Diabetes mellitus was deined as fasting
blood glucose greater than or equal to 126 mg/dl and/ or current treatment for diabetes, following the 2003 American Diabetes Association updated criteria.27 he
presence of depressive symptoms was deined as a score of over 4 on the 12-item General Health Questionnaire (GHQ-12).28 he GHQ-12 was originally developed for
this elderly sample.28 Information about the use of
hyp-notic or sedative medication was collected using the sleep questionnaire previously described.29 Current use
of hypnotic or sedative medication was deined as any number of pills taken in the last month. Functional dis-ability was deined as the indis-ability to perform at least one of ive activities of daily living: dressing, eating, walking around inside the house, bathing and maintain-ing urinary continence.30
he interviews were carried out by community mem-bers with at least 11 years of schooling selected by the research team. he interviewers were trained by a psy-chiatrist with extensive experience in diferent coun-tries and cultures.18,19 Nutritional assessment was also
performed by community members carefully trained by a nutritionist. he BHAS was approved by the Research Ethics Committee of the Oswaldo Cruz Foundation.
Statistical analysis. Unadjusted associations of cognitive impairment with sociodemographic factors, apoeE al-lele 4, lifestyle characteristics, current use of psycho-active medication and anthropometric measures were evaluated using Pearson c2 tests for linear trend or
Stu-dent t-tests. Categorical variables were: gender, school-ing level, ApoE allele 4, smokschool-ing, alcohol consumption, hypertension, diabetes, depression symptoms, use of psychoactive medication, and functional disability. Age and all anthropometric measures were treated as con-tinuous variables. In addition, the Student t-test was used to determine if there was a signiicant diference between the mean (SD) of all anthropometric measures from participants with or without cognitive impairment in the diferent age groups (60-69 years and 70 years and over). Finally, an adjusted logistic regression analy-sis was performed to conirm the association between malnutrition evaluated using diferent anthropometric measures and cognitive impairment. he STATA soft-ware Package (version 10.1, College Station, TX, USA) was used for all analyses.31
RESULTS
Of the 1,606 cohort members, those included in the present analysis were the 1,496 baseline participants for whom both cognitive and nutritional status were determined (110 were excluded for refusals to perform blood tests). Most subjects were women and the mean age of participants was 68.9 years. hirty-ive percent had more than 4 years of education. Compared against this same age group in the general population, the par-ticipants in this study had more years of schooling (df: 2; c2=23.9; p<0.001).
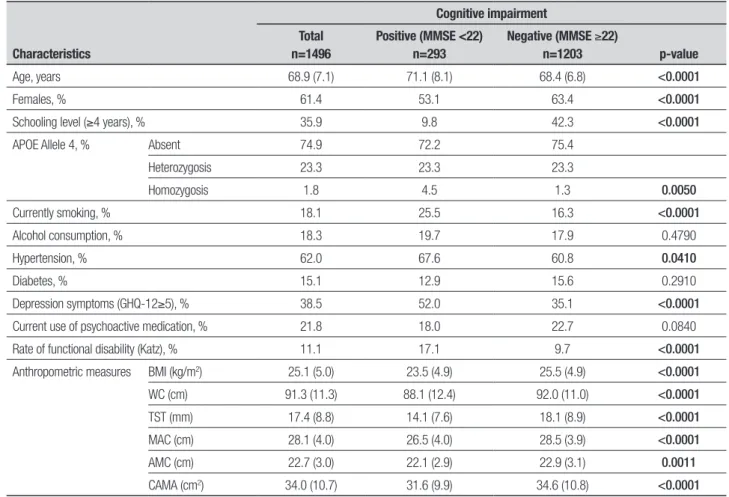
he prevalence of cognitive impairment was 19.6%, the overall mean (SD) of BMI was 25.1 (5.0), while 23.5 (4.9) was the mean (SD) among those with cognitive im-pairment. Means of others anthropometric parameters were also lower in participants with cognitive impair-ment than those without cognitive impairimpair-ment. Fur-ther characteristics of the study population including details of cognitive impairment are shown in Table 1.
Table 2 shows the anthropometric proile of partici-pants by age and cognitive impairment. All anthropo-metric parameter means were smaller in older partici-pants with cognitive impairment, while only means of BMI, waist circumference, triceps skinfold thickness and mid-arm circumference were smaller in younger participants with cognitive impairment.
Table 3 shows adjusted OR for many potential con-founders for the association between MMSE score and diferent anthropometric measures by age. Cognitive impairment was associated with lower BMI (OR: 0.91; CI: 0.86-0.95), waist circumference (OR: 0.97; CI: 0.95-0.99), TST (OR: 0.92; CI: 0.89-0.96) among the younger participants, while lower arm muscle circumference (OR: 0.88; CI: 0.80-0.98) and corrected arm muscle area (OR: 0.96; CI: 0.93-0.99) were associated with cognitive impairment among the older participants. Mid-arm cir-cumference was associated with cognitive impairment in both groups.
DISCUSSION
his paper describes, to the best of our knowledge, is the irst investigation in Brazil on the association be-tween nutritional status (using various anthropometric measures) and cognitive impairment in community-dwelling older adults, taking into account a range of potential confounding factors. In Bambuí, diferent anthropometric measures were associated with cogni-tive impairment in diferent age groups. BMI and waist circumference were associated with cognitive impair-ment in young elderly while arm muscle circumference and corrected arm muscle area were associated in older elderly – and these associations persisted after control-ling for sociodemographic status, ApoE, lifestyle, chron-ic diseases, depression, use of psychoactive drugs and functional disability.
Table 1. Characteristics of the study participants, by cognitive impairment.
Characteristics
Cognitive impairment Total
n=1496
Positive (MMSE <22) n=293
Negative (MMSE ≥22)
n=1203 p-value
Age, years 68.9 (7.1) 71.1 (8.1) 68.4 (6.8) <0.0001
Females, % 61.4 53.1 63.4 <0.0001
Schooling level (≥4 years), % 35.9 9.8 42.3 <0.0001
APOE Allele 4, % Absent 74.9 72.2 75.4
Heterozygosis 23.3 23.3 23.3
Homozygosis 1.8 4.5 1.3 0.0050
Currently smoking, % 18.1 25.5 16.3 <0.0001
Alcohol consumption, % 18.3 19.7 17.9 0.4790
Hypertension, % 62.0 67.6 60.8 0.0410
Diabetes, % 15.1 12.9 15.6 0.2910
Depression symptoms (GHQ-12≥5), % 38.5 52.0 35.1 <0.0001
Current use of psychoactive medication, % 21.8 18.0 22.7 0.0840
Rate of functional disability (Katz), % 11.1 17.1 9.7 <0.0001
Anthropometric measures BMI (kg/m2) 25.1 (5.0) 23.5 (4.9) 25.5 (4.9) <0.0001
WC (cm) 91.3 (11.3) 88.1 (12.4) 92.0 (11.0) <0.0001
TST (mm) 17.4 (8.8) 14.1 (7.6) 18.1 (8.9) <0.0001
MAC (cm) 28.1 (4.0) 26.5 (4.0) 28.5 (3.9) <0.0001
AMC (cm) 22.7 (3.0) 22.1 (2.9) 22.9 (3.1) 0.0011
CAMA (cm2) 34.0 (10.7) 31.6 (9.9) 34.6 (10.8) <0.0001
BMI: body mass index; WC: waist circumference; TST: triceps skinfold thickness; MAC: mid-arm circumference; AMC: arm muscle circumference; CAMA: corrected arm muscle area. Values for age, BMI, WC, TST, MAC, AMC, CAMA, are expressed as mean (SD). p-value: Student’s t-test, Person’s c2 test for differences between means and frequencies, respectively.
Table 2. Baseline characteristics according to age and cognitive impairment.
Variables
60-69 years 70 years or older
MMSE<22 MMSE ≥22 Total p-value MMSE<22 MMSE ≥22 Total p-value
Anthropometric profile
BMI (kg/m2) 23.6 (4.5) 25.9 (5.0) 25.6 (4.9) <0.0001 23.3 (5.3) 24.9 (4.7) 24.6 (4.9) 0.0013
WC (cm) 88.1 (12.4) 92.0 (11.0) 91.3 (11.3) <0.0001 87.9 (11.6) 91.9 (11.0) 91.3 (11.2) 0.0001
TST (mm) 14.0 (7.3) 19.0 (9.4) 18.2 (9.3) <0.0001 14.3 (8.1) 16.7 (7.7) 16.2 (7.8) 0.0019
MAC (cm) 27.3 (3.7) 29.1 (3.9) 28.8 (3.9) <0.0001 25.7 (4.2) 27.5 (3.9) 27.1 (4.0) <0.0001
AMC (cm) 22.8 (3.0) 23.2 (3.1) 23.1 (3.1) 0.2115 21.4 (2.7) 22.3 (2.9) 22.1 (2.8) 0.0014
CAMA (cm2) 33.8 (10.3) 35.8 (10.9) 35.4 (10.8) 0.0302 29.1 (8.9) 32.6 (10.4) 31.8 (10.2) 0.0004
BMI: body mass index; WC: waist circumference; triceps skinfold thickness; MAC: mid-arm circumference; AMC: arm muscle circumference; CAMA: corrected arm muscle area. Values for BMI, WC, TST, MAC, AMC, CAMA are expressed as mean (SD). p-value: student’s t-test for differences between medians.
psychoactive medication and functional disability. Also, the use of anthropometric measures as continuous vari-ables helps to avoid measurement inaccuracies, which can occur when using established cut-of points.32
he study does have some limitations. Firstly, due to the challenging logistics, we did not use other measures such as bioelectrical impedance spectroscopy. However,
although the use of these measures is desirable, their incorporation into community epidemiological studies poses substantial logistic challenges and the anthropo-metric measures remain the most widely used instru-ments in such studies.4 Secondly, on the basis of cost,
whole-body potassium which are accurate methods often cited in other studies,33 In addition to the question of cost,
these measurements require a high level of coopera-tion from the individual, which may be complicated to achieve in an older population with severe physical and cognitive impairments.34 Finally, populations with low
schooling levels tend to exhibit worse performance on the MMSE. However, several strategies have been pro-posed in order to minimize the efects of schooling level in the interpretation of MMSE score. In Brazil, the most common approach has been the use of diferent cut-of points according to schooling level,35 although some
evidence has failed to support this approach.36 To
over-come this inconsistency, we used a cut-of point based on the distribution of the MMSE scores in the study population.23
Recently, many studies have demonstrated the asso-ciation between nutritional status and cognitive impair-ment among hospitalized old people and those living in elderly care homes.7,37 However, studies investigating
the association between nutritional status and cogni-tive impairment in older community-dwelling popula-tions are scarce.1,4 Lee et al. (2009)1 investigated
nutri-tional status in a sample of 2934 non-institunutri-tionalized older individuals aged 60 years or older from an urban community of China and found an association between nutritional risk and cognitive impairment even after adjusting for demographics and depression. Also, Fag-erstrom et al. (2011),4 investigating data on nutritional
characteristics in 1,402 people aged 60 years and older who lived in regular or special housing in a municipal-ity in south-eastern Sweden, demonstrated that mal-nutrition was associated with cognitive impairment in both those living in special and regular housing, but was more pronounced in the former group. However, both these previous reports did not investigate the
associa-tion of other anthropometric measures with cognitive impairment.
In the study described here, nutritional status was assessed not only for BMI but also complemented with waist circumference, triceps skinfold thickness, mid-arm circumference, mid-arm muscle circumference and cor-rected arm muscle area. All anthropometric measures were associated with cognitive impairment, and had very similar odds ratios in separate models for the whole population. However, inal models stratiied according to age (from 60 to 69 years and 70 years and older), where each anthropometric measure was entered with all other covariates, indicated diferences in the asso-ciation of those variables and cognitive impairment. Measures related to fat mass (waist circumference and triceps skinfold thickness) were associated with cogni-tive impairment in younger old people, while measures related only to muscle mass (arm muscle circumference, corrected arm muscle area) were associated with older elderly. On the other hand, mid-arm circumference re-mained associated with cognitive impairment in both age groups.
hese indings might be explained by patterns of change in body composition over time in older adults, where the percentage of fat mass increases initially, then decreases38 and by skeletal muscle mass decline,
especially in adults older than 70 years.39 On the other
hand, our results with BMI and mid-arm circumference may have been attributed to the estimation of these measures. BMI includes height, which in elderly per-sons decreases with age, and thus introduces inaccuracy and an overestimation of the body fat measure, whereas mid-arm circumference relects muscle mass as well as fat mass.
In conclusion, the present study shows that there is a relationship between nutritional status measured by Table 3. Results of analyses of association between cognitive impairment, anthropometric and biochemistry profile by age.
Variables
OR (95% CI)*
60-69 years 70 years or over Total
Anthropometric profile BMI (kg/m2) 0.91 (0.86-0.95) 0.95 (0.90-1.01) 0.92 (0.89-0.96)
WC (cm) 0.97 (0.95-0.99) 0.98 (0.96-1.01) 0.97 (0.96-0.99)
TST (mm) 0.92 (0.89-0.96) 0.97 (0.94-1.01) 0.94 (0.92-0.97)
MAC (cm) 0.89 (0.84-0.95) 0.92 (0.86-0.98) 0.90 (0.86-0.94)
AMC (cm) 0.94 (0.87-1.02) 0.88 (0.80-0.98) 0.92 (0.87-0.98)
CAMA (cm2) 0.98 (0.96-1.00) 0.96 (0.93-0.99) 0.97 (0.96-0.99)
diferent anthropometric methods and cognitive im-pairment among elderly living in the community. he major inding in this population of older people from Bambuí was the diference of association between an-thropometric measures and cognitive impairment after stratifying by age group. his inding suggests that the investigation of nutritional status in the elderly using anthropometric measures should not be restricted only to the use of BMI and should also difer according to age. Further studies are necessary to better understand this
complex relationship between nutritional status and cognitive impairment.
Support. his work was supported by grants from the
Conselho Nacional de Desenvolvimento Cientíico e Tec-nológico (CNPq) and Financiadora de Estudos e Projetos
(FINEP). MF Lima-Costa and J OA Firmo are fellows of the Conselho Nacional de Desenvolvimento Cientíico e Tec-nológico (CNPq). E Castro-Costa is supported by the Pro-grama Nacional de Pós-doutorado em Saúde – PNDS.
REFERENCES
1. Lee KS, Cheong HK, Kim EA, Kim KR, OH BH, Hong CH. Nutrition-al risk and cognitive impairment in the elderly. Arch Gerontol Geriatr 2009;48:95-99.
2. White H, Pieper C, Schmader K. The asociation of weight change in Alzheimer’s disease with severity of disease and mortality:a longitudinal analysis. J Am Geriatr Soc 1998;46:1223-1227.
3. Saka B, Kaya O, Ozturk GB, Erten N, Karan MA. Malnutrition in the elderly and its relationship with other geriatric syndromes. Clin Nutr 2010;29:745-748.
4. Fagerstrom C, Palmqvist R, Johanna, Hellstrom Y. Malnutrition and cognitve impairment among people 60 years of age and above living in regular housing and in special housing in Sweden:a population-based cohort study. Int J Nurs Studies 2011;48:863-871.
5. World Health Organization. World Health Report 2003 – Shapping the future. WHO, Geneve, 2003.
6. Zekry D, Hermann FR, Grandjean R, et al. Demented versus non-de-mented very old inpatients:the same comorbidities but poorer function-al and nutritionfunction-al status. Age Ageing 2008;37:83-89.
7. Khater MS, Abouelezz NF. Nutritional status in older adults with mild cognitive impairment. J Nutr Health Aging 2011;15:104-108. 8. Beck AM, Ovesen L. At which body mass índex and degree of weight
loss should hospitalized eldelry patients be considered at nutritional risk? Clin Nutr 1998;17:195-198.
9. Nutrition Screening Initiative. Nutrition interventions manual for profes-sionals caring for older Americans. Washington DC:Nutrition Screening; 1994.
10. Lipschitz DA. Screening for nutritional status in the elderly. Prim Care 1994;21:55-67.
11. World Health Organization. Obesity:preventing and managing the global epidemic. Reporto f a WHO Consultation on Obesity. Geneva:World Health Organization;1998.
12. Poulsen I. 2005. Functional and Nutritional Assessment in Geriatric Re-habilitation. A Feasibility Study. Lund University. Lund
13. Guo SS, Zeller C, Chumlea WC, Siervogel RM. Aging body composi-tion and lifestyle:the Fels Longitudinal Study. Am J Clin Nutr 1999;70, 405-411.
14. Burns JM, Johnson DK, Watts A, et al. Reduced lean mass in early Alzheimer Disease and its association with brain atophy. Arch Neurol 2010;67:428-433
15. Nourhashemi F, Andrieu S, Gillette-Guyonnet S, et al. Is there a relation-ship between fat-free soft tissue mass and low cognitive function? Results from a study of 7,105 women. J Am Geriatr Soc 2002;50:1796-1801. 16. Frisancho AR. 1981. New norms of upper limb fat and muscle áreas for assessment of nutritional status. Am J Clin Nutr 1981;34:2540-2545. 17. Carlsson M, Gustafson Y, Eriksson S, Haglin L. Body composition in
Swedish old people aged 65-99 years, living in residential care facilities. Arch Gerontol Geriatr 2009;49:98-107.
18. Costa MFFL, Uchoa E, Guerra HL, Firmo JOA, Vidigal PG, Barreto SM. The Bambui Health and Ageing Study (BHAS):methodological approach and preliminary results of a population-based study of the elderly in Brazil. Rev Saúde Publica 2000;34:126-135.
19. Lima-Costa MF, Firmo JO, Uchoa E .Cohort profile:the Bambui (Brazil) Cohort Study of Ageing. Int J Epidemiol 2011;40:862-867.
20. Seabra MLV, Concilio G, Villares JB, et al. Avaliação do teste “Mini-mental state” em voluntários e pacientes brasileiros. Revista ABP-APL. 1990;12:1-29
21. Folstein MF, Folstein S, MCHugh PR. Mini-Mental State:a practical method for grading the cognitive state of patients for the clinician. J Psychiat Res 1975;12:189-198.
22. Castro-Costa E, Fuzikawa C, Ferri CP, et al. Dimensions underlying the Mini-Mental State Examination in a sample with low-education levels:the Bambui Health and Aging Study. Am J Geriatr Psychiatry. 2009;17:863-872.
23. Castro-Costa E, Fuzikawa C, Uchoa E, Firmo JOA, Lima-Costa MF. Norms for the Mini-Mental State Examination – Adjustment of the cut-off point in population-based studies (evidences of the Bambui health aging study). Arq Neuropsiquiatr 2008;66:524-528
24. Gurney JM, Jelliffe DB. Arm anthropometry in nutritional assessment: nomogram for rapid calculation of muscle circumference and cross-sectional muscle and fat áreas. Am J Clin Nutr 1973;26:912-915. 25. Heymsfield SB, McManus C, Smith J. Stevens V, Nixon DW.
Anthropo-metric measurement of muscle mass: Revised equations for calculating bone-free arm muscle area. Am J Clin Nutr 1982;36:680-690. 26. Chobanian AV, Bakris GL, Black HR, et al. The Seventh Report of the
Joint National Committee on Prevention, Detection, Evaluation, and Treatment of High Blood Pressure: the JNC 7 report. JAMA 2003;289: 2560-2572.
27. Genuth S, Alberti KG, Bennett P, et al. Follow-up report on the diagnosis of diabetes mellitus. Diabetes Care. 2003;26:3160-3167.
28. Costa E, Barreto SM, Uchoa E, Firmo JO, Lima-Costa MF. Prince M.Is the GDS-30 better than the GHQ-12 for screening depression in elderly people in the community? The Bambui Health Aging Study (BHAS). Int Psychogeriatr 2006;18:493-503.
29. Loyola-Filho Al, Uchoa E, Guerra HL, Firmo JO, Lima-Costa MF. Preva-lence and factors associated with self-medication:the Bambuí Health Survey. Rev Sauce Publica 2002;36:55-62.
30. Katz S, Ford AB, Moskowitz RW, Jackson BA, Jaffe MW. Studies of Illness in the Aged. The Index of Adl:A Standardized Measure of Biologi-cal and Psychosocial Function. JAMA 1963;185:914-919.
31. StataCorp, Stata Statistical Software, RCS. TX:StataCorp LP. 2005. 32. Vasconcelos FAG, Cordeiro BA, Rech CR, Petroski EL. Sensibilidade e
especificidade do indice de massa corporal no diagnóstico de sobrepe-so/obesidade em idosos. Cad Saude Publica, 2010;26:1519-1527. 33. Albanese CV, Diessel E, Genant HK. Clinical applications of body
com-position measurements using DXA. J Clin Densitom 2003;6:75-85. 34. Jebb S. Workshop on body composition methodology. Proc Soc 1995.
569-577.
35. Brucki SMD, Nitrini R, Caramelli P, Bertolucci PHF, Okamato IH. Sug-estões para o uso do Mini-Exame do Estado Mental no Brasil. Arq Neu-ropsiquiatr, 2003;61:777-781.
36. Nitrini R, Lefevre BH, Mathias SC, et al. Testes neuropsicológicos de aplicação simples para o diagnóstico de demência. Arq Neuropsiquiatr 1994;52:457-465.
37. Orsitto G. Different components of nutritional status in older inpatients with cognitive impairment. J Nutr Health Aging 2012;16:468-471. 38. Ding J, Kritchevsky SB, Newman AB, et al. Effects of birth cohort and
age on body composition in a sample of community-based elderly. Am J Clin Nutr 2007;85:405-410.